Kitchener—Conestoga
Kitchener—Conestoga (formerly known as Kitchener—Wilmot—Wellesley—Woolwich) is a federal electoral district in Ontario, Canada, that has been represented in the House of Commons of Canada since 2004. Its population in 2021 was 107,134. The riding is currently represented by Liberal MP Tim Louis. In the 2019 election, this is one of only two ridings in the country in which the Liberal candidate unseated the Conservative incumbent (the other being Milton).[3]
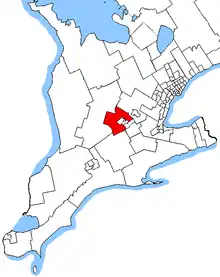 Kitchener—Conestoga in relation to Southern Ontario ridings | |||
| Federal electoral district | |||
| Legislature | House of Commons | ||
| MP |
Liberal | ||
| District created | 2003 | ||
| First contested | 2004 | ||
| Last contested | 2021 | ||
| District webpage | profile, map | ||
| Demographics | |||
| Population (2021)[1] | 107,134 | ||
| Electors (2021) | 75,079 | ||
| Area (km²)[2] | 896.18 | ||
| Pop. density (per km²) | 119.5 | ||
| Census division(s) | Waterloo | ||
| Census subdivision(s) | Kitchener, Wellesley, Wilmot, Woolwich | ||
Geography
The district includes the townships of Woolwich, Wellesley and Wilmot, and the southwestern part of the City of Kitchener, i.e., the part of the City of Kitchener lying west of Fischer-Hallman Road.
The electoral district was created in 2003 from Waterloo—Wellington, part of Kitchener Centre, and part of Cambridge. It was known as "Kitchener—Wilmot—Wellesley—Woolwich" from 2004 to 2005.
This riding lost almost half of its territory to Kitchener South—Hespeler but gained territory from Kitchener Centre, Kitchener—Waterloo and a fraction from Wellington—Halton Hills during the 2012 electoral redistribution.
Demographics
According to the 2021 Canada Census[4]
Ethnic groups: 77.5% White, 6.9% South Asian, 2.8% Black, 2.4% Southeast Asian, 2.1% Indigenous, 1.9% Arab, 1.9% Latin American, 1.3% Chinese
Languages: 70.8% English, 3.5% German, 2.6% Pennsylvania German, 1.6% Punjabi, 1.5% Spanish, 1.4% Arabic, 1.2% Romanian, 1.1% Serbian
Religions: 59.5% Christian (20.0% Catholic, 7.9% Anabaptist, 4.4% Lutheran, 3.5% United Church, 2.7% Christian Orthodox, 2.4% Anglican, 1.7% Presbyterian, 1.6% Pentecostal, 1.2% Baptist, 14.1% Other), 5.1% Muslim, 2.3% Hindu, 1.7% Sikh, 1.3% Buddhist, 29.5% None
Median income: $46,800 (2020)
Average income: $57,650 (2020)
Members of Parliament
| Parliament | Years | Member | Party | |
|---|---|---|---|---|
| Kitchener—Conestoga Riding created from Waterloo—Wellington, Kitchener Centre and Cambridge |
||||
| 38th | 2004–2006 | Lynn Myers | Liberal | |
| 39th | 2006–2008 | Harold Albrecht | Conservative | |
| 40th | 2008–2011 | |||
| 41st | 2011–2015 | |||
| 42nd | 2015–2019 | |||
| 43rd | 2019–2021 | Tim Louis | Liberal | |
| 44th | 2021–present | |||
Election results
| 2021 Canadian federal election | ||||||||
|---|---|---|---|---|---|---|---|---|
| Party | Candidate | Votes | % | ±% | Expenditures | |||
| Liberal | Tim Louis | 20,025 | 39.3 | -0.4 | $87,010.06 | |||
| Conservative | Carlene Hawley | 19,448 | 38.2 | -0.8 | $102,975.68 | |||
| New Democratic | Narine Dat Sookram | 5,948 | 11.7 | +1.6 | $3,366.91 | |||
| People's | Kevin Dupuis | 3,690 | 7.2 | +5.7 | $7,913.55 | |||
| Green | Owen Bradley | 1,842 | 3.6 | -6.0 | $6,206.36 | |||
| Total valid votes | 50,953 | 99.4 | ||||||
| Total rejected ballots | 290 | 0.6 | ||||||
| Turnout | 51,243 | 68.3 | ||||||
| Eligible voters | 75,079 | |||||||
| Liberal hold | Swing | +0.2 | ||||||
| Source: Elections Canada[5] | ||||||||
| 2019 Canadian federal election | ||||||||
|---|---|---|---|---|---|---|---|---|
| Party | Candidate | Votes | % | ±% | Expenditures | |||
| Liberal | Tim Louis | 20,480 | 39.7 | -3.15 | $78,912.65 | |||
| Conservative | Harold Albrecht | 20,115 | 39.0 | -4.22 | $90,924.77 | |||
| New Democratic | Riani De Wet | 5,204 | 10.1 | +0.4 | none listed | |||
| Green | Stephanie Goertz | 4,946 | 9.6 | +6.88 | none listed | |||
| People's | Koltyn Wallar | 790 | 1.5 | – | $0.00 | |||
| Total valid votes/expense limit | 51,535 | 100.0 | ||||||
| Total rejected ballots | 361 | |||||||
| Turnout | 51,896 | 69.6 | -0.24 | |||||
| Eligible voters | 74,562 | |||||||
| Liberal gain from Conservative | Swing | +0.54 | ||||||
| Source: Elections Canada[6][7] | ||||||||
| 2015 Canadian federal election | ||||||||
|---|---|---|---|---|---|---|---|---|
| Party | Candidate | Votes | % | ±% | Expenditures | |||
| Conservative | Harold Albrecht | 20,649 | 43.29 | -11.12 | $126,202.90 | |||
| Liberal | Tim Louis | 20,398 | 42.76 | +19.29 | $65,863.92 | |||
| New Democratic | James Villeneuve | 4,653 | 9.75 | -8.50 | $13,161.73 | |||
| Green | Bob Jonkman | 1,314 | 2.75 | -0.89 | $1,743.36 | |||
| Libertarian | Richard Hodgson | 685 | 1.44 | – | – | |||
| Total valid votes/Expense limit | 47,699 | 100.00 | $202,562.28 | |||||
| Total rejected ballots | 227 | 0.47 | – | |||||
| Turnout | 47,926 | 69.84 | – | |||||
| Eligible voters | 68,623 | |||||||
| Conservative hold | Swing | -15.21 | ||||||
| Source: Elections Canada[8][9] | ||||||||
| 2011 federal election redistributed results[10] | |||
|---|---|---|---|
| Party | Vote | % | |
| Conservative | 21,914 | 54.41 | |
| Liberal | 9,454 | 23.47 | |
| New Democratic | 7,350 | 18.25 | |
| Green | 1,469 | 3.65 | |
| Others | 86 | 0.21 | |
| 2011 Canadian federal election | ||||||||
|---|---|---|---|---|---|---|---|---|
| Party | Candidate | Votes | % | ±% | Expenditures | |||
| Conservative | Harold Albrecht | 28,902 | 54.12 | +4.80 | $87,677.43 | |||
| New Democratic | Lorne Bruce | 11,665 | 21.84 | +6.81 | $9,277.86 | |||
| Liberal | Robert Rosehart | 10,653 | 19.95 | -4.94 | – | |||
| Green | Albert Ashley | 2,184 | 4.09 | -6.65 | – | |||
| Total valid votes/Expense limit | 53,404 | 100.00 | $92,867.94 | |||||
| Total rejected ballots | 171 | 0.32 | 0.00 | |||||
| Turnout | 53,575 | 61.10 | +4.58 | |||||
| Eligible voters | 87,689 | – | – | |||||
| Conservative hold | Swing | +5.80 | ||||||
| 2008 Canadian federal election | ||||||||
|---|---|---|---|---|---|---|---|---|
| Party | Candidate | Votes | % | ±% | Expenditures | |||
| Conservative | Harold Albrecht | 23,525 | 49.32 | +8.10 | $84,798 | |||
| Liberal | Orlando Da Silva | 11,876 | 24.89 | -13.59 | $75,077 | |||
| New Democratic | Rod McNeil | 7,173 | 15.03 | +0.15 | $6,494 | |||
| Green | Jamie Kropf | 5,124 | 10.74 | +5.33 | $33,066 | |||
| Total valid votes/Expense limit | 47,698 | 100.00 | $88,113 | |||||
| Total rejected ballots | 153 | 0.32 | ||||||
| Turnout | 47,851 | 56.52 | ||||||
| Conservative hold | Swing | +10.85 | ||||||
| 2006 Canadian federal election | ||||||||
|---|---|---|---|---|---|---|---|---|
| Party | Candidate | Votes | % | ±% | ||||
| Conservative | Harold Albrecht | 20,615 | 41.22 | +5.86 | ||||
| Liberal | Lynn Myers | 19,245 | 38.48 | -3.80 | ||||
| New Democratic | Len Carter | 7,443 | 14.88 | -0.83 | ||||
| Green | Kris Stapleton | 2,706 | 5.41 | -1.22 | ||||
| Total valid votes | 50,009 | 100.00 | ||||||
| Conservative gain from Liberal | Swing | +4.83 | ||||||
| 2004 Canadian federal election | ||||||||
|---|---|---|---|---|---|---|---|---|
| Party | Candidate | Votes | % | |||||
| Liberal | Lynn Myers | 17,819 | 42.29 | |||||
| Conservative | Frank Luellau | 14,903 | 35.37 | |||||
| New Democratic | Len Carter | 6,623 | 15.72 | |||||
| Green | Kris Stapleton | 2,793 | 6.63 | |||||
| Total valid votes | 42,138 | 100.00 | ||||||
References
- "Kitchener—Conestoga (Code 35038) Census Profile". 2011 census. Government of Canada - Statistics Canada. Retrieved March 3, 2011.
- Riding history from the Library of Parliament
- 2011 Results from Elections Canada
- Campaign expense data from Elections Canada
Notes
- Statistics Canada: 2022
- Statistics Canada: 2022
- Cheung, Christopher (October 23, 2019). "Liberals Prove Kings of Tight Ridings. And More Election Crunching". The Tyee. Retrieved September 18, 2020.
- Government of Canada, Statistics Canada (February 9, 2022). "Profile table, Census Profile, 2021 Census of Population - Kitchener--Conestoga [Federal electoral district (2013 Representation Order)], Ontario". www12.statcan.gc.ca. Retrieved April 4, 2023.
- "List of confirmed candidates – September 20, 2021 Federal Election". Elections Canada. Retrieved September 2, 2021.
- "List of confirmed candidates". Elections Canada. Retrieved October 4, 2019.
- "Election Night Results". Elections Canada. Retrieved November 1, 2019.
- Elections Canada – Confirmed candidates for Kitchener—Conestoga, 30 September 2015
- Elections Canada – Preliminary Election Expenses Limits for Candidates Archived 2015-08-15 at the Wayback Machine
- Pundits' Guide to Canadian Elections