List of cities by GDP
This is a list of cities in the world by gross domestic product (GDP). The United Nations uses three definitions for what constitutes a city, as not all cities may be classified using the same criteria. Cities may be defined as the cities proper, the extent of their urban area, or their metropolitan regions.[3] The methodology of calculating GDP may differ between the studies and are widely based on projections and sometimes approximate estimations, notably for cities that are not within the Organisation for Economic Co-operation and Development. Refer to sources for more information. Click on the headers to reorganize columns.
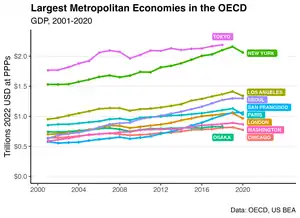
Largest metropolitan areas by GDP
| Rank (nominal) |
Rank (PPP) |
Metropolitan area | Country/region | UNSD subregion[4] | Visual Capitalist[5] 2021 est. GDP (billion US$) | |
|---|---|---|---|---|---|---|
| Unadjusted | PPP-adjusted | |||||
| 1 | 1 | Greater Tokyo Area | Eastern Asia | 2,055.698 | 2,205.652 | |
| 2 | 2 | New York metropolitan area | North America | 1,874.398 | 1,874.398 | |
| 3 | 3 | Greater Los Angeles | North America | 1,133.627 | 1,133.627 | |
| 4 | 5 | Paris metropolitan area | Western Europe | 989.987 | 1,074.242 | |
| 5 | 6 | London metropolitan area | Northern Europe | 978.402 | 1,064.297 | |
| 6 | 4 | Seoul Capital Area | Eastern Asia | 926.790 | 1,125.042 | |
| 7 | 13 | Chicago metropolitan area | North America | 714.697 | 714.697 | |
| 8 | 10 | Keihanshin | Eastern Asia | 699.474 | 897.418 | |
| 9 | 15 | Rhine-Ruhr metropolitan region | Western Europe | 636.449 | 698.982 | |
| 10 | 7 | Shanghai | Eastern Asia | 633.935 | 1,018.815 | |
| 11 | 21 | San Francisco | North America | 593.629 | 593.629 | |
| 12 | 9 | Beijing | Eastern Asia | 591.374 | 950.671 | |
| 13 | 24 | Washington metropolitan area | North America | 578.985 | 578.985 | |
| 14 | 28 | Dallas–Fort Worth metroplex | North America | 523.854 | 523.854 | |
| 15 | 29 | Greater Boston | North America | 513.211 | 513.211 | |
| 16 | 8 | Moscow metropolitan area | Eastern Europe | 504.808 | 1,004.849 | |
| 17 | 30 | Greater Houston | North America | 489.377 | 489.377 | |
| 18 | 14 | Shenzhen | Eastern Asia | 455.694 | 704.486 | |
| 19 | 34 | Greater Philadelphia | North America | 455.653 | 455.653 | |
| 20 | 31 | Greater Toronto Area | North America | 452.492 | 475.232 | |
| 21 | 35 | Seattle metropolitan area | North America | 444.337 | 444.337 | |
| 22 | 36 | Atlanta metropolitan area | North America | 432.009 | 432.009 | |
| 23 | 22 | Taipei–Keelung metropolitan area | Eastern Asia | 407.838 | 585.867 | |
| 24 | 17 | Chongqing | Eastern Asia | 407.562 | 657.985 | |
| 25 | 16 | Guangzhou | Eastern Asia | 405.355 | 664.854 | |
| 26 | Sydney | Oceania | 398.037 | |||
| 27 | 42 | Miami metropolitan area | North America | 388.725 | 388.725 | |
| 28 | 40 | Chūkyō metropolitan area | Eastern Asia | 379.301 | 403.861 | |
| 29 | 19 | Singapore | Eastern Asia | 374.394 | 600.063 | |
| 30 | 32 | Hong Kong | Eastern Asia | 368.633 | 472.395 | |
| 31 | 47 | Santa Clara County, California | North America | 359.111 | 359.111 | |
| 32 | 39 | Milan metropolitan area | Southern Europe | 329.529 | 405.516 | |
| 33 | Melbourne | Oceania | 318.677 | |||
| 34 | 12 | Jakarta metropolitan area | South-Eastern Asia | 203.702 | 841.605 | |
| 35 | 27 | Suzhou | Eastern Asia | 301.510 | 526.904 | |
| 36 | 48 | San Diego County, California | North America | 283.330 | 283.330 | |
| 37 | 44 | Madrid metropolitan area | Southern Europe | 280.937 | 376.565 | |
| 38 | 49 | Phoenix metropolitan area | North America | 278.841 | 278.841 | |
| 39 | 18 | Mumbai Metropolitan Region | South Asia | 277.980 | 606.625 | |
| 40 | 20 | National Capital Region (India) | South Asia | 272.603 | 594.884 | |
| 41 | 50 | Minneapolis–Saint Paul | North America | 272.373 | 272.373 | |
| 42 | 51 | Metro Detroit | North America | 267.731 | 267.731 | |
| 43 | 23 | Greater São Paulo | South America | 261.642 | 583.821 | |
| 44 | 33 | Chengdu | Eastern Asia | 260.409 | 468.382 | |
| 45 | Busan–Gyeongnam Area | Eastern Asia | 252.145 | |||
| 46 | 25 | Bangkok Metropolitan Region | South-Eastern Asia | 252.128 | 559.911 | |
| 47 | 26 | Greater Mexico City | North America | 250.455 | 547.457 | |
| 48 | Munich Metropolitan Region | Western Europe | 249.764 | |||
| 49 | 41 | Hangzhou | Eastern Asia | 248.721 | 396.722 | |
| 50 | 11 | Istanbul | Western Asia | 247.312 | 858.706 | |
| 51 | Berlin/Brandenburg Metropolitan Region | Western Europe | 243.160 | |||
| 52 | 45 | Tianjin | Eastern Asia | 235.664 | 370.885 | |
| 37 | Wuhan | Eastern Asia | 409.508 | |||
| 38 | Greater Dhaka | South Asia | 405.872 | |||
| 43 | Greater Buenos Aires | South America | 381.762 | |||
| 46 | Nanjing | Eastern Asia | 363.228 | |||
List
Each of the columns in the table is sortable by pressing on the arrows at the head of the column:
| Rank | City proper/metropolitan area | Country/region | Official est. GDP up to date (billion US$) |
Metropolitan population |
Official est. GDP per capita |
|---|---|---|---|---|---|
| 300+ | Abbotsford, British Columbia | 6.141 (2019)[6] | 202,497 (2019)[7] | 30,321.44 | |
| 300+ | Aberdeen | 23.0 (2020)[8] | 489,840 (2020)[9] | 46,957.94 | |
| 300+ | Abidjan | 27 (2017)[10] | 5,950,000 (2022)[11] | 4,537.82 | |
| 110 | Abu Dhabi | 119 (2015)[12] | 1,660,000 (2022)[11] | 71,686.75 | |
| 203 | Adelaide | 64.461 (2018–19)[13] | 1,380,000 (2022)[11] | 46,710.87 | |
| 170 | Ahmedabad | 80 (2023)[14] | 9,300,000 (2023)[15] | 8,602.15 | |
| 300+ | Alexandria | 6,050,000 (2022)[11] | 5,355.37 | ||
| 300+ | Almaty | 36 (2010)[16] | 2,250,000 (2022)[11] | 16,000.00 | |
| 300+ | Anápolis | 6.740 (2011)[17] | 391,772 (2020)[18] | 17,203.88 | |
| 177 | Ankara | 74.83 (2021)[19] | 5,150,000 (2021)[20] | 14,530.10 | |
| 193 | Anshan | 2,350,000 (2022)[11] | 28,694.47 | ||
| 164 | Auckland | 81.227 (2022)[21] | 1,470,000 (2022)[11] | 55,256.46 | |
| 300+ | Ballarat | 4.460 (2018–19)[13] | 109,553 (2020)[22] | 40,710.89 | |
| 300+ | Bandung | 38.3 (2021)[23] | 6,850,000 (2022)[11] | 5,591.24 | |
| 300+ | Batam | 35.3 | 1,170,000 (2022)[11] | 30,170.94 | |
| 46 | Bangkok | 252.128 (2021)[5] | 19,900,000 (2022)[11] | 12,669.75 | |
| 269 | Baotou | 40.8 (2017)[24] | 2,150,000 (2022)[11] | 18,976.74 | |
| 300+ | Barrie | 6.382 (2019)[6] | 214,350 (2019)[7] | 29,764.40 | |
| 11 | Beijing | 618.648 (2022)[25] | 20,500,000 (2022)[11] | 30,177.95 | |
| 300+ | Belfast | 25.5 (2015)[26] | 1,115,936 (2020)[27] | 22,850.77 | |
| 300+ | Belgrade | 17.4 (2014)[28] | 1,430,000 (2022)[11] | 12,167.83 | |
| 300+ | Belleville, Ontario | 3.98 (2019)[6] | 111,180 (2019)[7] | 35,797.81 | |
| 228 | Belo Horizonte | 54.996 (2011)[17] | 5,100,000 (2022)[11] | 10,783.53 | |
| 300+ | Bendigo | 3.961 (2018–19)[13] | 100,632 (2021)[29] | 39,361.24 | |
| 119 | Bengaluru | 110 (2022)[30] | 13,200,000 (2022)[11] | 8,333.33 | |
| 300+ | Bhopal | 3.96 (2016–17)[31] | 2,550,000 (2022)[11] | 1,552.94 | |
| 300+ | Birmingham | 39.1 (2020) | 3,150,000 (2022)[11] | 12,412.70 | |
| 92 | Bogotá | 10,000,000 (2022)[11] | 15,985.00 | ||
| 300+ | Brantford | 4.51 (2019)[6] | 149,522 (2019)[7] | 30,162.79 | |
| 202 | Brasília | 65.338 (2015)(8th) | 4,100,000 (2022)[11] | 15,936.10 | |
| 75 | Brisbane | 177 (2018–19)[13] | 2,620,873 (2022)[11] | 67,534.75 | |
| 300+ | Bristol | 22.3 (2020)[26] | 465,866 (2020)[32] | 47,864.35 | |
| 157 | Buenos Aires | 84.7 (2011)[33] | 16,800,000 (2022)[11] | 18,750.00 | |
| 168 | Bursa | 2,175,000 (2022)[11] | 36,810.57 | ||
| 45 | Busan-Gyeongnam Area | 252.145 (2021)[5] | 7,038,129 (2022)[11] | 35,825.57 | |
| 300+ | Cairns | 10.709 (2018–19)[13] | 153,951 (2019)[34] | 69,561.09 | |
| 130 | Cairo | 21,900,000 (2022)[11] | 4,665.07 | ||
| 159 | Calgary | 83.856 (2019)[6] | 1,514,426 (2019)[7] | 55,374.12 | |
| 294 | Campinas | 40.525 (2011)[17] | 3,275,000 (2022)[11] | 12,374.05 | |
| 300+ | Campo Grande | 9.59 (2013)[35] | 916,001 (2021)19th | 10,469.42 | |
| 300+ | Campos dos Goytacazes | 5.358 (2016)[36] | 511,168 (2020)[37] | 10,481.88 | |
| 300+ | Canberra | 30.909 (2018–19)[13] | 431,380 (2020)[38] | 71,651.44 | |
| 300+ | Cape Town | 4,375,000 (2022)[11] | 13,454.40 | ||
| 187 | Caracas | 70 (2012)[39] | 3,800,000 (2022)[11] | 18,421.05 | |
| 249 | Cardiff-Newport | 49.5 (2020)[26] | 1,552,527 (2020)[32] | 31,884.06 | |
| 300+ | Casablanca | 4,625,000 (2022)[11] | 8,192.00 | ||
| 300+ | Chandigarh | 17.30 (2017)[40] | 2,500,000 (2022)[11] | 6,920.00 | |
| 140 | Changchun | 96.7 (2017)[24] | 4,375,000 (2022)[11] | 22,102.86 | |
| 62 | Changsha | 208.97 (2021)[41] | 5,050,000 (2021)[20] | 41,380.20 | |
| 136 | Changzhou | 98.1 (2017)[24] | 12,400,000 (2015)[42] | 7,911.29 | |
| 42 | Chengdu | 260.409 (2021)[5] | 10,000,000 (2021)[43] | 26,040.90 | |
| 198 | Chennai | 66 (2012)[30] | 11,900,000 (2022)[11] | 5,546.22 | |
| 284 | Coimbatore | 42 (2021) | 2,850,000 (2022)[11] | 14,736.84 | |
| 300+ | Chittagong | 25.5 (2019)[44] | 5,100,000 (2022)[11] | 5,000.00 | |
| 26 | Chongqing | 407.562 (2021)[5] | 8,400,000 (2021)[45] | 48,519.29 | |
| 300+ | Cocos (Keeling) Islands | 0.01101255 (2010)[46] | 544 (2016)[47] | 20,243.66 | |
| 300+ | Coventry | 13.9 (2020)[48][49] | 379,387 (2020)[50] | 36,675.46 | |
| 222 | Curitiba | 58.082 (2011)[17] | 3,500,000 (2022)[11] | 16,594.86 | |
| 231 | Daegu | 2,750,000 (2022)[11] | 19,802.18 | ||
| 299 | Daejeon | 1,540,000 (2022)[11] | 25,723.38 | ||
| 120 | Dalian | 109.1 (2017)[24] | 5,050,000 (2022)[11] | 21,603.96 | |
| 300+ | Dar es Salaam | 10.4 (2019)[51] | 6,750,000 (2022)[11] | 1,540.74 | |
| 298 | Daqing | 39.7 (2017)[24] | 1,820,000 (2022)[11] | 21,813.19 | |
| 39 | National Capital Region (India) | 272.603 (2021)[5] | 31,300,000 (2021)[20] | 8,709.36 | |
| 91 | Dhaka | 160 (2020)[52] | 20,900,000 (2022)[11] | 7,655.50 | |
| 114 | Dongguan | 112.3 (2017)[24] | 10,486,625 (2020)[53] | 10,708.88 | |
| 209 | Dongying | 61.89 (2018)[24] | 2,193,518 (2020)[54][55] | 28,214.95 | |
| 129 | Dubai | 102.67 (2018)[56] | 4,264,316 (2022)[11] | 24,076.55 | |
| 254 | Durban | 3,525,000 (2022)[11] | 13,874.61 | ||
| 227 | East Rand | 3,178,470 | 17,409.95 | ||
| 300+ | Edinburgh | 32.9 (2020)[26] | 527,620 (2020)[57] | 62,357.85 | |
| 190 | Edmonton | 69.015 (2019)[6] | 1,442,835 (2019)[7] | 47,829.45 | |
| 279 | Faisalabad | 43 (2013)[58] | 3,850,000 (2022)[11] | 11,168.83 | |
| 300+ | Fortaleza | 21.7 (2012)[59] | 3,750,000 (2022)[11] | 5,786.67 | |
| 102 | Foshan | 139 (2017)[24] | 8,820,933 (2017)[60] | 15,757.97 | |
| 72 | Fukuoka–Kitakyushu | 185 (2013)[61] | 4,765,000 (2022)[11] | 38,824.76 | |
| 111 | Fuzhou | 118.683 (2018)[62] | 4,450,000 (2022)[11] | 26,670.34 | |
| 300+ | Geelong | 8.725 (2018–19)[13] | 268,984 (2021)[63][64] | 32,436.87 | |
| 270 | Geneva | 201,818 (2018)[65] | 217,919.12 | ||
| 300+ | George Town | 2,050,000 (2022)[11] | 18,533.17 | ||
| 300+ | Gibraltar | 3.265 (2022)[66][67] | 34,003 (2020)[68] | 96,020.94 | |
| 300+ | Gladstone | 4.464 (2018–19)[13] | 45,130 (2018)[69] | 98,914.25 | |
| 192 | Glasgow | 67.7 (2020)[26] | 1,690,000 (2022)[11] | 40,059.17 | |
| 300+ | Gold Coast | 26.669 (2018–19)[13] | 679,127 (2018)[70] | 39,269.53 | |
| 300+ | Goiânia | 22.763 (2011)[17] | 2,500,000 (2022)[11] | 9,105.20 | |
| 167 | Guadalajara | 5,650,000 (2022)[11] | 14,275.40 | ||
| 27 | Guangzhou | 405.355 (2021)[5] | 18,676,605 (2020)[71] | 21,703.89 | |
| 300+ | Guelph | 7.916 (2019)[6] | 165,125 (2019)[7] | 47,963.66 | |
| 300+ | Gujranwala | 15.681 (2016)[72] | 2,975,000 (2022)[11] | 5,270.97 | |
| 300+ | Gwangju | 1,630,000 (2022)[11] | 22,490.80 | ||
| 295 | Haifa | 1,050,000 (2019)[73] | 38,476.19 | ||
| 300+ | Halifax, Nova Scotia | 18.163 (2019)[6] | 439,835 (2019)[7] | 41,288.21 | |
| 232 | Hamamatsu | 54.3 (2010)[74][75] | 1,310,000 (2022)[11] | 41,450.38 | |
| 300+ | Hamilton, Ontario | 28.322 (2019)[6] | 795,410 (2019)[7] | 35,604.28 | |
| 49 | Hangzhou | 248.721 (2021)[5] | 8,600,000 (2021)[76] | 28,921.05 | |
| 282 | Hanoi | 42.04 (2019)[77] | 4,125,000 (2022)[11] | 10,191.52 | |
| 142 | Harbin | 94.1 (2017)[24] | 5,300,000 (2022)[11] | 17,754.72 | |
| 100 | Hefei | 141.135 (2019)[24] | 7,150,000 (2022)[11] | 19,739.16 | |
| 211 | Hiroshima | 61.3 (2010)[78][75] | 1,870,000 (2022)[11] | 32,780.75 | |
| 300+ | Hobart | 11.388 (2018–19)[13] | 232,670 (2020)[79] | 48,944.86 | |
| 141 | Ho Chi Minh City | 96.399 (2022)[80] | 10,900,000 (2022)[11] | 8,843.90 | |
| 29 | Hong Kong | 382.854 (2023)[81] | 7,302,000(2023)[81] | 52,429.49 | |
| 300+ | Hsinchu | 448,207 (2020)[82] | 85,627.85 | ||
| 248 | Huhehaote | 49.62 (2015)[83] | 2,475,000 (2022)[11] | 20,048.48 | |
| 300+ | Hyderabad | 74 (2016)[84] | 10,700,000 (2022)[11] | 6,915.89 | |
| 300+ | Indore | 6.294(2016–17)[31] | 3,400,000 (2022)[11] | 1,851.18 | |
| 50 | Istanbul | 247.312 (2021)[5] | 16,500,000 (2022)[11] | 14,988.61 | |
| 169 | Izmir | 3,075,000 (2022)[11] | 26,036.10 | ||
| 300+ | Jaipur | 15 (2021)[85] | 4,050,000 (2021)[20] | 3,703.70 | |
| 33 | Jakarta | 308.25 (2021)[5] | 26,704,514 (2022)[11] | 11,542.99 | |
| 89 | Jeddah-Mecca | 7,550,000 (2022)[11] | 21,273.77 | ||
| 259 | Jerusalem | 48.0 (2015)[86] | 1,030,000 (2022)[11] | 46,601.94 | |
| 105 | Jinan | 132.933 (2018)[24] | 6,200,000 (2022)[11] | 21,440.81 | |
| 176 | Johannesburg | 76 (2014)[87] | 8,400,042 (2022)[11] | 9,047.57 | |
| 300+ | Jundiaí | 20.081 (2011)[17] | 423,006 (2020)[88] | 47,472.14 | |
| 300+ | Kabul | 6 | 4,625,000 (2022)[11] | 1,297.30 | |
| 300+ | Kagoshima | 1,126,639 (2015)[89] | 30,460.51 | ||
| 117 | Kaohsiung | 2,775,000 (2022)[11] | 40,953.87 | ||
| 64 | Karachi | 200.00 (2021)[90] | 14,910,352 (2022)[11] | 3,224.48 | |
| 300+ | Kelowna | 8.224 (2019)[6] | 218,600 (2019)[7] | 37,602.93 | |
| 300+ | Kyiv | 27.5 (2020)[91] | 3,500,000 (2022)[11] | 7,857.00 | |
| 300+ | Kingston, Ontario | 7.092 (2019)[6] | 174,723 (2019)[7] | 40,578.52 | |
| 300+ | Kitchener, Ontario | 25.277 (2019)[6] | 581,607 (2019)[7] | 43,465.78 | |
| 215 | Kolkata | 15,535,904 (2014)[92] | 3,890.79 | ||
| 218 | Kuala Lumpur | 59.831 (2019)[62] | 9,100,000 (2022)[11] | 6,574.84 | |
| 297 | Kumamoto | 39.8 (2010)[74][93] | 1,150,000 (2022)[11] | 34,608.70 | |
| 183 | Kunming | 72.0 (2017)[24] | 6,000,000 (2022)[11] | 12,000.00 | |
| 84 | Kuwait City | 4,325,000 (2022)[11] | 38,486.01 | ||
| 178 | Lagos | 74.67 (2010)[94] | 20,700,000 (2022)[11] | 3,607.25 | |
| 221 | Lahore | 93.408 (2021) | 13,900,000 (2022)[11] | 4,182.73 | |
| 300+ | Launceston | 3.961 (2018–19)[13] | 110,500 (2021)[95] | 35,846.15 | |
| 300+ | Leeds | 37.1 (2020)[48][49] | 2,175,000 (2022)[11] | 17,057.47 | |
| 300+ | Lethbridge | 5.082 (2019)[6] | 126,927 (2019)[7] | 40,023.01 | |
| 300+ | Lima | 11,400,000 (2022)[11] | 15,477.81 | ||
| 252 | Liverpool | 49.3 (2020)[48][49] | 1,880,000 (2022)[11] | 26,223.40 | |
| 4 | London | 978.402 (2021)[5] | 14,800,000 (2022)[11] | 66,108.24 | |
| 300+ | London, Ontario | 21.669 (2019)[6] | 542,155 (2019)[7] | 39,970.12 | |
| 300+ | Lucknow | 7.68 (2019–20)[96] | 3,900,000 (2022)[11] | 1,969.23 | |
| 300+ | Macau | 35.841 (2023)[81] | 709,000 (2023)[81] | 50,571.92 | |
| 300+ | Mackay | 6.540 (2018–19)[13] | 80,148 (2018)[97] | 81,599.04 | |
| 300+ | Manaus | 30.375 (2014)[98] | 2,275,000 (2022)[11] | 13,351.65 | |
| 128 | Manchester | 105.9 (2020)[99] | 3,100,000 (2022)[11] | 34,161.29 | |
| 66 | Manila | 192.6 (2018) | 26,400,000 (2022)[11] | 7,295.45 | |
| 255 | Medellín | 4,150,000 (2022)[11] | 10,472.77 | ||
| 235 | Medan | 52.4 (2019)[100] | 4,075,000 (2022)[11] | 12,858.90 | |
| 31 | Melbourne | 318.677 (2021)[5] | 5,150,000 (2022)[11] | 61,879.03 | |
| 47 | Mexico City | 250.455 (2021)[5] | 24,700,000 (2022)[11] | 10,139.88 | |
| 300+ | Minsk | 22 (2021)[101] | 2,000,000 (2022)[11] | 11,000.00 | |
| 300+ | Monaco | 6.816 (2020)[102] | 39,150 (2021)[103] | 174,099.62 | |
| 300+ | Moncton | 6.142 (2019)[6] | 155,891 (2019)[7] | 39,386.49 | |
| 101 | Monterrey | 140 (2015)[104] | 5,750,000 (2022)[11] | 24,347.83 | |
| 246 | Montevideo | 53.9 (2022)[105] | 1,870,000 (2022)[11] | 28,823.53 | |
| 76 | Montreal | 176.362 (2019)[6] | 4,334,308 (2019)[7] | 40,689.31 | |
| 17 | Moscow | 504.808 (2021)[5] | 17,400,000 (2022)[11] | 29,011.95 | |
| 300+ | Multan | 2,225,000 (2022)[11] | 7,831.46 | ||
| 37 | Mumbai | 277.98 (2021)[5] | 26,100,000 (2022)[11] | 10,650.57 | |
| 30 | Nagoya | 379.301 (2021)[5] | 10,500,000 (2022)[11] | 36,123.90 | |
| 300+ | Nagpur | 18.4 (2019–20)[106] | 3,375,000 (2022)[11] | 5,451.85 | |
| 300+ | Nairobi | 14.8 (2019)[107] | 6,300,000 (2022)[11] | 2,349.21 | |
| 179 | Nanchang | 74.1 (2017)[24] | 4,625,000 (2022)[11] | 16,021.62 | |
| 43 | Nanjing | 253.57 (2021)[108] | 6,700,000 (2021)[109] | 37,846.27 | |
| 233 | Nanning | 54.299 (2015)[110][111] | 7,765,411 (2015)[112] | 6,992.47 | |
| 106 | Nantong | 126.405 (2018)[24] | 3,125,000 (2022)[11] | 40,449.60 | |
| 300+ | Newcastle | 11.554 (2018–19)[13] | 322,278 (2016)[113] | 35,851.04 | |
| 277 | Niigata | 43.3 (2010)[114][93] | 1,395,612 (2015)[89] | 31,025.82 | |
| 54 | Ningbo | 233.479 (2022)[115] | 6,850,000 (2022)[11] | 34,084.53 | |
| 207 | Okayama | 63.1 (2010)[74][93] | 2,175,000 (2022)[11] | 29,011.49 | |
| 300+ | Orange | 3.204 (2018–19)[13] | 40,493 (2018)[70] | 79,124.79 | |
| 8 | Osaka–Kobe | 699.474 (2021)[5] | 17,700,000 (2022)[11] | 39,518.31 | |
| 300+ | Oshawa | 10.594 (2019)[6] | 414,531 (2019)[7] | 25,546.94 | |
| 184 | Oslo | 71.68 (2016)[116] | 1,220,000 (2022)[11] | 58,754.10 | |
| 195 | Ottawa | 66.826 (2019)[6] | 1,438,015 (2019)[7] | 46,473.79 | |
| 300+ | Palembang | 16.6(2021)[117] | 1,720,000 (2022)[11] | 9,651.16 | |
| 300+ | Patna | 12.635 (2011–12)[118] | 2,800,000 (2022)[11] | 4,512.50 | |
| 118 | Perth | 111.056 (2018–19)[13] | 2,125,000 (2022)[11] | 52,261.65 | |
| 300+ | Peterborough, Ontario | 3.891 (2019)[6] | 130,993 (2019)[7] | 29,696.24 | |
| 265 | Porto Alegre | 45.506 (2011)[17] | 4,175,000 (2022)[11] | 10,899.64 | |
| 245 | Pretoria | 2,921,488 (2011)[119] | 17,096.77 | ||
| 300+ | Puebla | 31.102 (2019)[120] | 4,100,000 (2022)[11] | 7,585.85 | |
| 146 | Pune | 92 (2021)[40] | 7,350,000 (2022)[11] | 9,387.76 | |
| 85 | Qingdao | 163.5 (2017)[24] | 7,050,000 (2022)[11] | 23,191.49 | |
| 300+ | Quebec City | 36.587 (2019)[6] | 825,234 (2019)[7] | 44,338.94 | |
| 300+ | Recife | 22.81 (2014)[121] | 3,875,000 (2022)[11] | 5,886.45 | |
| 300+ | Regina, Saskatchewan | 13.913 (2019)[6] | 260,914 (2019)[7] | 53,312.59 | |
| 61 | Rio de Janeiro | 209.366 (2011)[17] | 13,300,000 (2022)[11] | 15,741.80 | |
| 86 | Riyadh | 8,800,000 (2022)[11] | 18,576.82 | ||
| 300+ | Rockhampton | 5.342 (2018–19)[13] | 78,592 (2018)[122] | 67,971.29 | |
| 300+ | Saguenay, Quebec | 6.304 (2019)[6] | 162,591 (2019)[7] | 38,747.53 | |
| 300+ | St. Catharines–Niagara Falls | 13.018 (2019)[6] | 433,955 (2019)[7] | 30,003.11 | |
| 300+ | Saint John, New Brunswick | 4.915 (2019)[6] | 131,089 (2019)[7] | 37,455.47 | |
| 300+ | St. John's, Newfoundland and Labrador | 10.003 (2019)[6] | 213,113 (2019)[7] | 46,923.46 | |
| 165 | Saint Petersburg | 81.1 (2020)[123] | 5,600,000 (2022)[11] | 14,482.14 | |
| 300+ | Salvador | 17.98 (2016)[124][125] | 3,650,000 (2022)[11] | 4,926.03 | |
| 280 | San Juan | 1,990,000 (2022)[11] | 21,471.86 | ||
| 300+ | San Marino | 1.807 (2023)[81] | 34,000 (2023)[81] | 52,949.65 | |
| 172 | Santiago | 77.307 (2009)[126] | 6,254,949 (2009)[127] | 23,359.33 | |
| 300+ | Santos | 28.609 (2011)[17] | 1,770,000 (2022)[11] | 16,163.28 | |
| 300+ | São José dos Campos | 30.148 (2011)[17] | 2,528,354 (2020)[128] | 11,923.96 | |
| 300+ | São José dos Pinhais | 14.726 (2011)[17] | 329,058 (2020)[129] | 44,751.99 | |
| 41 | São Paulo | 261.642 (2021)[5] | 22,700,000 (2022)[11] | 11,526.08 | |
| 158 | Sapporo | 84.7 (2010)[74][93] | 2,500,000 (2022)[11] | 33,880.00 | |
| 300+ | Saskatoon | 15.595 (2019)[6] | 330,413 (2019)[7] | 47,183.37 | |
| 286 | Semarang | 41.1 | 2,075,000 (2022)[11] | 19,807.23 | |
| 210 | Sendai | 61.7 (2010)[74][75] | 1,510,000 (2022)[11] | 40,860.93 | |
| 6 | Seoul | 806.720 (2020)[130] | 24,800,000 (2022)[11] | 32,529.03 | |
| 10 | Shanghai | 663.874 (2022)[131] | 24,890,116 (2022)[11] | 26,672.19 | |
| 300+ | Shantou | 34.8 (2017)[132] | 7,950,000 (2022)[11] | 4,377.36 | |
| 300+ | Sharjah | 26.502 (2015)[133] | 1,785,684 (2022)[134] | 14,841.37 | |
| 290 | Sheffield | 40.6 (2020)[48][49] | 1,570,000 (2022)[11] | 25,859.87 | |
| 143 | Shenyang | 93.9 (2019)[135] | 8,400,000 (2022)[11] | 11,178.57 | |
| 21 | Shenzhen | 455.694 (2021)[5] | 14,678,000 (2021)[136] | 31,046.06 | |
| 300+ | Sherbrooke | 7.357 (2019)[6] | 221,325 (2019)[7] | 33,254.26 | |
| 163 | Shijiazhuang | 81.252 (2018)[132] | 5,750,000 (2022)[11] | 14,130.78 | |
| 300+ | Sunshine Coast | 13.813 (2018–19)[13] | 333,436 (2018)[137] | 41,426.24 | |
| 219 | Surat | 59.8 (2017)[40] | 7,150,000 (2022)[11] | 8,363.64 | |
| 263 | Shizuoka | 45.8 (2010)[74][93] | 1,130,000 (2022)[11] | 40,530.97 | |
| 16 | Singapore | 515.548 (2023)[81] | 5,659,000 (2023)[81] | 91,100.37 | |
| 300+ | Sorocaba | 21.313 (2011)[17] | 1,898,000 (2020)[138] | 11,229.19 | |
| 300+ | Greater Sudbury | 7.644 (2019)[6] | 171,968 (2019)[7] | 44,426.87 | |
| 149 | Surabaya | 88.8(2021)[139] | 5,850,000 (2022)[11] | 15,179.49 | |
| 34 | Suzhou | 301.510 (2021)[5] | 5,103,000 (2021)[140] | 59,084.85 | |
| 28 | Sydney | 398.037 (2021)[5] | 5,450,000 (2022)[11] | 73,034.31 | |
| 116 | Taichung | 2,450,000 (2022)[11] | 46,816.73 | ||
| 174 | Tainan | 1,310,000 (2022)[11] | 58,551.15 | ||
| 25 | Taipei | 407.838 (2021)[5] | 9,078,000 (2022)[11] | 44,926.59 | |
| 208 | Taiyuan | 5,550,000 (2022)[11] | 11,345.77 | ||
| 300+ | Tangerang | 38.6 | 1,895,486 (2020)[141] | 20,364.17 | |
| 139 | Tangshan | 96.716 (2018)[132] | 2,600,000 (2022)[11] | 37,198.46 | |
| 152 | Taoyuan | 2,254,363 (2020)[82] | 38,495.13 | ||
| 300+ | Tbilisi | 8.0 (2017)[142] | 1,380,000 (2022)[11] | 5,797.10 | |
| 68 | Tel Aviv | 188.42 (2022)[143] | 4,260,000 (2022)[143] | 44,230 | |
| 300+ | Thunder Bay | 4.94 (2019)[6] | 126,526 (2019)[7] | 39,043.36 | |
| 51 | Tianjin | 235.664 (2021)[5] | 13,200,000 (2021)[144] | 17,853.33 | |
| 300+ | Tokelau | 0.009406225[145] | 1,499 (2016)[146] | 6,275.00 | |
| 1 | Tokyo | 2,080.758 (2020)[147] | 40,700,000 (2022)[11] | 51,124.283 | |
| 300+ | Toowoomba | 7.118 (2018–19)[13] | 136,861 (2018)[122] | 52,008.97 | |
| 22 | Toronto | 452.492 (2021)[5] | 6,547,381 (2021)[7] | 69,110.08 | |
| 300+ | Trois-Rivières | 5.142 (2019)[6] | 160,902 (2019)[7] | 31,944.91 | |
| 300+ | Townsville | 9.075 (2018–19)[13] | 180,820 (2018)[148] | 50,188.03 | |
| 300+ | Uberlandia | 14.728 (2011)[17] | 699,097 (2020)[149] | 21,067.18 | |
| 107 | Vancouver | 123.211 (2019)[6] | 2,709,277 (2019)[7] | 45,477.08 | |
| 300+ | Victoria, British Columbia | 17.153 (2019)[6] | 403,466 (2019)[7] | 42,506.68 | |
| 276 | Vishakhapatnam | 43.5 (2017)[40] | 2,300,000 (2022)[11] | 18,913.04 | |
| 300+ | Vitória | 28.357 (2011)[17] | 1,900,000 (2022)[11] | 14,924.74 | |
| 300+ | Wagga Wagga | 4.392 (2018–19)[13] | 56,442 (2018)[70] | 77,814.39 | |
| 109 | Wenzhou | 119.2 (2022)[150] | 5,050,000 (2022)[11] | 23,603.96 | |
| 300+ | Windsor, Ontario | 12.33 (2019)[6] | 352,538 (2019)[7] | 34,974.95 | |
| 300+ | Winnipeg | 34.897 (2019)[6] | 844,331 (2019)[7] | 41,334.50 | |
| 300+ | Wollongong | 5.624 (2018–19)[13] | 309,345 (2020)[151] | 18,180.35 | |
| 38 | Wuhan | 274.68 (2021)(8th) [152] | 9,250,000 (2021)[153] | 29,695.14 | |
| 251 | Wulumuqi | 49.4 (2019)[154] | 3,575,000 (2017)[155] | 13,818.18 | |
| 93 | Wuxi | 155.7 (2017)[24] | 6,553,000 (2017) | 23,760.11 | |
| 145 | Xiamen | 92.554 (2020)[24] | 14,100,000 (2022)[11] | 6,564.11 | |
| 96 | Xian | 154.2 (2020)[24] | 11,600,000 (2022)[11] | 13,293.10 | |
| 137 | Xuzhou | 97.8 (2017)[24] | 3,050,000 (2022)[11] | 32,065.57 | |
| 123 | Yantai | 108.7 (2017)[24] | 2,450,000 (2022)[11] | 44,367.35 | |
| 300+ | Yerevan | 5.23 (2018)[156] | 1,510,000 (2022)[11] | 3,463.58 | |
| 99 | Zhengzhou | 144 (2018)[24] | 8,950,000 (2022)[11] | 16,089.39 | |
| 239 | Zhongshan | 51.1 (2017)[24] | 4,418,060 (2020)[157] | 11,566.16 | |
| 300+ | Zhuhai | 38.0 (2017)[24] | 2,325,000 (2022)[11] | 16,344.09 | |
| 186 | Zibo | 70.8 (2017)[24] | 3,725,000 (2022)[11] | 19,006.71 | |
| 300+ | Midland, TX MSA | 39.497 (2021)[158] | 173,180 (2021)[159] | 228,069 | |
| 24 | San Jose-Sunnyvale-Santa Clara, CA MSA | 410.418 (2021)[158] | 1,952,185 (2021)[159] | 210,235 | |
| 9 | San Francisco-Oakland-Berkeley, CA MSA | 668.677 (2021)[158] | 4,623,264 (2021)[159] | 144,633 | |
| 18 | Seattle-Tacoma-Bellevue, WA MSA | 479.966 (2021)[158] | 4,011,553 (2021)[159] | 119,646 | |
| 273 | Trenton-Princeton, NJ MSA | 43.633 (2021)[158] | 385,898 (2021)[159] | 113,069 | |
| 15 | Boston-Cambridge-Newton, MA-NH MSA | 531.671 (2021)[158] | 4,899,932 (2021)[159] | 108,506 | |
| 135 | Bridgeport-Stamford-Norwalk, CT MSA | 98.751 (2021)[158] | 959,768 (2021)[159] | 102,890 | |
| 2 | New York-Newark-Jersey City, NY-NJ-PA Metropolitan Statistical Area | 1,992.779 (2021)[158] | 19,768,458 (2021)[159] | 100,806 | |
| 300+ | Boulder, CO MSA | 33.182 (2021)[158] | 329,543 (2021)[159] | 100,691 | |
| 12 | Washington-Arlington-Alexandria, DC-VA-MD-WV MSA | 607.628 (2021)[158] | 6,356,434 (2021)[159] | 95,593 | |
| 113 | Salt Lake City, UT MSA | 118.494 (2021)[158] | 1,263,061 (2021)[159] | 93,815 | |
| 214 | Durham-Chapel Hill, NC MSA | 60.814 (2021)[158] | 654,012 (2021)[159] | 92,986 | |
| 300+ | Sioux Falls, SD MSA | 26.063 (2021)[158] | 281,958 (2021)[159] | 92,436 | |
| 300+ | Bloomington, IL MSA | 15.140 (2021)[158] | 170,889 (2021)[159] | 88,596 | |
| 300+ | Lima, OH MSA | 8.962 (2021)[158] | 101,670 (2021)[159] | 88,148 | |
| 127 | Hartford-East Hartford-Middletown, CT MSA | 106.507 (2021)[158] | 1,211,906 (2021)[159] | 87,884 | |
| 300+ | Columbus, IN MSA | 7.205 (2021)[158] | 82,475 (2021)[159] | 87,360 | |
| 3 | Los Angeles-Long Beach-Anaheim, CA MSA | 1,124.682 (2021)[158] | 12,997,353 (2021)[159] | 86,532 | |
| 44 | Denver-Aurora-Lakewood, CO MSA | 253.399 (2021)[158] | 2,972,566 (2021)[159] | 85,246 | |
| 213 | Des Moines-West Des Moines, IA MSA | 61.171 (2021)[158] | 719,146 (2021)[159] | 85,061 | |
| 300+ | Elkhart-Goshen, IN MSA | 17.529 (2021)[158] | 206,921 (2021)[159] | 84,713 | |
| 224 | Madison, WI MSA | 56.636 (2021)[158] | 683,183 (2021)[159] | 82,900 | |
| 65 | Austin-Round Rock-Georgetown, TX MSA | 193.773 (2021)[158] | 2,352,426 (2021)[159] | 82,372 | |
| 180 | Albany-Schenectady-Troy, NY MSA | 73.995 (2021)[158] | 899,286 (2021)[159] | 82,282 | |
| 300+ | Wheeling, WV-OH MSA | 11.239 (2021)[158] | 137,740 (2021)[159] | 81,596 | |
| 40 | San Diego-Chula Vista-Carlsbad, CA MSA | 267.973 (2021)[158] | 3,286,069 (2021)[159] | 81,548 | |
| 87 | Nashville-Davidson–Murfreesboro–Franklin, TN MSA | 163.031 (2021)[158] | 2,012,476 (2021)[159] | 81,010 | |
| 35 | Minneapolis-St. Paul-Bloomington, MN-WI MSA | 296.969 (2021)[158] | 3,690,512 (2021)[159] | 80,468 | |
| 7 | Chicago-Naperville-Elgin, IL-IN-WI MSA | 764.583 (2021)[158] | 9,509,934 (2021)[159] | 80,398 | |
| 300+ | Dubuque, IA MSA | 7.840 (2021)[158] | 98,718 (2021)[159] | 79,418 | |
| 56 | Baltimore-Columbia-Towson, MD MSA | 222.967 (2021)[158] | 2,838,327 (2021)[159] | 78,556 | |
| 300+ | Manchester-Nashua, NH MSA | 32.729 (2021)[158] | 424,079 (2021)[159] | 77,177 | |
| 20 | Atlanta-Sandy Springs-Alpharetta, GA MSA | 473.823 (2021)[158] | 6,144,050 (2021)[159] | 77,119 | |
| 13 | Dallas-Fort Worth-Arlington, TX MSA | 598.333 (2021)[158] | 7,759,615 (2021)[159] | 77,109 | |
| 63 | Charlotte-Concord-Gastonia, NC-SC MSA | 207.866 (2021)[158] | 2,701,046 (2021)[159] | 76,958 | |
| 300+ | Decatur, IL MSA | 7.856 (2021)[158] | 102,432 (2021)[159] | 76,695 | |
| 19 | Philadelphia-Camden-Wilmington, PA-NJ-DE-MD MSA | 477.580 (2021)[158] | 6,228,601 (2021)[159] | 76,675 | |
| 88 | Indianapolis-Carmel-Anderson, IN MSA | 162.062 (2021)[158] | 2,126,804 (2021)[159] | 76,200 | |
| 181 | Omaha-Council Bluffs, NE-IA MSA | 73.876 (2021)[158] | 971,637 (2021)[159] | 76,033 | |
| 80 | Cincinnati, OH-KY-IN MSA | 171.737 (2021)[158] | 2,259,935 (2021)[159] | 75,992 | |
| 300+ | Lake Charles, LA MSA | 15.791 (2021)[158] | 210,362 (2021)[159] | 75,066 | |
| 124 | Raleigh-Cary, NC MSA | 108.288 (2021)[158] | 1,448,411 (2021)[159] | 74,763 | |
| 300+ | California-Lexington Park, MD MSA | 8.554 (2021)[158] | 114,468 (2021)[159] | 74,728 | |
| 300+ | Santa Maria-Santa Barbara, CA MSA | 33.306 (2021)[158] | 446,475 (2021)[159] | 74,598 | |
| 14 | Houston-The Woodlands-Sugar Land, TX MSA | 537.066 (2021)[158] | 7,206,841 (2021)[159] | 74,522 | |
| 71 | Portland-Vancouver-Hillsboro, OR-WA MSA | 186.570 (2021)[158] | 2,511,612 (2021)[159] | 74,283 | |
| 300+ | Casper, WY MSA | 5.887 (2021)[158] | 79,555 (2021)[159] | 73,999 | |
| 300+ | Napa, CA MSA | 10.062 (2021)[158] | 136,207 (2021)[159] | 73,873 | |
| 271 | Harrisburg-Carlisle, PA MSA | 43.867 (2021)[158] | 596,305 (2021)[159] | 73,565 | |
| 300+ | Vallejo, CA MSA | 33.100 (2021)[158] | 451,716 (2021)[159] | 73,276 | |
| 94 | Columbus, OH MSA | 154.509 (2021)[158] | 2,151,017 (2021)[159] | 71,831 | |
| 300+ | Carson City, NV MSA | 4.225 (2021)[158] | 58,993 (2021)[159] | 71,619 | |
| 82 | Pittsburgh, PA MSA | 168.021 (2021)[158] | 2,353,538 (2021)[159] | 71,391 | |
| 300+ | Reno, NV MSA | 35.471 (2021)[158] | 497,535 (2021)[159] | 71,293 | |
| 300+ | Santa Rosa-Petaluma, CA MSA | 34.450 (2021)[158] | 485,887 (2021)[159] | 70,901 | |
| 300+ | Charlottesville, VA MSA | 15.762 (2021)[158] | 222,688 (2021)[159] | 70,781 | |
| 300+ | Odessa, TX MSA | 11.399 (2021)[158] | 161,091 (2021)[159] | 70,761 | |
| 300+ | Anchorage, AK MSA | 28.210 (2021)[158] | 398,807 (2021)[159] | 70,736 | |
| 262 | Syracuse, NY MSA | 46.414 (2021)[158] | 658,281 (2021)[159] | 70,508 | |
| 300+ | Salinas, CA MSA | 30.712 (2021)[158] | 437,325 (2021)[159] | 70,227 | |
| 300+ | Fargo, ND-MN MSA | 17.706 (2021)[158] | 252,136 (2021)[159] | 70,224 | |
| 300+ | Portland-South Portland, ME MSA | 39.089 (2021)[158] | 556,893 (2021)[159] | 70,191 | |
| 95 | Kansas City, MO-KS MSA | 154.328 (2021)[158] | 2,199,490 (2021)[159] | 70,165 | |
| 220 | Oxnard-Thousand Oaks-Ventura, CA MSA | 58.332 (2021)[158] | 839,784 (2021)[159] | 69,461 | |
| 300+ | Burlington-South Burlington, VT MSA | 15.669 (2021)[158] | 226,611 (2021)[159] | 69,145 | |
| 23 | Miami-Fort Lauderdale-Pompano Beach, FL MSA | 417.147 (2021)[158] | 6,091,747 (2021)[159] | 68,477 | |
| 300+ | Kankakee, IL MSA | 7.282 (2021)[158] | 106,601 (2021)[159] | 68,311 | |
| 300+ | San Angelo, TX MSA | 8.299 (2021)[158] | 122,344 (2021)[159] | 67,833 | |
| 300+ | Huntsville, AL MSA | 34.086 (2021)[158] | 502,728 (2021)[159] | 67,802 | |
| 300+ | Fairbanks, AK MSA | 6.477 (2021)[158] | 95,593 (2021)[159] | 67,756 | |
| 300+ | Sioux City, IA-NE-SD MSA | 10.111 (2021)[158] | 149,265 (2021)[159] | 67,739 | |
| 300+ | Wausau-Weston, WI MSA | 11.250 (2021)[158] | 166,189 (2021)[159] | 67,694 | |
| 300+ | Evansville, IN-KY MSA | 21.248 (2021)[158] | 313,946 (2021)[159] | 67,680 | |
| 300+ | Iowa City, IA MSA | 11.989 (2021)[158] | 177,239 (2021)[159] | 67,643 | |
| 300+ | Oshkosh-Neenah, WI MSA | 11.586 (2021)[158] | 171,623 (2021)[159] | 67,508 | |
| 300+ | Santa Cruz-Watsonville, CA MSA | 18.076 (2021)[158] | 267,792 (2021)[159] | 67,500 | |
| 194 | Urban Honolulu, HI MSA | 67.383 (2021)[158] | 1,000,890 (2021)[159] | 67,323 | |
| 300+ | Ithaca, NY MSA | 7.044 (2021)[158] | 105,162 (2021)[159] | 66,982 | |
| 69 | St. Louis, MO-IL MSA | 187.569 (2021)[158] | 2,809,299 (2021)[159] | 66,767 | |
| 300+ | Green Bay, WI MSA | 21.991 (2021)[158] | 329,490 (2021)[159] | 66,743 | |
| 300+ | Waterloo-Cedar Falls, IA MSA | 11.197 (2021)[158] | 167,796 (2021)[159] | 66,730 | |
| 223 | New Haven-Milford, CT MSA | 57.541 (2021)[158] | 863,700 (2021)[159] | 66,622 | |
| 90 | Sacramento-Roseville-Folsom, CA MSA | 160.542 (2021)[158] | 2,411,428 (2021)[159] | 66,575 | |
| 300+ | Appleton, Wisconsin metropolitan area | 16.202 (2021)[158] | 244,084 (2021)[159] | 66,379 | |
| 173 | Buffalo-Niagara Falls, NY MSA | 76.991 (2021)[158] | 1,162,336 (2021)[159] | 66,238 | |
| 300+ | Sheboygan, WI MSA | 7.747 (2021)[158] | 117,747 (2021)[159] | 65,794 | |
| 300+ | Lincoln, NE MSA | 22.492 (2021)[158] | 342,117 (2021)[159] | 65,744 | |
| 300+ | Ocean City, NJ MSA | 6.279 (2021)[158] | 95,661 (2021)[159] | 65,638 | |
| 300+ | Cheyenne, WY MSA | 6.608 (2021)[158] | 100,863 (2021)[159] | 65,515 | |
| 300+ | Gainesville, GA MSA | 13.561 (2021)[158] | 207,369 (2021)[159] | 65,396 | |
| 300+ | Barnstable Town, MA MSA | 15.150 (2021)[158] | 232,411 (2021)[159] | 65,186 | |
| 36 | Detroit-Warren-Dearborn, MI Metropolitan Statistical Area | 283.660 (2021)[158] | 4,365,205 (2021)[159] | 64,982 | |
| 300+ | Greeley, CO MSA | 22.082 (2021)[158] | 340,036 (2021)[159] | 64,940 | |
| 162 | New Orleans-Metairie, LA MSA | 81.829 (2021)[158] | 1,261,726 (2021)[159] | 64,855 | |
| 154 | Memphis, TN-MS-AR MSA | 86.493 (2021)[158] | 1,336,103 (2021)[159] | 64,735 | |
| 300+ | Ann Arbor, MI MSA | 23.859 (2021)[158] | 369,390 (2021)[159] | 64,590 | |
| 161 | Louisville/Jefferson County, KY-IN MSA | 82.866 (2021)[158] | 1,284,566 (2021)[159] | 64,509 | |
| 300+ | Davenport-Moline-Rock Island, IA-IL MSA | 24.603 (2021)[158] | 381,568 (2021)[159] | 64,479 | |
| 226 | Baton Rouge, LA MSA | 56.199 (2021)[158] | 871,905 (2021)[159] | 64,455 | |
| 300+ | Crestview-Fort Walton Beach-Destin, FL MSA | 18.899 (2021)[158] | 293,324 (2021)[159] | 64,430 | |
| 300+ | Grand Island, NE MSA | 4.871 (2021)[158] | 76,175 (2021)[159] | 63,945 | |
| 189 | Rochester, NY MSA | 69.341 (2021)[158] | 1,084,973 (2021)[159] | 63,910 | |
| 32 | Phoenix-Mesa-Chandler, AZ MSA | 316.090 (2021)[158] | 4,946,145 (2021)[159] | 63,906 | |
| 185 | Birmingham-Hoover, AL MSA | 70.874 (2021)[158] | 1,114,262 (2021)[159] | 63,606 | |
| 300+ | Lexington-Fayette, KY MSA | 32.851 (2021)[158] | 517,846 (2021)[159] | 63,438 | |
| 300+ | Norwich-New London, CT MSA | 17.008 (2021)[158] | 268,805 (2021)[159] | 63,273 | |
| 300+ | Kahului-Wailuku-Lahaina, HI MSA | 10.356 (2021)[158] | 164,221 (2021)[159] | 63,061 | |
| 300+ | Greenville, NC MSA | 10.841 (2021)[158] | 172,169 (2021)[159] | 62,967 | |
| 293 | Toledo, OH MSA | 40.546 (2021)[158] | 644,217 (2021)[159] | 62,938 | |
| 300+ | Springfield, IL MSA | 13.019 (2021)[158] | 206,898 (2021)[159] | 62,925 | |
| 191 | Grand Rapids-Kentwood, MI MSA | 68.401 (2021)[158] | 1,091,620 (2021)[159] | 62,660 | |
| 291 | Wichita, KS MSA | 40.586 (2021)[158] | 647,919 (2021)[159] | 62,641 | |
| 300+ | Savannah, GA MSA | 25.681 (2021)[158] | 410,008 (2021)[159] | 62,635 | |
| 300+ | Wilmington, NC MSA | 18.203 (2021)[158] | 291,833 (2021)[159] | 62,375 | |
| 242 | Charleston-North Charleston, SC MSA | 50.704 (2021)[158] | 813,052 (2021)[159] | 62,363 | |
| 300+ | Naples-Marco Island, FL MSA | 24.020 (2021)[158] | 385,980 (2021)[159] | 62,231 | |
| 83 | Orlando-Kissimmee-Sanford, FL MSA | 167.279 (2021)[158] | 2,691,925 (2021)[159] | 62,141 | |
| 300+ | Shreveport-Bossier City, LA MSA | 24.153 (2021)[158] | 389,155 (2021)[159] | 62,065 | |
| 133 | Jacksonville, FL MSA | 101.367 (2021)[158] | 1,637,666 (2021)[159] | 61,897 | |
| 300+ | State College, PA MSA | 9.750 (2021)[158] | 157,527 (2021)[159] | 61,894 | |
| 300+ | Billings, MT MSA | 11.570 (2021)[158] | 187,037 (2021)[159] | 61,859 | |
| 300+ | Beaumont-Port Arthur, TX MSA | 24.407 (2021)[158] | 395,419 (2021)[159] | 61,724 | |
| 300+ | Bend, OR MSA | 12.618 (2021)[158] | 204,801 (2021)[159] | 61,611 | |
| 300+ | Bismarck, ND MSA | 8.243 (2021)[158] | 134,417 (2021)[159] | 61,324 | |
| 300+ | Cedar Rapids, IA MSA | 16.853 (2021)[158] | 275,435 (2021)[159] | 61,187 | |
| 166 | Richmond, VA MSA | 80.909 (2021)[158] | 1,324,062 (2021)[159] | 61,107 | |
| 300+ | Morgantown, WV MSA | 8.597 (2021)[158] | 140,745 (2021)[159] | 61,082 | |
| 300+ | Idaho Falls, ID MSA | 9.915 (2021)[158] | 162,786 (2021)[159] | 60,908 | |
| 300+ | St. Cloud, MN MSA | 12.202 (2021)[158] | 200,406 (2021)[159] | 60,886 | |
| 300+ | Amarillo, TX MSA | 16.313 (2021)[158] | 269,703 (2021)[159] | 60,485 | |
| 300+ | Weirton-Steubenville, WV-OH MSA | 6.966 (2021)[158] | 115,585 (2021)[159] | 60,267 | |
| 153 | Oklahoma City, OK MSA | 86.662 (2021)[158] | 1,441,647 (2021)[159] | 60,113 | |
| 300+ | Ames, IA MSA | 7.583 (2021)[158] | 126,195 (2021)[159] | 60,090 | |
| 300+ | Wenatchee, WA MSA | 7.403 (2021)[158] | 123,342 (2021)[159] | 60,020 | |
| 300+ | Watertown-Fort Drum, NY MSA | 6.972 (2021)[158] | 116,295 (2021)[159] | 59,951 | |
| 300+ | Pittsfield, MA MSA | 7.682 (2021)[158] | 128,657 (2021)[159] | 59,709 | |
| 300+ | Longview, TX MSA | 17.134 (2021)[158] | 287,868 (2021)[159] | 59,520 | |
| 300+ | Eau Claire, WI MSA | 10.308 (2021)[158] | 173,317 (2021)[159] | 59,475 | |
| 300+ | Jefferson City, MO MSA | 8.956 (2021)[158] | 150,706 (2021)[159] | 59,427 | |
| 300+ | Mankato, MN MSA | 6.157 (2021)[158] | 173,317 (2021)[159] | 59,424 | |
| 103 | Las Vegas-Henderson-Paradise, NV MSA | 136.198 (2021)[158] | 2,292,476 (2021)[159] | 59,411 | |
| 126 | Virginia Beach-Norfolk-Newport News, VA-NC MSA | 107.067 (2021)[158] | 1,803,328 (2021)[159] | 59,372 | |
| 300+ | Champaign-Urbana, IL MSA | 13.219 (2021)[158] | 222,696 (2021)[159] | 59,359 | |
| 144 | Milwaukee-Waukesha, WI MSA | 92.834 (2021)[158] | 1,566,487 (2021)[159] | 59,263 | |
| 300+ | Peoria, IL MSA | 23.599 (2021)[158] | 398,224 (2021)[159] | 59,261 | |
| 300+ | Bloomsburg-Berwick, PA MSA | 4.916 (2021)[158] | 82,959 (2021)[159] | 59,258 | |
| 67 | Tampa-St. Petersburg-Clearwater, FL MSA | 190.708 (2021)[158] | 3,219,514 (2021)[159] | 59,235 | |
| 300+ | Fayetteville-Springdale-Rogers, AR MSA | 33.102 (2021)[158] | 560,709 (2021)[159] | 59,036 | |
| 300+ | Corpus Christi, TX MSA | 24.937 (2021)[158] | 422,778 (2021)[159] | 58,984 | |
| 216 | Tulsa, OK MSA | 60.392 (2021)[158] | 1,023,988 (2021)[159] | 58,977 | |
| 300+ | Rochester, MN MSA | 13.390 (2021)[158] | 227,151 (2021)[159] | 58,948 | |
| 108 | Cleveland-Elyria, OH MSA | 122.275 (2021)[158] | 2,075,662 (2021)[159] | 58,909 | |
| 240 | Allentown-Bethlehem-Easton, PA-NJ MSA | 50.960 (2021)[158] | 865,310 (2021)[159] | 58,892 | |
| 300+ | Glens Falls, NY MSA | 7.446 (2021)[158] | 126,574 (2021)[159] | 58,827 | |
| 300+ | Salisbury, MD-DE MSA | 25.194 (2021)[158] | 429,223 (2021)[159] | 58,697 | |
| 300+ | Harrisonburg, VA MSA | 7.972 (2021)[158] | 135,824 (2021)[159] | 58,694 | |
| 287 | Akron, OH MSA | 41.058 (2021)[158] | 700,015 (2021)[159] | 58,653 | |
| 300+ | Mount Vernon-Anacortes, WA MSA | 7.659 (2021)[158] | 130,696 (2021)[159] | 58,602 | |
| 236 | Knoxville, TN MSA | 52.343 (2021)[158] | 893,412 (2021)[159] | 58,588 | |
| 300+ | College Station-Bryan, TX MSA | 15.896 (2021)[158] | 272,041 (2021)[159] | 58,432 | |
| 300+ | Manhattan, KS MSA | 7.818 (2021)[158] | 133,932 (2021)[159] | 58,373 | |
| 300+ | Flagstaff, AZ MSA | 8.444 (2021)[158] | 145,052 (2021)[159] | 58,214 | |
| 300+ | Walla Walla, WA MSA | 3.642 (2021)[158] | 62,682 (2021)[159] | 58,103 | |
| 300+ | Winchester, VA-WV MSA | 8.419 (2021)[158] | 145,155 (2021)[159] | 58,000 | |
| 138 | Providence-Warwick, RI-MA MSA | 96.913 (2021)[158] | 1,675,774 (2021)[159] | 57,832 | |
| 300+ | Kennewick-Richland, WA MSA | 17.826 (2021)[158] | 308,293 (2021)[159] | 57,822 | |
| 300+ | Williamsport, PA MSA | 6.562 (2021)[158] | 113,605 (2021)[159] | 57,762 | |
| 300+ | Midland, MI MSA | 4.807 (2021)[158] | 83,457 (2021)[159] | 57,599 | |
| 256 | Columbia, SC MSA | 48.214 (2021)[158] | 838,250 (2021)[159] | 57,517 | |
| 300+ | Bellingham, WA MSA | 13.143 (2021)[158] | 228,831 (2021)[159] | 57,435 | |
| 300+ | Panama City, FL MSA | 10.269 (2021)[158] | 300+,168 (2021)[159] | 57,315 | |
| 275 | Colorado Springs, CO MSA | 43.522 (2021)[158] | 762,793 (2021)[159] | 57,056 | |
| 238 | Bakersfield, CA MSA | 52.293 (2021)[158] | 917,673 (2021)[159] | 56,984 | |
| 281 | Little Rock-North Little Rock-Conway, AR MSA | 42.669 (2021)[158] | 750,936 (2021)[159] | 56,821 | |
| 300+ | Missoula, MT MSA | 6.780 (2021)[158] | 119,533 (2021)[159] | 56,721 | |
| 300+ | Columbia, MO MSA | 12.077 (2021)[158] | 213,123 (2021)[159] | 56,667 | |
| 300+ | Winston-Salem, NC MSA | 38.504 (2021)[158] | 681,438 (2021)[159] | 56,504 | |
| 300+ | Battle Creek, MI MSA | 7.528 (2021)[158] | 133,819 (2021)[159] | 56,255 | |
| 229 | Worcester, MA-CT MSA | 54.941 (2021)[158] | 978,447 (2021)[159] | 56,151 | |
| 300+ | San Luis Obispo-Paso Robles, CA MSA | 15.899 (2021)[158] | 283,159 (2021)[159] | 56,149 | |
| 300+ | Fort Collins, CO MSA | 20.344 (2021)[158] | 362,533 (2021)[159] | 56,116 | |
| 300+ | Lafayette-West Lafayette, IN MSA | 12.537 (2021)[158] | 224,709 (2021)[159] | 55,792 | |
| 300+ | Mobile, AL MSA | 23.876 (2021)[158] | 428,220 (2021)[159] | 55,756 | |
| 300+ | Fond du Lac, WI MSA | 5.817 (2021)[158] | 104,362 (2021)[159] | 55,739 | |
| 300+ | St. Joseph, MO-KS MSA | 6.700 (2021)[158] | 120,424 (2021)[159] | 55,637 | |
| 237 | Greenville-Anderson, SC MSA | 52.328 (2021)[158] | 940,774 (2021)[159] | 55,622 | |
| 98 | San Antonio-New Braunfels, TX MSA | 144.384 (2021)[158] | 2,601,788 (2021)[159] | 55,494 | |
| 300+ | Altoona, PA MSA | 6.736 (2021)[158] | 121,767 (2021)[159] | 55,319 | |
| 300+ | Florence, SC MSA | 11.018 (2021)[158] | 199,259 (2021)[159] | 55,295 | |
| 300+ | Niles, MI MSA | 8.455 (2021)[158] | 153,101 (2021)[159] | 55,225 | |
| 300+ | El Centro, CA MSA | 9.912 (2021)[158] | 300+,851 (2021)[159] | 55,112 | |
| 274 | Boise, ID MSA | 43.601 (2021)[158] | 795,268 (2021)[159] | 54,826 | |
| 300+ | Tyler, TX MSA | 13.002 (2021)[158] | 237,186 (2021)[159] | 54,818 | |
| 300+ | Duluth, MN-WI MSA | 15.905 (2021)[158] | 290,780 (2021)[159] | 54,698 | |
| 300+ | Corvallis, OR MSA | 5.242 (2021)[158] | 96,017 (2021)[159] | 54,594 | |
| 300+ | Olympia-Lacey-Tumwater, WA MSA | 16.245 (2021)[158] | 297,977 (2021)[159] | 54,518 | |
| 300+ | La Crosse-Onalaska, WI-MN MSA | 7.568 (2021)[158] | 139,211 (2021)[159] | 54,364 | |
| 300+ | Lansing-East Lansing, MI MSA | 29.363 (2021)[158] | 540,281 (2021)[159] | 54,348 | |
| 300+ | Rocky Mount, NC MSA | 7.799 (2021)[158] | 143,535 (2021)[159] | 54,335 | |
| 300+ | Longview, WA MSA | 6.047 (2021)[158] | 111,524 (2021)[159] | 54,222 | |
| 300+ | Spokane-Spokane Valley, WA MSA | 32.178 (2021)[158] | 593,466 (2021)[159] | 54,220 | |
| 300+ | Dover, DE MSA | 9.984 (2021)[158] | 184,149 (2021)[159] | 54,217 | |
| 300+ | Jackson, TN MSA | 9.779 (2021)[158] | 180,799 (2021)[159] | 54,088 | |
| 300+ | Waco, TX MSA | 15.125 (2021)[158] | 280,428 (2021)[159] | 53,935 | |
| 250 | Albuquerque, NM MSA | 49.480 (2021)[158] | 918,259 (2021)[159] | 53,885 | |
| 300+ | Gainesville, FL MSA | 18.353 (2021)[158] | 341,756 (2021)[159] | 53,702 | |
| 300+ | Kokomo, IN MSA | 4.488 (2021)[158] | 83,687 (2021)[159] | 53,628 | |
| 300+ | Hinesville, GA MSA | 4.427 (2021)[158] | 82,863 (2021)[159] | 53,426 | |
| 300+ | Spartanburg, SC MSA | 17.914 (2021)[158] | 335,864 (2021)[159] | 53,337 | |
| 300+ | Rapid City, SD MSA | 7.565 (2021)[158] | 141,979 (2021)[159] | 53,283 | |
| 300+ | Charleston, WV MSA | 13.553 (2021)[158] | 255,020 (2021)[159] | 53,145 | |
| 300+ | Athens-Clarke County, GA MSA | 11.562 (2021)[158] | 217,759 (2021)[159] | 53,095 | |
| 300+ | Owensboro, KY MSA | 6.434 (2021)[158] | 121,227 (2021)[159] | 53,074 | |
| 300+ | Scranton–Wilkes-Barre, PA MSA | 30.040 (2021)[158] | 567,750 (2021)[159] | 52,911 | |
| 300+ | Provo-Orem, UT MSA | 36.866 (2021)[158] | 697,141 (2021)[159] | 52,882 | |
| 300+ | New Bern, NC MSA | 6.436 (2021)[158] | 122,273 (2021)[159] | 52,636 | |
| 300+ | South Bend-Mishawaka, IN-MI MSA | 17.031 (2021)[158] | 323,695 (2021)[159] | 52,614 | |
| 300+ | Montgomery, AL MSA | 20.250 (2021)[158] | 385,798 (2021)[159] | 52,489 | |
| 300+ | Jackson, MS MSA | 30.785 (2021)[158] | 587,202 (2021)[159] | 52,427 | |
| 300+ | Bremerton-Silverdale-Port Orchard, WA MSA | 14.373 (2021)[158] | 274,314 (2021)[159] | 52,396 | |
| 300+ | Tallahassee, FL MSA | 20.148 (2021)[158] | 385,776 (2021)[159] | 52,227 | |
| 268 | North Port-Sarasota-Bradenton, FL MSA | 44.746 (2021)[158] | 859,760 (2021)[159] | 52,045 | |
| 300+ | Janesville-Beloit, WI MSA | 8.530 (2021)[158] | 164,381 (2021)[159] | 51,892 | |
| 300+ | Victoria, TX MSA | 5.082 (2021)[158] | 98,127 (2021)[159] | 51,790 | |
| 300+ | Redding, CA MSA | 9.419 (2021)[158] | 182,139 (2021)[159] | 51,713 | |
| 300+ | Asheville, NC MSA | 24.350 (2021)[158] | 472,341 (2021)[159] | 51,552 | |
| 300+ | Augusta-Richmond County, GA-SC MSA | 31.718 (2021)[158] | 615,933 (2021)[159] | 51,496 | |
| 300+ | Reading, PA MSA | 22.055 (2021)[158] | 429,342 (2021)[159] | 51,369 | |
| 300+ | Bloomington, IN MSA | 8.272 (2021)[158] | 161,321 (2021)[159] | 51,277 | |
| 300+ | York-Hanover, PA MSA | 23.406 (2021)[158] | 458,696 (2021)[159] | 51,027 | |
| 300+ | Elmira, NY MSA | 4.230 (2021)[158] | 83,045 (2021)[159] | 50,936 | |
| 300+ | Laredo, TX MSA | 13.581 (2021)[158] | 267,945 (2021)[159] | 50,686 | |
| 300+ | Gulfport-Biloxi, MS MSA | 21.177 (2021)[158] | 418,082 (2021)[159] | 50,653 | |
| 300+ | Utica-Rome, NY MSA | 14.678 (2021)[158] | 290,211 (2021)[159] | 50,577 | |
| 300+ | Rockford, IL MSA | 17.005 (2021)[158] | 336,278 (2021)[159] | 50,568 | |
| 285 | Dayton, OH MSA | 41.111 (2021)[158] | 813,516 (2021)[159] | 50,535 | |
| 300+ | Macon-Bibb County, GA MSA | 11.818 (2021)[158] | 233,883 (2021)[159] | 50,530 | |
| 296 | Cape Coral-Fort Myers, FL MSA | 39.813 (2021)[158] | 787,976 (2021)[159] | 50,526 | |
| 300+ | Lubbock, TX MSA | 16.402 (2021)[158] | 325,245 (2021)[159] | 50,430 | |
| 300+ | Dothan, AL MSA | 7.636 (2021)[158] | 151,618 (2021)[159] | 50,363 | |
| 300+ | Canton-Massillon, OH MSA | 20.167 (2021)[158] | 400,525 (2021)[159] | 50,351 | |
| 300+ | Twin Falls, Idaho | 5.878 (2021)[158] | 116,905 (2021)[159] | 50,280 | |
| 300+ | Fort Wayne, IN MSA | 21.268 (2021)[158] | 423,038 (2021)[159] | 50,274 | |
| 300+ | Columbus, GA-AL MSA | 16.456 (2021)[158] | 327,536 (2021)[159] | 50,242 | |
| 300+ | Binghamton, NY MSA | 12.314 (2021)[158] | 245,220 (2021)[159] | 50,216 | |
| 300+ | East Stroudsburg, PA MSA | 8.493 (2021)[158] | 169,273 (2021)[159] | 50,173 | |
| 300+ | Kalamazoo-Portage, MI MSA | 13.094 (2021)[158] | 261,108 (2021)[159] | 50,148 | |
| 300+ | Blacksburg-Christiansburg, VA MSA | 8.271 (2021)[158] | 165,293 (2021)[159] | 50,038 | |
| 300+ | Chattanooga, TN-GA MSA | 28.336 (2021)[158] | 567,641 (2021)[159] | 49,919 | |
| 300+ | Abilene, TX MSA | 8.848 (2021)[158] | 177,314 (2021)[159] | 49,900 | |
| 300+ | Danville, IL MSA | 3.645 (2021)[158] | 73,095 (2021)[159] | 49,867 | |
| 300+ | Springfield, MO MSA | 23.930 (2021)[158] | 481,483 (2021)[159] | 49,701 | |
| 300+ | Ogden-Clearfield, UT MSA | 35.071 (2021)[158] | 706,696 (2021)[159] | 49,627 | |
| 300+ | Palm Bay-Melbourne-Titusville, FL MSA | 30.589 (2021)[158] | 616,628 (2021)[159] | 49,607 | |
| 300+ | Cape Girardeau, MO-IL MSA | 4.838 (2021)[158] | 97,699 (2021)[159] | 49,519 | |
| 300+ | Saginaw, MI MSA | 9.363 (2021)[158] | 189,591 (2021)[159] | 49,385 | |
| 244 | Fresno, CA MSA | 49.987 (2021)[158] | 1,013,581 (2021)[159] | 49,317 | |
| 300+ | Goldsboro, NC MSA | 5.761 (2021)[158] | 116,835 (2021)[159] | 49,309 | |
| 300+ | Sebastian-Vero Beach, FL MSA | 8.063 (2021)[158] | 163,662 (2021)[159] | 49,266 | |
| 300+ | Salem, OR MSA | 21.487 (2021)[158] | 436,283 (2021)[159] | 49,250 | |
| 300+ | Eugene-Springfield, OR MSA | 18.848 (2021)[158] | 383,189 (2021)[159] | 49,187 | |
| 300+ | Great Falls, MT MSA | 4.150 (2021)[158] | 84,511 (2021)[159] | 49,106 | |
| 300+ | Lancaster, PA MSA | 27.183 (2021)[158] | 553,652 (2021)[159] | 49,098 | |
| 300+ | Medford, OR MSA | 10.949 (2021)[158] | 223,734 (2021)[159] | 48,938 | |
| 300+ | Kingsport-Bristol, TN-VA MSA | 15.104 (2021)[158] | 308,661 (2021)[159] | 48,934 | |
| 300+ | Logan, UT-ID MSA | 7.425 (2021)[158] | 152,083 (2021)[159] | 48,822 | |
| 300+ | Lebanon, PA MSA | 6.911 (2021)[158] | 143,493 (2021)[159] | 48,163 | |
| 300+ | Tuscaloosa, AL MSA | 12.913 (2021)[158] | 268,191 (2021)[159] | 48,149 | |
| 300+ | Jonesboro, AR MSA | 6.494 (2021)[158] | 134,878 (2021)[159] | 48,147 | |
| 300+ | Grand Forks, ND-MN MSA | 4.981 (2021)[158] | 103,462 (2021)[159] | 48,143 | |
| 300+ | Greensboro-High Point, NC MSA | 37.466 (2021)[158] | 778,848 (2021)[159] | 48,104 | |
| 300+ | Chico, CA MSA | 10.006 (2021)[158] | 208,309 (2021)[159] | 48,034 | |
| 300+ | Jacksonville, NC MSA | 9.900 (2021)[158] | 206,160 (2021)[159] | 48,021 | |
| 300+ | Vineland-Bridgeton, NJ MSA | 7.376 (2021)[158] | 153,627 (2021)[159] | 48,012 | |
| 300+ | Modesto, CA MSA | 26.519 (2021)[158] | 552,999 (2021)[159] | 47,955 | |
| 300+ | Jackson, MI MSA | 7.651 (2021)[158] | 160,050 (2021)[159] | 47,804 | |
| 243 | Tucson, AZ MSA | 50.231 (2021)[158] | 1,052,030 (2021)[159] | 47,747 | |
| 300+ | Roanoke, VA MSA | 15.012 (2021)[158] | 314,496 (2021)[159] | 47,734 | |
| 300+ | Wichita Falls, TX MSA | 7.096 (2021)[158] | 149,013 (2021)[159] | 47,620 | |
| 300+ | Grand Junction, CO MSA | 7.444 (2021)[158] | 157,335 (2021)[159] | 47,313 | |
| 300+ | Hanford-Corcoran, CA MSA | 7.258 (2021)[158] | 153,443 (2021)[159] | 47,301 | |
| 300+ | Lafayette, LA MSA | 22.650 (2021)[158] | 479,212 (2021)[159] | 47,265 | |
| 300+ | Enid, OK MSA | 2.926 (2021)[158] | 61,926 (2021)[159] | 47,250 | |
| 300+ | Kingston, NY MSA | 8.622 (2021)[158] | 182,951 (2021)[159] | 47,127 | |
| 300+ | Farmington, NM MSA | 5.698 (2021)[158] | 120,993 (2021)[159] | 47,094 | |
| 300+ | Pensacola-Ferry Pass-Brent, FL MSA | 24.309 (2021)[158] | 516,388 (2021)[159] | 47,075 | |
| 300+ | Dalton, GA MSA | 6.689 (2021)[158] | 142,799 (2021)[159] | 46,842 | |
| 300+ | Lawrence, KS MSA | 5.586 (2021)[158] | 119,363 (2021)[159] | 46,798 | |
| 300+ | Topeka, KS MSA | 10.884 (2021)[158] | 232,670 (2021)[159] | 46,779 | |
| 300+ | Carbondale-Marion, IL MSA | 6.206 (2021)[158] | 132,907 (2021)[159] | 46,694 | |
| 300+ | Alexandria, LA MSA | 7.037 (2021)[158] | 150,890 (2021)[159] | 46,637 | |
| 300+ | Staunton, VA MSA | 5.865 (2021)[158] | 125,774 (2021)[159] | 46,631 | |
| 300+ | Stockton, CA MSA | 36.790 (2021)[158] | 789,410 (2021)[159] | 46,604 | |
| 300+ | Pine Bluff, AR MSA | 3.996 (2021)[158] | 86,412 (2021)[159] | 46,244 | |
| 300+ | Fayetteville, NC MSA | 24.254 (2021)[158] | 524,588 (2021)[159] | 46,234 | |
| 300+ | Racine, WI MSA | 9.100 (2021)[158] | 196,896 (2021)[159] | 46,217 | |
| 300+ | Huntington-Ashland, WV-KY-OH MSA | 16.470 (2021)[158] | 356,581 (2021)[159] | 46,189 | |
| 300+ | Warner Robins, GA MSA | 8.993 (2021)[158] | 195,246 (2021)[159] | 46,060 | |
| 300+ | Terre Haute, IN MSA | 8.502 (2021)[158] | 184,910 (2021)[159] | 45,979 | |
| 300+ | Rome, GA MSA | 4.539 (2021)[158] | 98,771 (2021)[159] | 45,955 | |
| 300+ | Bowling Green, KY MSA | 8.368 (2021)[158] | 182,594 (2021)[159] | 45,828 | |
| 58 | Riverside-San Bernardino-Ontario, CA MSA | 213.183 (2021)[158] | 4,653,105 (2021)[159] | 45,815 | |
| 300+ | Hickory-Lenoir-Morganton, NC MSA | 16.787 (2021)[158] | 366,441 (2021)[159] | 45,811 | |
| 300+ | Joplin, MO MSA | 8.319 (2021)[158] | 182,541 (2021)[159] | 45,573 | |
| 300+ | Houma-Thibodaux, LA MSA | 9.350 (2021)[158] | 206,212 (2021)[159] | 45,342 | |
| 300+ | Killeen-Temple, TX MSA | 21.967 (2021)[158] | 486,101 (2021)[159] | 45,190 | |
| 300+ | Atlantic City-Hammonton, NJ MSA | 12.407 (2021)[158] | 274,966 (2021)[159] | 45,122 | |
| 300+ | Coeur d'Alene, ID MSA | 8.112 (2021)[158] | 300+,789 (2021)[159] | 45,120 | |
| 300+ | Parkersburg-Vienna, WV MSA | 4.000 (2021)[158] | 88,687 (2021)[159] | 45,102 | |
| 300+ | Brunswick, GA MSA | 5.136 (2021)[158] | 113,963 (2021)[159] | 45,067 | |
| 300+ | Fort Smith, AR-OK MSA | 10.920 (2021)[158] | 245,459 (2021)[159] | 44,488 | |
| 300+ | Yuba City, CA MSA | 8.104 (2021)[158] | 182,484 (2021)[159] | 44,409 | |
| 300+ | Clarksville, TN-KY MSA | 14.546 (2021)[158] | 328,304 (2021)[159] | 44,306 | |
| 300+ | Lawton, OK MSA | 5.636 (2021)[158] | 127,543 (2021)[159] | 44,189 | |
| 300+ | Anniston-Oxford, AL MSA | 5.108 (2021)[158] | 115,972 (2021)[159] | 44,045 | |
| 300+ | Lakeland-Winter Haven, FL MSA | 33.144 (2021)[158] | 753,520 (2021)[159] | 43,986 | |
| 300+ | Pueblo, CO MSA | 7.436 (2021)[158] | 169,622 (2021)[159] | 43,839 | |
| 300+ | Chambersburg-Waynesboro, PA MSA | 6.846 (2021)[158] | 156,289 (2021)[159] | 43,803 | |
| 300+ | Valdosta, GA MSA | 6.529 (2021)[158] | 149,152 (2021)[159] | 43,774 | |
| 300+ | St. George, UT MSA | 8.338 (2021)[158] | 191,226 (2021)[159] | 43,603 | |
| 300+ | Lynchburg, VA MSA | 11.430 (2021)[158] | 262,258 (2021)[159] | 43,583 | |
| 300+ | Springfield, MA MSA | 30.271 (2021)[158] | 695,305 (2021)[159] | 43,536 | |
| 300+ | Elizabethtown-Fort Knox, KY MSA | 6.819 (2021)[158] | 156,766 (2021)[159] | 43,498 | |
| 300+ | Yuma, AZ MSA | 8.977 (2021)[158] | 206,990 (2021)[159] | 43,369 | |
| 300+ | Madera, CA MSA | 6.907 (2021)[158] | 159,410 (2021)[159] | 43,329 | |
| 300+ | Monroe, MI MSA | 6.716 (2021)[158] | 155,274 (2021)[159] | 43,253 | |
| 300+ | Morristown, TN MSA | 6.218 (2021)[158] | 143,855 (2021)[159] | 43,224 | |
| 300+ | Albany-Lebanon, OR MSA | 5.608 (2021)[158] | 129,839 (2021)[159] | 43,192 | |
| 300+ | Visalia, CA MSA | 20.580 (2021)[158] | 477,054 (2021)[159] | 43,140 | |
| 300+ | El Paso, TX MSA | 37.507 (2021)[158] | 871,234 (2021)[159] | 43,050 | |
| 300+ | Sierra Vista-Douglas, AZ MSA | 5.399 (2021)[158] | 126,050 (2021)[159] | 42,832 | |
| 300+ | Burlington, NC MSA | 7.440 (2021)[158] | 173,877 (2021)[159] | 42,789 | |
| 300+ | Hagerstown-Martinsburg, MD-WV MSA | 12.755 (2021)[158] | 298,227 (2021)[159] | 42,769 | |
| 300+ | Myrtle Beach-Conway-North Myrtle Beach, SC-NC MSA | 21.787 (2021)[158] | 509,794 (2021)[159] | 42,737 | |
| 300+ | Flint, MI MSA | 17.234 (2021)[158] | 404,208 (2021)[159] | 42,636 | |
| 300+ | Cumberland, MD-WV MSA | 4.025 (2021)[158] | 94,586 (2021)[159] | 42,554 | |
| 300+ | Monroe, LA MSA | 8.699 (2021)[158] | 204,884 (2021)[159] | 42,458 | |
| 300+ | Cleveland, TN MSA | 5.423 (2021)[158] | 127,938 (2021)[159] | 42,388 | |
| 300+ | Sherman-Denison, TX MSA | 5.852 (2021)[158] | 139,336 (2021)[159] | 41,999 | |
| 300+ | Mansfield, OH MSA | 5.251 (2021)[158] | 125,195 (2021)[159] | 41,943 | |
| 300+ | Lewiston-Auburn, ME MSA | 4.616 (2021)[158] | 111,034 (2021)[159] | 41,573 | |
| 300+ | Grants Pass, OR MSA | 3.666 (2021)[158] | 88,346 (2021)[159] | 41,496 | |
| 300+ | Hattiesburg, MS MSA | 7.181 (2021)[158] | 173,078 (2021)[159] | 41,490 | |
| 300+ | Hilton Head Island-Bluffton, SC MSA | 9.212 (2021)[158] | 222,072 (2021)[159] | 41,482 | |
| 300+ | Gettysburg, PA MSA | 4.310 (2021)[158] | 104,127 (2021)[159] | 41,392 | |
| 300+ | Auburn-Opelika, AL MSA | 7.335 (2021)[158] | 177,218 (2021)[159] | 41,390 | |
| 300+ | Texarkana, TX-AR MSA | 6.086 (2021)[158] | 147,174 (2021)[159] | 41,352 | |
| 300+ | Daphne-Fairhope-Foley, AL MSA | 9.891 (2021)[158] | 239,294 (2021)[159] | 41,334 | |
| 300+ | Bangor, ME MSA | 6.309 (2021)[158] | 152,765 (2021)[159] | 41,299 | |
| 300+ | Lewiston, ID-WA MSA | 2.676 (2021)[158] | 64,851 (2021)[159] | 41,264 | |
| 300+ | Port St. Lucie, FL MSA | 20.762 (2021)[158] | 503,521 (2021)[159] | 41,234 | |
| 300+ | Sumter, SC MSA | 5.539 (2021)[158] | 135,782 (2021)[159] | 40,793 | |
| 300+ | The Villages, FL MSA | 5.507 (2021)[158] | 135,638 (2021)[159] | 40,601 | |
| 300+ | Bay City, MI MSA | 4.158 (2021)[158] | 102,985 (2021)[159] | 40,375 | |
| 300+ | Michigan City-La Porte, IN MSA | 4.521 (2021)[158] | 112,390 (2021)[159] | 40,226 | |
| 300+ | Beckley, WV MSA | 4.563 (2021)[158] | 113,698 (2021)[159] | 40,133 | |
| 300+ | Muncie, IN MSA | 4.486 (2021)[158] | 111,871 (2021)[159] | 40,100 | |
| 300+ | Florence-Muscle Shoals, AL MSA | 5.989 (2021)[158] | 151,517 (2021)[159] | 39,527 | |
| 300+ | Johnstown, PA MSA | 5.197 (2021)[158] | 132,167 (2021)[159] | 39,321 | |
| 300+ | Santa Fe, NM MSA | 6.082 (2021)[158] | 155,201 (2021)[159] | 39,188 | |
| 300+ | Yakima, WA MSA | 9.978 (2021)[158] | 256,035 (2021)[159] | 38,971 | |
| 300+ | Hot Springs, AR MSA | 3.907 (2021)[158] | 100,330 (2021)[159] | 38,941 | |
| 300+ | Pocatello, ID MSA | 3.732 (2021)[158] | 96,213 (2021)[159] | 38,789 | |
| 300+ | Erie, PA MSA | 10.415 (2021)[158] | 269,011 (2021)[159] | 38,716 | |
| 300+ | Muskegon, MI MSA | 6.795 (2021)[158] | 176,511 (2021)[159] | 38,496 | |
| 300+ | Springfield, OH MSA | 5.162 (2021)[158] | 135,633 (2021)[159] | 38,059 | |
| 300+ | Las Cruces, NM MSA | 8.339 (2021)[158] | 221,508 (2021)[159] | 37,646 | |
| 300+ | Decatur, AL MSA | 5.854 (2021)[158] | 156,758 (2021)[159] | 37,344 | |
| 300+ | Deltona-Daytona Beach-Ormond Beach, FL MSA | 25.516 (2021)[158] | 685,344 (2021)[159] | 37,231 | |
| 300+ | Hammond, LA MSA | 4.897 (2021)[158] | 135,217 (2021)[159] | 36,216 | |
| 300+ | Johnson City, TN MSA | 7.508 (2021)[158] | 208,068 (2021)[159] | 36,084 | |
| 300+ | Youngstown-Warren-Boardman, OH-PA MSA | 19.163 (2021)[158] | 538,069 (2021)[159] | 35,614 | |
| 300+ | Punta Gorda, FL MSA | 6.911 (2021)[158] | 194,843 (2021)[159] | 35,470 | |
| 300+ | Albany, GA MSA | 5.210 (2021)[158] | 147,773 (2021)[159] | 35,257 | |
| 300+ | Ocala, FL MSA | 12.907 (2021)[158] | 385,915 (2021)[159] | 33,445 | |
| 300+ | Homosassa Springs, FL MSA | 5.247 (2021)[158] | 158,083 (2021)[159] | 33,191 | |
| 300+ | Lake Havasu City-Kingman, AZ MSA | 7.037 (2021)[158] | 217,692 (2021)[159] | 32,325 | |
| 300+ | Merced, CA MSA | 8.986 (2021)[158] | 286,461 (2021)[159] | 31,369 | |
| 300+ | Brownsville-Harlingen, TX MSA | 13.225 (2021)[158] | 423,029 (2021)[159] | 31,263 | |
| 300+ | Gadsden, AL MSA | 3.175 (2021)[158] | 103,162 (2021)[159] | 30,777 | |
| 300+ | McAllen-Edinburg-Mission, TX MSA | 25.508 (2021)[158] | 880,356 (2021)[159] | 28,975 | |
| 300+ | Sebring-Avon Park, FL MSA | 2.894 (2021)[158] | 103,296 (2021)[159] | 28,017 | |
| 5 | Paris metropolitan area | 1,013.337 (2021)[160][161][162][163] | 14,800,000 (2022)[20] | 79,344.74 | |
| 48 | Madrid Metropolitan Area | 249.571 (2020)[164][165] | 7,005,286 (2020)[166] | 35,625.95 | |
| 52 | Berlin Metropolitan Region | 234.265 (2020)[164][165] | 5,342,958 (2020)[166] | 43,846.50 | |
| 53 | Milan metropolitan area | 233.58 (2020)[164][165] | 4,985,668 (2020)[166] | 46,850.29 | |
| 55 | Munich Metropolitan Region | 228.897 (2020)[164][165] | 2,926,802 (2020)[166] | 78,208.23 | |
| 57 | Greater Dublin Area | 214.277 (2020)[164][165] | 2,110,459 (2020)[166] | 101,532.42 | |
| 59 | Amsterdam metropolitan area | 210.622 (2020)[164][165] | 2,890,428 (2020)[166] | 72,868.10 | |
| 60 | Brussels Capital Region | 210.166 (2021)[164][165] | 2,725,000 (2021)[20] | 77,126.61 | |
| 64 | Ruhr Area | 193.831 (2020)[164][165] | 5,115,617 (2020)[166] | 37,889.86 | |
| 70 | Hamburg Metropolitan Region | 187.092 (2020)[164][165] | 3,328,679 (2020)[166] | 56,205.48 | |
| 73 | Barcelona metropolitan area | 182.524 (2020)[164][165] | 5,105,991 (2020)[166] | 35,746.24 | |
| 77 | Stockholm metropolitan area | 175.899 (2020)[164][165] | 2,377,081 (2020)[166] | 73,998.32 | |
| 78 | Rome metropolitan area | 175.328 (2020)[164][165] | 4,325,591 (2020)[166] | 40,533.19 | |
| 74 | Greater Copenhagen | 179.77 (2021)[164][165] | 1,690,000 (2021)[20] | 106,372.78 | |
| 79 | Frankfurt/Rhine-Main | 172.701 (2020)[164][165] | 2,729,936 (2020)[166] | 63,261.56 | |
| 81 | Stuttgart Metropolitan Region | 169.274 (2020)[164][165] | 2,794,283 (2020)[166] | 60,577.26 | |
| 97 | Vienna | 148.486 (2020)[164][165] | 3,004,660 (2020)[166] | 49,419.90 | |
| 104 | Aix-Marseille-Provence Metropolis | 135.064 (2021)[164][165] | 1,911,657 (2021)[167] | 70,650.75 | |
| 114 | Metropolitan Cork | 117.875 (2020)[164][165] | 211,377 (2020)[168] | 557,676.57 | |
| 112 | Warsaw metropolitan area | 118.625 (2021)[164][165] | 2,350,000 (2021)[20] | 50,476.60 | |
| 115 | Lyon | 116.378 (2021)[164][165] | 1,990,000 (2021)[20] | 58,482.41 | |
| 122 | Cologne Bonn Region | 108.852 (2020)[164][165] | 2,004,984 (2020)[166] | 54,289.71 | |
| 125 | Greater Helsinki | 107.595 (2020)[164][165] | 1,526,778 (2020)[166] | 70,475.21 | |
| 119 | Prague metropolitan area | 109.163 (2021)[164][165] | 1,460,000 (2021)[20] | 74,767.12 | |
| 132 | Düsseldorf | 101.656 (2020)[164][165] | 1,557,269 (2020)[166] | 65,280.95 | |
| 134 | Rotterdam | 98.915 (2020)[164][165] | 1,876,165 (2020)[166] | 52,719.24 | |
| 131 | European Metropolis of Lille | 101.83 (2021)[164][165] | 1,300,000 (2021)[20] | 78,330.77 | |
| 148 | Gothenburg | 90.348 (2020)[164][165] | 1,051,345 (2020)[166] | 85,937.54 | |
| 150 | Utrecht | 87.949 (2020)[164][165] | 1,356,430 (2020)[169] | 64,839.32 | |
| 147 | Lisbon metropolitan area | 90.358 (2021)[164][165] | 2,500,000 (2021)[20] | 36,144.00 | |
| 155 | Athens Metropolitan Area | 85.779 (2020)[164][165] | 3,526,887 (2020)[166] | 24,321.73 | |
| 151 | Budapest metropolitan area | 86.928 (2021)[164][165] | 2,625,000 (2021)[20] | 33,116.19 | |
| 156 | Luxembourg metropolitan area | 85.509 (2021)[164][165] | 193,543 (2021)[170] | 441,813.96 | |
| 171 | Turin metropolitan area | 78.241 (2020)[164][165] | 1,728,714 (2020)[166] | 45,259.08 | |
| 175 | Nuremberg Metropolitan Region | 76.413 (2020)[164][165] | 1,352,002 (2020)[166] | 56,516.19 | |
| 182 | Bordeaux | 73.8 (2021)[164][165] | 1,100,000 (2021)[20] | 67,090.91 | |
| 188 | Bucharest Metropolitan Area | 69.674 (2020)[164][165] | 2,219,341 (2020)[166] | 31,392.20 | |
| 196 | Hannover | 66.71 (2020)[164][165] | 1,316,006 (2020)[166] | 50,691.26 | |
| 199 | Toulouse Métropole | 65.448 (2020)[164][165] | 1,445,789 (2020)[166] | 45,269.40 | |
| 200 | Region Braunschweig | 65.425 (2020)[164][165] | 567,584 (2020)[171][172][173] | 115,278.09 | |
| 204 | Valencia | 64.42 (2020)[164][165] | 1,768,205 (2020)[166] | 36,432.43 | |
| 206 | Malmö | 63.14 (2019)[164][165] | 737,511 (2019)[174] | 85,612.28 | |
| 205 | Naples metropolitan area | 64.306 (2020)[164][165] | 3,349,233 (2020)[166] | 19,201.41 | |
| 197 | Antwerp metropolitan area | 66.113 (2021)[164][165] | 1,230,000 (2021)[20] | 53,747.97 | |
| 201 | Nantes | 65.403 (2021)[164][165] | 859,972 (2021)[175] | 76,048.99 | |
| 212 | Rhine-Neckar | 61.222 (2020)[164][165] | 547,207 (2020)[176] | 111,877.22 | |
| 217 | The Hague | 60.08 (2020)[164][165] | 1,116,798 (2020)[166] | 53,796.66 | |
| 225 | Bremen | 56.539 (2020)[164][165] | 1,274,429 (2020)[166] | 44,364.97 | |
| 230 | Aarhus | 54.877 (2021)[164][165] | 352,751 (2021)[177] | 155,577.16 | |
| 241 | Dresden | 50.828 (2020)[164][165] | 1,343,747 (2020)[166] | 37,827.06 | |
| 234 | Grenoble metropolitan area | 53.576 (2021)[164][165] | 760,823 (2021)[178] | 70,423.74 | |
| 257 | Eindhoven | 48.201 (2020)[164][165] | 300,751 (2020)[179] | 160,265.47 | |
| 247 | Métropole Rouen Normandie | 49.673 (2021)[164][165] | 499,830 (2021)[167] | 99,373.79 | |
| 253 | Strasbourg | 49.082 (2021)[164][165] | 1,150,899 (2021)[180] | 42,644.92 | |
| 255 | Rennes Métropole | 48.254 (2021)[164][165] | 624,744 (2021)[181] | 77,231.63 | |
| 261 | Brescia metropolitan area | 46.602 (2020)[164][165] | 1,250,527 (2020)[182] | 37,264.29 | |
| 260 | Métropole Nice Côte d'Azur | 47.308 (2021)[164][165] | 1,101,039 (2021)[32] | 42,968.51 | |
| 264 | Bologna metropolitan area | 45.688 (2020)[164][165] | 1,017,225 (2020) | 44,916.32 | |
| 267 | Katowice metropolitan area | 44.774 (2020)[164][165] | 2,486,510 (2020)[166] | 18,005.16 | |
| 272 | Linz | 43.86 (2020)[164][165] | 199,028 (2020)[20] | 220,371.00 | |
| 266 | Montpellier Méditerranée Métropole | 45.061 (2021)[164][165] | 487,519 (2021)[183] | 92,427.17 | |
| 300+ | Karlsruhe | 43.061 (2020)[164][165] | 504,030 (2020)[184] | 85,431.42 | |
| 283 | Seville | 42.033 (2020)[164][165] | 1,558,006 (2020)[166] | 26,976.79 | |
| 289 | Leipzig | 40.777 (2020)[164][165] | 1,049,342 (2020)[166] | 38,862.45 | |
| 292 | Bergamo metropolitan area | 40.548 (2020)[164][165] | 1,102,286 (2020)[185] | 36,787.19 | |
| 300 | Metropolitan City of Florence | 39.52 (2020)[164][165] | 1,000,111 (2020) | 39,515.61 | |
| 288 | Porto metropolitan area | 40.921 (2021)[164][165] | 1,550,000 (2021)[20] | 26,400.00 | |
| 300+ | Alicante metropolitan area | 38.835 (2020)[164][165] | 1,915,282 (2020)[186] | 20,273.78 | |
| 300+ | Ghent metropolitan area | 39.029 (2021)[164][165] | 561,524 (2021)[187] | 69,507.27 | |
| 300+ | Bilbao metropolitan area | 37.578 (2020)[164][165] | 1,014,366 (2020)[166] | 37,047.77 | |
| 300+ | Ingolstadt | 35.637 (2020)[164][165] | 197,560 (2020)[188] | 180,400.89 | |
| 300+ | Padua–Treviso–Venice metropolitan area | 34.837 (2020)[164][165] | 2,748,420 (2020)[189] | 12,676.37 | |
| 300+ | Verona metropolitan area | 34.152 (2020)[164][165] | 915,975 (2020)[190] | 37,282.68 | |
| 300+ | Heidelberg | 34.038 (2020)[164][165] | 1,544,830 (2020)[191] | 22,034.79 | |
| 300+ | Murcia | 33.923 (2020)[164][165] | 1,528,828 (2020)[192] | 22,186.93 | |
| 121 | Zürich | 1,470,000 (2022)[11] | 74,193.88 |
- Notes
Cities (metropolitan areas) by percentage of national GDP
This table contains only the first metropolitan area from a given country by GDP. Data for metropolitan areas is as in the previous section of this article. Data for countries is from List of countries by GDP (nominal) (IMF). Luxembourg City-Trier is partially in Germany but only Luxembourg's national GDP is considered.
| Metropolitan area | GDP (billion USD) |
Country | National GDP (billion USD) |
% of national GDP |
|---|---|---|---|---|
| City of San Marino | 1.54 | San Marino | 1.70 | 90.872 |
| Luxembourg City-Trier | 69.45 | Luxembourg | 86.90 | 79.925 |
| Montevideo | 49.70 | Uruguay | 64.28 | 77.314 |
| Karachi | 200.00 | Pakistan | 348.3 | 57.43 |
| Seoul | 926.79 | South Korea | 1804.68 | 51.355 |
| Riga | 20.00 | Latvia | 40.27 | 49.670 |
| Taipei | 407.84 | Taiwan | 841.21 | 48.482 |
| Bangkok | 252.13 | Thailand | 522.01 | 48.299 |
| Lima | 176.45 | Peru | 372.69 | 47.344 |
| Manila | 192.60 | Philippines | 411.98 | 46.750 |
| Lisbon | 110.00 | Portugal | 251.92 | 43.666 |
| Athens | 93.70 | Greece | 222.77 | 42.061 |
| Tokyo | 2055.70 | Japan | 4912.15 | 41.849 |
| Dhaka | 253.300 | Bangladesh | 396.54 | 40.349 |
| Tallinn | 15.00 | Estonia | 37.20 | 40.320 |
| Tbilisi | 8.00 | Georgia | 20.89 | 38.298 |
| Yerevan | 5.23 | Armenia | 14.05 | 37.232 |
| Minsk | 22.00 | Belarus | 59.39 | 37.041 |
| Abidjan | 27.00 | Ivory Coast | 73.05 | 36.963 |
| Tel Aviv | 188.42 | Israel | 520.70 | 36.186 |
| Istanbul | 247.31 | Turkey | 692.38 | 35.719 |
| Copenhagen | 134.40 | Denmark | 399.10 | 33.676 |
| Paris | 984.235 | France | 3448.58 | 28.920 |
| Auckland | 79.66 | New Zealand | 257.21 | 30.971 |
| Helsinki | 90.80 | Finland | 297.62 | 30.509 |
| Kabul | 6.00 | Afghanistan | 20.14 | 29.797 |
| Budapest | 58.50 | Hungary | 197.81 | 29.573 |
| London | 978.40 | United Kingdom | 3376.00 | 28.981 |
| Moscow | 504.81 | Russia | 1829.05 | 27.599 |
| Stockholm | 170.00 | Sweden | 621.24 | 27.365 |
| Belgrade | 17.40 | Serbia | 65.04 | 26.754 |
| Sofia | 22.40 | Bulgaria | 89.53 | 25.019 |
| Abu Dhabi | 119.00 | United Arab Emirates | 501.35 | 23.736 |
| Jakarta | 304.20 | Indonesia | 1289.30 | 23.594 |
| Vienna | 112.00 | Austria | 479.82 | 23.342 |
| Dublin | 118.72 | Ireland | 516.15 | 23.001 |
| Sydney | 398.04 | Australia | 1748.33 | 22.767 |
| Bucharest | 63.43 | Romania | 286.51 | 22.139 |
| Amsterdam-Rotterdam | 223.00 | Netherlands | 1013.60 | 22.001 |
| Prague | 64.00 | Czech Republic | 296.24 | 21.604 |
| Toronto | 452.49 | Canada | 2221.22 | 20.371 |
| Madrid | 280.94 | Spain | 1435.56 | 19.570 |
| Mexico City | 250.46 | Mexico | 1322.74 | 18.935 |
| Almaty | 36.00 | Kazakhstan | 193.61 | 18.594 |
| Johannesburg | 76.00 | South Africa | 426.17 | 17.833 |
| Brussels | 99.00 | Belgium | 609.89 | 16.233 |
| Milan | 329.53 | Italy | 2058.33 | 16.010 |
| Ho Chi Minh City | 61.70 | Vietnam | 408.95 | 15.088 |
| Buenos Aires | 84.70 | Argentina | 564.28 | 15.010 |
| Rhine-Ruhr | 636.45 | Germany | 4256.54 | 14.952 |
| Lagos | 74.67 | Nigeria | 510.59 | 14.624 |
| Kaunas | 10.00 | Lithuania | 69.78 | 14.330 |
| Warsaw | 100.00 | Poland | 699.56 | 14.295 |
| São Paulo | 261.64 | Brazil | 1833.27 | 14.272 |
| Kuala Lumpur | 59.83 | Malaysia | 439.37 | 13.617 |
| Dar es Salaam | 10.40 | Tanzania | 77.51 | 13.418 |
| Oslo | 71.68 | Norway | 541.94 | 13.227 |
| Kyiv | 25.70 | Ukraine | 198.32 | 12.959 |
| Nairobi | 14.80 | Kenya | 114.68 | 12.906 |
| Mumbai | 277.98 | India | 3534.74 | 7.864 |
| New York | 1874.40 | United States | 25346.81 | 7.395 |
| Shanghai | 680.00 | China | 19911.59 | 3.415 |
Cities by wealth
| City | Wealth |
|---|---|
| $3 trillion | |
| $2.7 trillion | |
| $2.7 trillion | |
| $2.5 trillion | |
| $2.3 trillion | |
| $2.2 trillion | |
| $2 trillion | |
| $1.4 trillion | |
| $1.3 trillion | |
| $1 trillion | |
| $1 trillion | |
| $0.98 trillion | |
| $0.94 trillion | |
| $0.94 trillion | |
| $0.91 trillion |
See also
References
- "Metropolitan Areas". OECD.Stat. Archived from the original on 12 April 2019.
- Organisation for Economic Co-operation and Development (1 January 1955). "GDP Implicit Price Deflator in United States". FRED, Federal Reserve Bank of St. Louis. Archived from the original on 26 November 2019. Retrieved 25 April 2020.
- "SOWC-2012-DEFINITIONS". UNICEF. Archived from the original on 8 December 2013. Retrieved 29 January 2014.
- "Standard country or area codes for statistical use (M49): Geographic Regions". United Nations. Retrieved 14 July 2022.
- "Global Wealth GDP Nominal Distribution: Who Are The Leaders Of The Global Economy? - Full Size". www.visualcapitalist.com. Retrieved 27 March 2022.
- Government of Canada, Statistics Canada (27 January 2017). "Gross domestic product (GDP) at basic prices, by census metropolitan area (CMA)". www150.statcan.gc.ca. Retrieved 1 January 2022.
- "Population estimates, July 1, by census metropolitan area and census agglomeration, 2016 boundaries". Statistics Canada. 17 April 2019. Retrieved 19 January 2021.
- "Invest Aberdeen Facts & Figures". Aberdeen Invest Live Visit. Archived from the original on 14 October 2013. Retrieved 21 September 2013.
- "Population on 1 January by age groups and sex - functional urban areas". Eurostat. Archived from the original on 20 December 2020. Retrieved 31 December 2020.
- "Which Cities Hold Africa's Wealth". Visual Capitalist. 28 September 2018. Retrieved 28 September 2018.
- "MAJOR AGGLOMERATIONS OF THE WORLD". citypopulation.de/en. Retrieved 27 October 2022.
- "Abu Dhabi Economic Report" (PDF). Archived from the original (PDF) on 4 March 2016. Retrieved 15 May 2015.
- 2018-19 est. / SGSEP AUD according to the SGS Economics and Planning tables 1 & 4 (page 10 & 64), Major Cities: Sydney 461.440B, Melbourne 369.439B Brisbane 177.006B Perth 146.880B Adelaide 85.254B Canberra 40.879B Regional Cities: Gold Coast 35.272B Sunshine Coast 18.269B Newcastle 15.281B Hobart 15.062B Cairns 14.164B Townsville 12.003B Geelong 11.540B Toowoomba 9.414B Mackay 8.649B Wollongong 7.438B Rockhampton 7.065B Gladstone 5.904B Ballarat 5.899B Wagga Wagga 5.809B Launceston 5.239B Bendigo 5.239B Orange 4.238B Converted with current exchange rates, using the 11/12/2020 AUD/USD exchange rate used by the IMF 0.7560996952. ie. Sydney AUD461.440B = USD 348.895B
- "District Domestic Product Per Capita". Archived from the original on 11 March 2023. Retrieved 7 January 2023.
- "Major Agglomerations of the World - Population Statistics and Maps". www.citypopulation.de. Retrieved 30 May 2023.
- "President: Almaty turns into large regional investment attractive centre". inform.kz. 29 October 2019. Archived from the original on 30 October 2019. Retrieved 31 October 2019.
- "Posição ocupada pelos maiores municípios brasileiros em relação ao Produto Interno Bruto, Est. 2013". IBGE. 2013. Archived from the original on 19 February 2016.
- IBGE 2020
- "Ulusal Hesaplar - Kişi başına GSYH ($)" (the year is updated). Turkish Statistical Institute (www.tuik.gov.tr). Retrieved 27 January 2023.
- "Major Agglomerations of the World - Population Statistics and Maps". 4 January 2022. Archived from the original on 4 January 2022. Retrieved 23 May 2023.
- "Quarterly Economic Monitor | Auckland | Gross domestic product". Retrieved 1 July 2022.
- "2016 Census Community Profiles: Ballarat". ABS Census. Australian Bureau of Statistics. Retrieved 15 September 2016.
- Badan Pusat Statistik Jawa Barat (2022). Produk Domestik Regional Bruto Kabupaten/kota di Jawa Barat 2019-2021. Bandung: Badan Pusat Statistik.
- "National Bureau of Statistics of China". data.stats.gov.cn. Archived from the original on 13 September 2017. Retrieved 25 August 2017.
- "National Data". National Bureau of Statistics of China. 1 March 2022. Retrieved 23 March 2022.
- "Eurostat". Archived from the original on 19 June 2018. Retrieved 19 June 2018.
- "Belfast Metropolitan Area Plan" (PDF). Planningni.gov. Archived (PDF) from the original on 7 November 2017. Retrieved 11 April 2018.
- Statistical Yearbook of Serbia Archived 13 October 2017 at the Wayback Machine, pp. 146–47. Statistical Office of Serbia. GDP of Belgrade district in 2014 was 1,514,166 mio RSD x 0.0115 = 17.4 bn USD.
- "2016 Census Community Profiles: Bendigo". ABS Census. Australian Bureau of Statistics. Retrieved 26 October 2017.
- "The top 15 Indian cities by GDP | India's top 15 cities with the highest GDP - Yahoo India Finance". 9 October 2014. Archived from the original on 9 October 2014.
- Records, Official. "Estimates of District Domestic Product Madhya Pradesh" (PDF). Department of Planning, Economics and Statistics, Govt. of M.P. Directorate of Economics and Statistics, Madhya Pradesh. Retrieved 18 October 2021.
- "Database". ec.europa.eu. Eurostat. Retrieved 20 June 2020. click General and regional statistics / Regional statistics by typology / Metropolitan regions / Demography statistics by metropolitan regions / Population on 1 January by broad age group, sex and metropolitan regions (met_pjanaggr3)
- "Economía" (PDF) (in Spanish). Archived from the original (PDF) on 25 March 2009. Retrieved 22 January 2010.
{{cite journal}}: Cite journal requires|journal=(help) - "Regional Population: Population estimates by Significant Urban Area, 2009 to 2019". Australian Bureau of Statistics. Retrieved 3 November 2020. Estimated resident population, 30 June 2019.
- GDP (in Portuguese). Campo Grande, Brazil: IBGE. 2013. Archived from the original on 12 May 2016. Retrieved 7 January 2016.
- per capita income (PDF) (in Portuguese). Campos, Brazil: IBGE. 2005. ISBN 85-240-3919-1. Archived from the original (PDF) on 2 October 2008. Retrieved 18 July 2007.
- IBGE 2020
- "Regional population, 2019-20". Australian Bureau of Statistics. Retrieved 11 April 2021.Regional population, 2019-20.
- "The Online Journal of McKinsey & Company". McKinsey Quarterly. Archived from the original on 14 July 2012. Retrieved 12 March 2013.
- Haritas, Bhragu. "Richest Cities Of India". BW Businessworld. Archived from the original on 2 March 2020. Retrieved 19 April 2020.
- "In 2021, the GDP of each city and state in Hunan will exceed US$20,000 per capita in Changsha". 15 June 2022.
- OECD Urban Policy Reviews: China 2015, OECD READ edition. 18 April 2015. p. 37. doi:10.1787/9789264230040-en. ISBN 9789264230033. ISSN 2306-9341. Archived from the original on 27 March 2017. Retrieved 9 December 2017.
{{cite book}}:|website=ignored (help)Linked from the OECD here Archived 2017-12-09 at the Wayback Machine - "Major Agglomerations of the World - Population Statistics and Maps". 4 January 2022. Archived from the original on 4 January 2022. Retrieved 18 May 2023.
- "Economics Landscape of Chittagong". chittagongchamber.com. Chittagong Chamber. Retrieved 16 October 2019.
- "Major Agglomerations of the World - Population Statistics and Maps". Archived from the original on 4 January 2022. Retrieved 17 May 2023.
- Lundy, Kate (2010). "Chapter 3: The economic environment of the Indian Ocean Territories". Inquiry into the changing economic environment in the Indian Ocean Territories (PDF). Parliament House, Canberra ACT: Joint Standing Committee on the National Capital and External Territories. p. 23. ISBN 978-0-642-79276-1.
- Australian Bureau of Statistics (27 June 2017). "Cocos (Keeling) Islands". 2016 Census QuickStats. Retrieved 10 October 2019.
- "Regional economic activity by gross value added (balanced), UK: 1998 to 2017". Office for National Statistics UK.
- "Yearly Average Currency Exchange Rates | Internal Revenue Service". irs.gov.
- "Population on 1 January by age groups and sex – functional urban areas". Archived from the original on 29 June 2016. Retrieved 5 June 2016.
- "Tanzania: GDP at current prices, by region". Statista. Retrieved 21 October 2021.
- "Dhaka, Bangladesh GDP and Income Distribution". www.canback.com. Archived from the original on 1 July 2020. Retrieved 1 July 2020.
- "China: Administrative Division of Guăngdōng / 广东省". Archived from the original on 28 December 2014. Retrieved 25 May 2015.
- 东营市第六次全国人口普查主要数据公报. Dongying Bureau of Statistics. Archived from the original on 2 June 2015. Retrieved 27 July 2012.
- "China: Shāndōng (Prefectures, Cities, Districts and Counties) - Population Statistics, Charts and Map".
- "Gross Domestic Product (GDP) of the Emirate of Dubai 2006–2008". Dubai Statistics Centre. Archived from the original on 20 May 2010. Retrieved 5 May 2010.
- ""Metropolitan Area Populations"". 22 February 2020. Archived from the original on 3 December 2018. Retrieved 1 March 2020.
- "Punjab At A Glance". Punjab Board of Investment & Trade, Government of The Punjab. 2016. Archived from the original on 16 April 2017. Retrieved 15 April 2017.
- "Posição ocupada pelos 100 maiores municípios, em relação ao Produto Interno Bruto" (PDF). IBGE. 2012. Retrieved 9 May 2017.
- "Guăngdōng (China): Prefectural Division & Major Cities - Population Statistics, Maps, Charts, Weather and Web Information". www.citypopulation.de. Retrieved 24 May 2023.
- 県民経済計算平成22年度(2013年5月29日) ※2014年2月3日横浜市の計数を一部訂正した。 [Prefectural Accounts 2010 (May 29, 2013) * February 3, 2014 Partially revised the figures for Yokohama City.] (in Japanese). Cabinet Office, Government of Japan. Archived from the original on 17 October 2017. Retrieved 14 August 2016.
- "Department of Statistics Malaysia Official Portal". www.dosm.gov.my. Retrieved 30 September 2020.
- Australian Bureau of Statistics (27 June 2017). "2016 Community Profiles: Geelong". 2016 Census of Population and Housing. Retrieved 29 December 2019.
- "Significant Urban Area (SUA) ASGS Edition 2016 in .csv Format". Australian Bureau of Statistics. 9 October 2017. Retrieved 14 November 2019.
- "Bilan démographique selon le niveau géographique institutionnel". PX-Web.
- "Statistics Downloads" (PDF). Government of Gibraltar. Retrieved 9 April 2022.
- "US Dollar to British Pound Spot Exchange Rates for 2022". www.exchangerates.org.uk.
- "Gibraltar - Key Indicators". Gibraltar.gov.gi. 2020. Retrieved 5 June 2020.
- "2016 Census Community Profiles: Gladstone – Tannum Sands". ABS Census. Australian Bureau of Statistics. Archived from the original on 12 November 2019. Retrieved 12 November 2019.
- "3218.0 – Regional Population Growth, Australia, 2017-18: Population Estimates by Significant Urban Area, 2008 to 2018". Australian Bureau of Statistics. 27 March 2019. Retrieved 25 October 2019. Estimated resident population, 30 June 2018.
- "Guăngzhōu Shì (Sub-provincial City, China) - Population Statistics, Charts, Map and Location". citypopulation.de. Retrieved 18 May 2023.
- "Punjab at a Glance". Punjab Board of Investment and Trade. Government of Punjab. Archived from the original on 16 April 2017. Retrieved 23 December 2017.
- "Regional Statistics". www.cbs.gov.il.
- Yoshitsugu Kanemoto. "Metropolitan Employment Area (MEA) Data". Center for Spatial Information Science, The University of Tokyo.
- Conversion rates – Exchange rates – OECD Data
- "Major Agglomerations of the World - Population Statistics and Maps". 4 January 2022. Archived from the original on 4 January 2022. Retrieved 18 May 2023.
- "Hanoi's economic growth hits 4-year high of 7.62% in 2019". 28 December 2019.
- Yoshitsugu Kanemoto. "Metropolitan Employment Area (MEA) Data". Center for Spatial Information Science, The University of Tokyo.
- "3218.0 – Regional Population Growth, Australia, 2017-18: Main Features". Australian Bureau of Statistics. 27 March 2019. Retrieved 14 November 2019. Estimated resident population, 30 June 2018.
- Onishi, Tomoya. "Vietnam to boost Ho Chi Minh budget for first time in 18 years". Nikkei Asia. Retrieved 30 August 2022. (Subscription required.)
- "Report for Selected Countries and Subjects". IMF. Retrieved 13 April 2023.
- 中華民國 內政部戶政司 全球資訊網. 中華民國內政部戶政司 (in Chinese). 1 May 2018. Retrieved 29 November 2019.
- 呼和浩特市2012年国民经济和社会发展统计公报. Hohhot Municipal Bureau of Statistics (in Chinese). 1 April 2013. Retrieved 17 July 2015.
- "DocSend - Simple, intelligent, modern content sending". DocSend.
- Records, Official. "Year Wise Gross Domestic Product at Current Price of JAIPUR". Government of Rajasthan Directorate of Economics & Statistics District Domestic Produc. Retrieved 6 November 2021.
- "Jerusalem". Lloyd's. Archived from the original on 6 October 2015. Retrieved 27 May 2018.
- Vorster, Gareth (11 March 2015). Joburg vs Cape Town: Best city challenge (Report). Retrieved 14 May 2019.
- IBGE 2020
- "国勢調査 平成27年国勢調査 大都市圏・都市圏 | ファイル | 統計データを探す" [2015 Census Final Data]. 政府統計の総合窓口 (in Japanese).
- Asian Development Bank. "Karachi Mega-Cities Preparation Project" (PDF). Archived from the original (PDF) on 6 August 2011. Retrieved 1 January 2009.
- "State Statistics Service of Ukraine" (PDF). www.ukrstat.gov.ua.
- "India: States and Major Agglomerations - Population Statistics, Maps, Charts, Weather and Web Information". www.citypopulation.de. Retrieved 30 May 2023.
- Conversion rates - Exchange rates - OECD Data
- "Lagos Gross Domestic Product" (PDF). Lagos State Government. 2010. Archived from the original (PDF) on 25 April 2015. Retrieved 16 March 2015.
- "Population of Cities in Australia (2021)". worldpopulationreview.com. Retrieved 2 May 2021.
- Records, Official. "District Domestic Product Estimates Uttar Pradesh Year 2019-20" (PDF). Directorate of Economics And Statistics Government Of Uttar Pradesh. Retrieved 6 November 2021.
- "3218.0 – Regional Population Growth, Australia, 2017-18: Population Estimates by Significant Urban Area, 2008 to 2018". Australian Bureau of Statistics. 27 March 2019. Archived from the original on 27 March 2019. Retrieved 25 October 2019. Estimated resident population, 30 June 2018.
- "IBGE - Agência de Notícias". IBGE - Agência de Notícias. Retrieved 5 February 2019.
- "Global city GDP 2013–2014". Brookings Institution. 30 November 2001. Archived from the original on 21 March 2015. Retrieved 25 March 2015.
- "Badan Pusat Statistik Kota Medan". medankota.bps.go.id. Archived from the original on 1 January 2020. Retrieved 28 February 2019.
- "GRPS of regions and Minsk city in 2021".
- "United Nations Statistics Division - National Accounts". unstats.un.org.
- "Population and employment / IMSEE - Monaco IMSEE". www.monacostatistics.mc. Archived from the original on 27 December 2018. Retrieved 27 December 2018.
- Parilla, Jesus Leal Trujillo and Joseph (29 September 2016). "Redefining Global Cities". Brookings.
- (((61/33)^(1/15))^10)*33 and (((33/21)^(1/15))^10)*21.
- Records, Official. "District Domestic Product of Maharashtra 2011-12 to 2019-20" (PDF). Planning Department, Government of Maharashtra, India. Directorate of Economics and Statistics. Retrieved 6 March 2022.
- "Gross County Product 2019". Archived from the original on 7 October 2021. Alt URL Archived 27 March 2020 at the Wayback Machine
- "2021年江苏13市GDP出炉 苏州2.27万亿位居第一". ah.people.com.cn. Archived from the original on 26 January 2022. Retrieved 26 January 2022.
- "Major Agglomerations of the World - Population Statistics and Maps". 4 January 2022. Archived from the original on 4 January 2022. Retrieved 16 May 2023.
- Huang, Yanmei (黄艳梅); Yang, Zhixiong (杨志雄) (25 March 2008). 2007南宁市GDP总量首次突破一千亿元人民币. 中新广西网 (in Simplified Chinese). Archived from the original on 23 July 2015. Retrieved 23 July 2015 – via Xinhua Guangxi.
- "Dollar Yuan Exchange Rate - 35 Year Historical Chart". www.macrotrends.net. Retrieved 30 May 2023.
- "Guăngxī (China): Prefectural Division & Major Cities - Population Statistics, Maps, Charts, Weather and Web Information". www.citypopulation.de. Retrieved 30 May 2023.
- Australian Bureau of Statistics (27 June 2017). "Newcastle (Urban Centre/Locality)". 2016 Census QuickStats. Retrieved 3 November 2017.
- Yoshitsugu Kanemoto. "Metropolitan Employment Area (MEA) Data". Center for Spatial Information Science, The University of Tokyo. Archived from the original on 15 June 2018. Retrieved 29 September 2016.
- 2022年宁波市国民经济和社会发展统计公报 [Statistical Communiqué of Ningbo on the 2022 National Economic and Social Development]. tjj.ningbo.gov.cn (in Chinese). Ningbo Bureau of Statistics. 28 February 2022. Archived from the original on 30 October 2019. Retrieved 28 February 2022.
- "Database - Eurostat". ec.europa.eu. Archived from the original on 23 June 2019. Retrieved 23 April 2019.
- Badan Pusat Statistik Sumatra Selatan (2022). Produk Domestik Regional Bruto Kabupaten/kota di Sumatra Selatan 2019-2021. Palembang: Badan Pusat Statistik.
- Records, Official. "Directorate of Economics and Statistics". dse.bihar.gov.in. Retrieved 10 November 2021.
- "City of Tshwane, Metropolitan Municipality 799 from Census 2011". Census 2011. Retrieved 23 January 2022.
- "PIB por Entidad Federativa (PIBE) en 2019, Base 2013" (in Spanish). INEGI. Retrieved 13 February 2021.
- "Recife – IBGE Cidades". IBGE. Archived from the original on 21 December 2016. Retrieved 14 December 2016.
- "3218.0 – Regional Population Growth, Australia, 2017-18: Population Estimates by Significant Urban Area, 2008 to 2018". Australian Bureau of Statistics. 27 March 2019. Archived from the original on 27 March 2019. Retrieved 25 October 2019. Estimated resident population, 30 June 2018.
- "Валовой региональный продукт".
- Do G1, em São Paulo. "2013 GDPs" (in Portuguese). Terra.com. Archived from the original on 25 March 2014. Retrieved 24 March 2014.
- Já, Bahia. "IBGE: SALVADOR ocupa 22º lugar no ranking per capita do PIB/2011". Bahia Já. Archived from the original on 16 October 2014.
- "Santiago.cl". Santiago.cl. Archived from the original on 15 August 2009. Retrieved 17 April 2010.
- "Chile: Regions and Urban Agglomerations - Population Statistics, Maps, Charts, Weather and Web Information". www.citypopulation.de. Retrieved 30 May 2023.
- IBGE 2020
- IBGE 2020
- "2021년 지역소득(잠정)". www.kostat.go.kr. p. 57.
- GDP-2022 is a preliminary data "Home - Regional - Quarterly by Province" (Press release). China NBS. Retrieved 23 January 2023.
- "Shanghai first Chinese city to top 3 trillion yuan GDP". China Daily. Archived from the original on 20 January 2018. Retrieved 20 January 2018.
- "About Sharjah". This is sharjah. Archived from the original on 15 March 2015.
- "World City Populations 2022". worldpopulationreview.com. Archived from the original on 20 February 2020. Retrieved 10 June 2020.
- "东北三省会2019GDP公布,沈阳重回榜首". xw.qq.com.
- (PDF). 14 January 2022 https://web.archive.org/web/20220114105837/http://www.demographia.com/db-worldua.pdf. Archived from the original (PDF) on 14 January 2022. Retrieved 17 May 2023.
{{cite web}}: Missing or empty|title=(help) - "3218.0 – Regional Population Growth, Australia, 2017–18: Population Estimates by Significant Urban Area, 2008 to 2018". Australian Bureau of Statistics. 27 March 2019. Archived from the original on 27 March 2019. Retrieved 25 October 2019. Estimated resident population, 30 June 2018.
- IBGE 2020
- Badan Pusat Statistik Jawa Timur (2022). Produk Domestik Regional Bruto Kabupaten/kota di Jawa Timur 2019-2021. Surabaya: Badan Pusat Statistik.
- (PDF). 14 January 2022 https://web.archive.org/web/20220114105837/http://www.demographia.com/db-worldua.pdf. Archived from the original (PDF) on 14 January 2022. Retrieved 18 May 2023.
{{cite web}}: Missing or empty|title=(help) - Badan Pusat Statistik, Jakarta, 2021.
- "საქართველოს სტატისტიკის ეროვნული სამსახური". www.geostat.ge (in Georgian). Archived from the original on 13 September 2019. Retrieved 28 August 2019.
- "Tel Aviv 2022 Global Business Cities Report".
- "Major Agglomerations of the World - Population Statistics and Maps". 4 January 2022. Archived from the original on 4 January 2022. Retrieved 18 May 2023.
- "Tokelau's Gross Domestic Product determined for first time this century". www.tokelau.org.nz.
- Final population counts: 2016 Tokelau Census (PDF) (Report). Statistics New Zealand. November 2016. p. 3.
- "県民経済計算(平成23年度 - 令和2年度)(2008SNA、平成27年基準計数)<47都道府県、4政令指定都市分>".
- "3218.0 – Regional Population Growth, Australia, 2017–18: Population Estimates by Significant Urban Area, 2008 to 2018". Australian Bureau of Statistics. 27 March 2019. Archived from the original on 27 March 2019. Retrieved 25 October 2019. Estimated resident population, 30 June 2018.
- IBGE 2020
- 2022年温州GDP突破八千亿元. Retrieved 13 March 2023.
- Statistics. "Population estimates by selected Non-ABS Structures, 2010-2020". abs.gov.au. Australian Bureau of Statistics. Retrieved 30 March 2021.
- "超1.7万亿元,武汉2021年GDP同比增长12.2%-荆楚网-湖北日报网". News.cnhubei.com. 24 January 2022. Retrieved 25 February 2022.
- "Major Agglomerations of the World - Population Statistics and Maps". 4 January 2022. Archived from the original on 4 January 2022. Retrieved 16 May 2023.
- "乌鲁木齐市2019年国民经济和社会发展统计公报" (in Chinese). 12 March 2021. Retrieved 12 March 2021.
- Cox, W (2018). Demographia World Urban Areas. 14th Annual Edition (PDF). St. Louis: Demographia. p. 22.
- "Economy". Yerevan Municipality. Archived from the original on 5 September 2019. Retrieved 28 December 2019.
- "China: Guăngdōng (Prefectures, Cities, Districts and Counties) - Population Statistics, Charts and Map". www.citypopulation.de.
- "Gross Domestic Product by County and Metropolitan Area | FRED | St. Louis Fed". fred.stlouisfed.org. Retrieved 18 April 2023.
- "Population, MSA - Economic Data Series | FRED | St. Louis Fed". fred.stlouisfed.org. Retrieved 18 April 2023.
- "Global Wealth PPP Distribution: Who Are The Leaders Of The Global Economy? - Full Size". Visual Capitalist. Retrieved 21 October 2021.
- "Global city GDP 2021". Brookings Institution. Archived from the original on 5 June 2013. Retrieved 13 May 2013.
- "Ile-de-France- Portrait of the Region- Key figures (in French)". Regional Council of the Ile-de-France. Retrieved 24 November 2018.
- "Database - Regions - Eurostat".
- ec.europa.eu https://ec.europa.eu/eurostat/databrowser/view/met_10r_3gdp/default/table?lang=en. Retrieved 23 May 2023.
{{cite web}}: Missing or empty|title=(help) - ec.europa.eu https://ec.europa.eu/eurostat/databrowser/view/tgs00003/default/table?lang=en. Retrieved 23 May 2023.
{{cite web}}: Missing or empty|title=(help) - "Metropolitan areas". stats.oecd.org. Retrieved 26 May 2023.
- (PDF) https://www.collectivites-locales.gouv.fr/files/Accueil/DESL/2021/Interco/listem%C3%A9tropolejanvier2021.pdf. Retrieved 30 May 2023.
{{cite web}}: Missing or empty|title=(help) - "Cork (Cork City / Cork, All Towns, Ireland) - Population Statistics, Charts, Map, Location, Weather and Web Information". www.citypopulation.de. Retrieved 30 May 2023.
- "Utrecht (Province, Netherlands) - Population Statistics, Charts, Map and Location". www.citypopulation.de. Retrieved 24 May 2023.
- "Population density by canton and municipality on 1st January(Inhabitants per km2) 1821 - 2021". www.statistiques.public.lu. Statistics portal of the Grand-Duchy of Luxembourg. Retrieved 23 January 2022.
- "Braunschweig (Niedersachsen, Urban Agglomerations, Germany) - Population Statistics, Charts, Map, Location, Weather and Web Information". www.citypopulation.de. Retrieved 29 May 2023.
- "Salzgitter (Salzgitter, Lower Saxony, Germany) - Population Statistics, Charts, Map, Location, Weather and Web Information". www.citypopulation.de. Retrieved 29 May 2023.
- "Wolfsburg (Niedersachsen, Urban Agglomerations, Germany) - Population Statistics, Charts, Map, Location, Weather and Web Information". www.citypopulation.de. Retrieved 29 May 2023.
- "Malmö Metropolitan Area (Sweden): Demographic Statistical Areas - Population Statistics, Charts and Map". www.citypopulation.de. Retrieved 29 May 2023.
- "Communes in Nantes (Loire-Atlantique, France) - Population Statistics, Charts, Map, Location, Weather and Web Information". www.citypopulation.de. Retrieved 30 May 2023.
- "Rhein-Neckar-Kreis (County, Baden-Württemberg, Germany) - Population Statistics, Charts, Map and Location". www.citypopulation.de. Retrieved 30 May 2023.
- "Urban Settlements in Aarhus (Midtjylland, Denmark) - Population Statistics, Charts, Map, Location, Weather and Web Information". www.citypopulation.de. Retrieved 30 May 2023.
- "Communes in Grenoble (Isère, France) - Population Statistics, Charts, Map, Location, Weather and Web Information". www.citypopulation.de. Retrieved 30 May 2023.
- "Eindhoven (North Brabant, Netherlands) - Population Statistics, Charts, Map, Location, Weather and Web Information". www.citypopulation.de. Retrieved 30 May 2023.
- "Aire d'attraction des villes 2020 de Strasbourg (partie française) (010)". insee.fr. Retrieved 24 September 2020.
- "Communes in Rennes (Ille-et-Vilaine, France) - Population Statistics, Charts, Map, Location, Weather and Web Information". citypopulation.de. Retrieved 30 May 2023.
- "Bilancio demografico mensile". demo.istat.it. Retrieved 30 May 2023.
- (PDF) https://www.collectivites-locales.gouv.fr/files/Accueil/DESL/2021/Interco/listem%C3%A9tropolejanvier2021.pdf. Retrieved 30 May 2023.
{{cite web}}: Missing or empty|title=(help) - "Karlsruhe (Baden-Württemberg / Rheinland-Pfalz, Urban Agglomerations, Germany) - Population Statistics, Charts, Map, Location, Weather and Web Information". www.citypopulation.de. Retrieved 30 May 2023.
- "Bilancio demografico mensile". demo.istat.it. Retrieved 30 May 2023.
- "Comunitat Valenciana / Comunidad Valenciana (Spain): Provinces, Major Cities & Municipalities - Population Statistics, Maps, Charts, Weather and Web Information". www.citypopulation.de. Retrieved 30 May 2023.
- "Cities and Municipalities in Gent (Oost-Vlaanderen, Belgium) - Population Statistics, Charts, Map, Location, Weather and Web Information". www.citypopulation.de. Retrieved 2 June 2023.
- "Ingolstadt (Bayern, Urban Agglomerations, Germany) - Population Statistics, Charts, Map, Location, Weather and Web Information". www.citypopulation.de. Retrieved 2 June 2023.
- ISTAT. (1983). L'Italia : Istat. Istat. OCLC 889439927. Retrieved 26 February 2020.
- "Veneto / Venetia (Italy): Provinces, Major Cities & Communes - Population Statistics, Maps, Charts, Weather and Web Information". www.citypopulation.de. Retrieved 2 June 2023.
- "Mannheim - Ludwigshafen - Heidelberg (Baden-Württemberg / Rheinland-Pfalz / Hessen, Urban Agglomerations, Germany) - Population Statistics, Charts, Map, Location, Weather and Web Information". www.citypopulation.de. Retrieved 2 June 2023.
- "Murcia (Province, Spain) - Population Statistics, Charts, Map and Location". www.citypopulation.de. Retrieved 2 June 2023.
- Dr. Amarendra Bhushan Dhiraj (12 February 2018). "World's 15 Richest Cities In 2017: New York, London, And Tokyo, Tops List". CEO World Magazine.