List of countries in the Americas by life expectancy
This is a list of American countries by life expectancy at birth.
World Bank Group (2021)
Estimation of the World Bank Group for 2021.[1][2][3] The data is filtered according to the list of countries in the Americas. The values in the World Bank Group tables are rounded. All calculations are based on raw data; so due to the nuances of rounding, in some places illusory inconsistencies of indicators arose, with a size of 0.01 year.
| Countries & territories |
2021 | Historical data | COVID-19 impact | |||||||||||||
|---|---|---|---|---|---|---|---|---|---|---|---|---|---|---|---|---|
| All | Male | Female | Gender gap |
2000 | 2000 →2014 |
2014 | 2014 →2019 |
2019 | 2019 →2020 |
2020 | 2020 →2021 |
2021 | 2019 →2021 |
2014 →2021 | ||
| 82.60 | 80.62 | 84.67 | 4.05 | 79.17 | 2.62 | 81.78 | 0.44 | 82.23 | −0.56 | 81.67 | 0.93 | 82.60 | 0.37 | 0.81 | ||
| 80.38 | 77.25 | 83.62 | 6.37 | 76.66 | 3.30 | 79.97 | 0.02 | 79.98 | 0.17 | 80.15 | 0.23 | 80.38 | 0.40 | 0.41 | ||
| 80.16 | 75.86 | 84.52 | 8.66 | 75.98 | 2.95 | 78.93 | 0.13 | 79.06 | −1.02 | 78.04 | 2.12 | 80.16 | 1.10 | 1.23 | ||
| 80.07 | 76.80 | 83.50 | 6.70 | 76.62 | 2.25 | 78.87 | 0.80 | 79.67 | 0.15 | 79.82 | 0.25 | 80.07 | 0.40 | 1.20 | ||
| 79.28 | 75.82 | 82.71 | 6.89 | 78.86 | 0.66 | 79.52 | 1.52 | 81.03 | 0.10 | 81.14 | −1.86 | 79.28 | −1.75 | −0.24 | ||
| 78.94 | 76.47 | 81.44 | 4.97 | 76.87 | 2.60 | 79.47 | 0.85 | 80.33 | −0.95 | 79.38 | −0.43 | 78.94 | −1.38 | −0.53 | ||
| 78.50 | 75.78 | 80.94 | 5.17 | 74.61 | 3.25 | 77.86 | 0.83 | 78.69 | 0.15 | 78.84 | −0.34 | 78.50 | −0.19 | 0.64 | ||
| 77.57 | 75.63 | 79.36 | 3.73 | 74.09 | 2.39 | 76.48 | 0.78 | 77.26 | 0.14 | 77.39 | 0.18 | 77.57 | 0.31 | 1.09 | ||
| 77.02 | 74.42 | 79.81 | 5.39 | 77.59 | 1.19 | 78.77 | 0.65 | 79.43 | −0.15 | 79.28 | −2.25 | 77.02 | −2.40 | −1.75 | ||
| North America | 76.98 | 74.24 | 79.85 | 5.62 | 76.89 | 2.25 | 79.14 | 0.01 | 79.14 | −1.68 | 77.46 | −0.49 | 76.98 | −2.16 | −2.16 | |
| 76.33 | 73.50 | 79.30 | 5.80 | 76.64 | 2.20 | 78.84 | −0.05 | 78.79 | −1.81 | 76.98 | −0.65 | 76.33 | −2.46 | −2.51 | ||
| 76.22 | 73.05 | 79.59 | 6.54 | 74.00 | 3.25 | 77.25 | 0.56 | 77.81 | −1.15 | 76.66 | −0.43 | 76.22 | −1.59 | −1.03 | ||
| 75.44 | 71.65 | 79.26 | 7.60 | 75.03 | 2.34 | 77.37 | 0.14 | 77.51 | 0.92 | 78.43 | −2.99 | 75.44 | −2.07 | −1.93 | ||
| 75.39 | 72.18 | 78.65 | 6.47 | 73.93 | 2.83 | 76.75 | 0.53 | 77.28 | −1.39 | 75.89 | −0.50 | 75.39 | −1.89 | −1.36 | ||
| 74.94 | 72.21 | 77.90 | 5.69 | 72.78 | 2.20 | 74.98 | −0.12 | 74.86 | 0.06 | 74.92 | 0.01 | 74.94 | 0.07 | −0.05 | ||
| 74.63 | 71.80 | 77.31 | 5.52 | 73.57 | 2.03 | 75.60 | 0.65 | 76.25 | −0.53 | 75.72 | −1.10 | 74.63 | −1.62 | −0.97 | ||
| 74.59 | 71.81 | 77.70 | 5.89 | 73.58 | 3.56 | 77.14 | −1.81 | 75.33 | −0.32 | 75.00 | −0.41 | 74.59 | −0.74 | −2.55 | ||
| 74.49 | 71.75 | 77.46 | 5.71 | 73.97 | 1.65 | 75.61 | 0.25 | 75.86 | −0.01 | 75.85 | −1.36 | 74.49 | −1.37 | −1.12 | ||
| 73.97 | 71.54 | 76.70 | 5.16 | 74.51 | 2.26 | 76.77 | −1.34 | 75.44 | −0.85 | 74.58 | −0.61 | 73.97 | −1.47 | −2.80 | ||
| 73.84 | 70.84 | 76.80 | 5.97 | 67.23 | 5.58 | 72.81 | 1.24 | 74.05 | −2.26 | 71.80 | 2.04 | 73.84 | −0.22 | 1.03 | ||
| 73.68 | 71.25 | 76.36 | 5.11 | 76.18 | 1.67 | 77.85 | −0.24 | 77.61 | −0.04 | 77.57 | −3.88 | 73.68 | −3.93 | −4.17 | ||
| 73.67 | 70.26 | 77.46 | 7.20 | 72.84 | 3.78 | 76.62 | 0.67 | 77.30 | −5.14 | 72.15 | 1.52 | 73.67 | −3.63 | −2.95 | ||
| 72.97 | 69.66 | 76.40 | 6.74 | 69.10 | 5.11 | 74.22 | 0.01 | 74.23 | 0.18 | 74.41 | −1.44 | 72.97 | −1.26 | −1.24 | ||
| 72.83 | 69.40 | 76.44 | 7.04 | 71.32 | 4.72 | 76.04 | 0.71 | 76.75 | −1.98 | 74.77 | −1.94 | 72.83 | −3.92 | −3.21 | ||
| 72.81 | 69.72 | 76.30 | 6.58 | 72.69 | −3.26 | 69.43 | 4.12 | 73.56 | 0.09 | 73.65 | −0.84 | 72.81 | −0.75 | 3.38 | ||
| 72.75 | 69.56 | 76.01 | 6.45 | 69.74 | 4.57 | 74.31 | 1.03 | 75.34 | −1.33 | 74.01 | −1.26 | 72.75 | −2.59 | −1.56 | ||
| 72.61 | 69.30 | 76.29 | 6.99 | 69.42 | 3.44 | 72.87 | 0.71 | 73.58 | −0.69 | 72.89 | −0.27 | 72.61 | −0.96 | −0.25 | ||
| 72.38 | 70.12 | 74.75 | 4.62 | 70.42 | 4.91 | 75.33 | 0.82 | 76.16 | −2.49 | 73.67 | −1.29 | 72.38 | −3.78 | −2.96 | ||
| Latin America & Caribbean | 72.15 | 68.80 | 75.70 | 6.90 | 71.23 | 3.32 | 74.55 | 0.49 | 75.04 | −2.00 | 73.04 | −0.89 | 72.15 | −2.89 | −2.40 | |
| 71.68 | 68.35 | 75.34 | 6.99 | 69.78 | 1.18 | 70.97 | 0.61 | 71.57 | 0.05 | 71.63 | 0.06 | 71.68 | 0.11 | 0.72 | ||
| 71.60 | 68.12 | 75.10 | 6.98 | 72.04 | 1.33 | 73.37 | −2.16 | 71.20 | 1.47 | 72.68 | −1.08 | 71.60 | 0.39 | −1.77 | ||
| World | 71.33 | 68.89 | 73.95 | 5.06 | 67.70 | 4.18 | 71.88 | 1.10 | 72.98 | −0.74 | 72.24 | −0.92 | 71.33 | −1.65 | −0.55 | |
| 71.15 | 69.65 | 72.72 | 3.07 | 66.10 | 5.88 | 71.99 | 0.06 | 72.04 | −0.41 | 71.64 | −0.49 | 71.15 | −0.90 | −0.84 | ||
| 71.11 | 67.84 | 74.72 | 6.88 | 70.77 | 2.10 | 72.86 | 0.58 | 73.44 | −0.03 | 73.42 | −2.30 | 71.11 | −2.33 | −1.75 | ||
| Caribbean small states | 71.00 | 68.27 | 73.84 | 5.57 | 69.61 | 3.07 | 72.68 | −0.16 | 72.52 | 0.06 | 72.58 | −1.58 | 71.00 | −1.53 | −1.68 | |
| 70.75 | 66.08 | 75.15 | 9.07 | 69.86 | 1.88 | 71.75 | 0.81 | 72.56 | −1.50 | 71.06 | −0.31 | 70.75 | −1.81 | −1.00 | ||
| 70.55 | 66.26 | 75.21 | 8.95 | 72.48 | 0.38 | 72.85 | −0.69 | 72.16 | −1.07 | 71.09 | −0.54 | 70.55 | −1.61 | −2.30 | ||
| 70.50 | 68.47 | 72.54 | 4.07 | 70.94 | 2.04 | 72.98 | −1.22 | 71.77 | 0.10 | 71.87 | −1.37 | 70.50 | −1.27 | −2.48 | ||
| 70.47 | 67.12 | 74.33 | 7.21 | 68.56 | 4.75 | 73.31 | 0.62 | 73.93 | −1.08 | 72.85 | −2.38 | 70.47 | −3.46 | −2.84 | ||
| 70.27 | 67.21 | 73.55 | 6.34 | 65.51 | 4.27 | 69.78 | 2.46 | 72.24 | 0.32 | 72.56 | −2.29 | 70.27 | −1.97 | 0.49 | ||
| 70.26 | 67.43 | 73.39 | 5.95 | 69.75 | 3.13 | 72.88 | 0.74 | 73.62 | −0.44 | 73.18 | −2.92 | 70.26 | −3.36 | −2.62 | ||
| 70.21 | 66.06 | 74.86 | 8.81 | 73.57 | 1.23 | 74.80 | −0.59 | 74.20 | −4.07 | 70.13 | 0.08 | 70.21 | −3.99 | −4.58 | ||
| 70.12 | 67.89 | 72.53 | 4.64 | 68.66 | 3.60 | 72.26 | 0.62 | 72.88 | −1.42 | 71.46 | −1.34 | 70.12 | −2.76 | −2.14 | ||
| 69.63 | 67.35 | 72.40 | 5.04 | 71.38 | 3.10 | 74.47 | −1.64 | 72.83 | −0.71 | 72.13 | −2.50 | 69.63 | −3.21 | −4.84 | ||
| 69.24 | 66.00 | 72.65 | 6.65 | 67.45 | 4.52 | 71.96 | 1.17 | 73.13 | −1.33 | 71.80 | −2.56 | 69.24 | −3.89 | −2.73 | ||
| 65.67 | 62.48 | 69.10 | 6.62 | 64.48 | 3.40 | 67.88 | 1.24 | 69.12 | −0.64 | 68.49 | −2.81 | 65.67 | −3.45 | −2.21 | ||
| 63.63 | 60.88 | 66.80 | 5.92 | 62.35 | 4.82 | 67.16 | 0.68 | 67.84 | −3.37 | 64.47 | −0.84 | 63.63 | −4.21 | −3.53 | ||
| 63.19 | 60.40 | 66.12 | 5.72 | 58.37 | 4.62 | 62.99 | 1.27 | 64.25 | −0.20 | 64.05 | −0.86 | 63.19 | −1.06 | 0.20 | ||
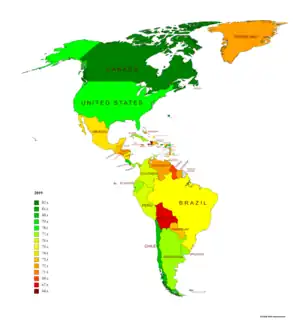
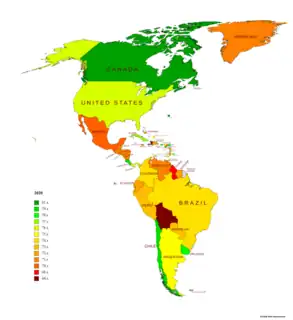

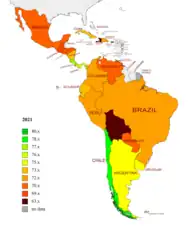
Change in life expecancy in the Americas from 2019 to 2021[1]
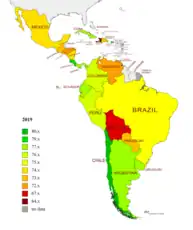
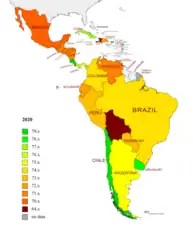
United Nations (2021)
Estimation of the analytical agency of the UN for 2019 and 2021.[4][5][6] By default, the list is sorted by 2021.
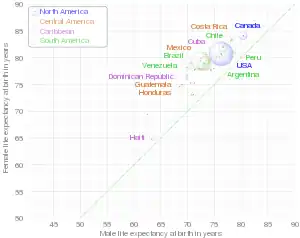
Interactive chart of male and female life expectancy in America as defined by WHO for 2019. Open the original chart and hover over chart elements. The squares of bubbles are proportional to population according to estimation of the UN for 2019.
| Countries & territories |
2019 | 2021 | 2019 →2021 | ||||||
|---|---|---|---|---|---|---|---|---|---|
| All | Male | Female | Gender gap |
All | Male | Female | Gender gap | ||
| 82.4 | 80.4 | 84.4 | 4.0 | 82.7 | 80.6 | 84.7 | 4.1 | 0.3 | |
| 80.2 | 77.8 | 82.4 | 4.6 | 78.9 | 76.5 | 81.4 | 4.9 | −1.3 | |
| 77.0 | 75.9 | 78.1 | 2.2 | 78.5 | 75.8 | 80.9 | 5.1 | 1.5 | |
| 79.2 | 77.8 | 80.5 | 2.7 | 77.6 | 75.6 | 79.4 | 3.8 | −1.6 | |
| 78.9 | 76.3 | 81.4 | 5.1 | 77.2 | 74.3 | 80.2 | 5.9 | −1.7 | |
| 80.3 | 77.7 | 82.9 | 5.2 | 77.0 | 74.4 | 79.8 | 5.4 | −3.3 | |
| 78.5 | 75.4 | 81.8 | 6.4 | 76.2 | 73.0 | 79.6 | 6.6 | −2.3 | |
| 76.7 | 73.2 | 80.0 | 6.8 | 75.4 | 72.2 | 78.6 | 6.4 | −1.3 | |
| 77.9 | 74.1 | 81.5 | 7.4 | 75.4 | 71.7 | 79.3 | 7.6 | −2.5 | |
| 72.4 | 70.1 | 75.0 | 4.9 | 74.9 | 72.2 | 77.9 | 5.7 | 2.5 | |
| 74.5 | 70.9 | 78.0 | 7.1 | 73.8 | 70.8 | 76.8 | 6.0 | −0.7 | |
| 78.8 | 76.8 | 80.8 | 4.0 | 73.7 | 71.2 | 76.4 | 5.2 | −5.1 | |
| 77.0 | 74.3 | 79.8 | 5.5 | 73.7 | 70.3 | 77.5 | 7.2 | −3.3 | |
| 73.5 | 70.9 | 76.2 | 5.3 | 73.0 | 69.7 | 76.4 | 6.7 | −0.5 | |
| 78.2 | — | — | — | 72.8 | 69.7 | 76.3 | 6.6 | −5.4 | |
| 75.9 | 72.2 | 79.6 | 7.4 | 72.8 | 69.6 | 76.0 | 6.4 | −3.1 | |
| 77.3 | 74.5 | 80.0 | 5.5 | 72.8 | 69.4 | 76.4 | 7.0 | −4.5 | |
| 74.1 | 71.0 | 77.4 | 6.4 | 72.6 | 69.3 | 76.3 | 7.0 | −1.5 | |
| 76.7 | 74.1 | 79.5 | 5.4 | 72.4 | 70.1 | 74.7 | 4.6 | −4.3 | |
| 74.8 | — | — | — | 71.7 | 68.3 | 75.3 | 7.0 | −3.1 | |
| 73.9 | 71.7 | 76.1 | 4.4 | 71.6 | 68.1 | 75.1 | 7.0 | −2.3 | |
| World | 72.8 | 70.6 | 75.0 | 4.4 | 71.4 | 68.9 | 74.0 | 5.1 | −1.4 |
| 76.2 | 74.9 | 77.6 | 2.7 | 71.1 | 67.8 | 74.7 | 6.9 | −5.1 | |
| 73.3 | 68.5 | 77.8 | 9.3 | 70.7 | 66.1 | 75.1 | 9.0 | −2.6 | |
| 72.1 | 68.3 | 76.0 | 7.7 | 70.6 | 66.3 | 75.2 | 8.9 | −1.5 | |
| 74.5 | 72.9 | 76.1 | 3.2 | 70.5 | 68.5 | 72.5 | 4.0 | −4.0 | |
| 74.6 | 71.7 | 77.8 | 6.1 | 70.5 | 67.1 | 74.3 | 7.2 | −4.1 | |
| 74.3 | 72.3 | 76.4 | 4.1 | 70.3 | 67.4 | 73.4 | 6.0 | −4.0 | |
| 71.7 | 68.5 | 75.1 | 6.6 | 70.3 | 67.2 | 73.6 | 6.4 | −1.4 | |
| 75.1 | 72.2 | 77.9 | 5.7 | 70.2 | 66.1 | 74.9 | 8.8 | −4.9 | |
| 75.3 | 73.0 | 77.6 | 4.6 | 70.1 | 67.9 | 72.5 | 4.6 | −5.2 | |
| 72.5 | 70.3 | 75.1 | 4.8 | 69.6 | 67.4 | 72.4 | 5.0 | −2.9 | |
| 74.3 | 71.4 | 77.2 | 5.8 | 69.2 | 66.0 | 72.7 | 6.7 | −5.1 | |
| 69.9 | 66.9 | 73.1 | 6.2 | 65.7 | 62.5 | 69.1 | 6.6 | −4.2 | |
| 71.5 | 68.7 | 74.5 | 5.8 | 63.6 | 60.9 | 66.8 | 5.9 | −7.9 | |
| 64.0 | 61.8 | 66.2 | 4.4 | 63.2 | 60.4 | 66.1 | 5.7 | −0.8 | |
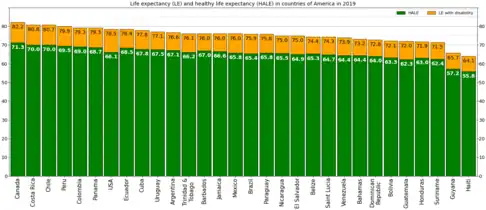
WHO (2019)
Estimation of the World Health Organization for 2019.[7][8]
| Countries | Life expectancy at birth | HALE at birth | Life expectancy at age 60 | HALE at age 60 | |||||||||||||||||
|---|---|---|---|---|---|---|---|---|---|---|---|---|---|---|---|---|---|---|---|---|---|
| All | M | F | FΔM | Δ 2000 |
All | M | F | FΔM | Δ 2000 |
All | M | F | FΔM | Δ 2000 |
All | M | F | FΔM | Δ 2000 | ||
| 82.2 | 80.4 | 84.1 | 3.7 | 3.1 | 71.3 | 70.5 | 72.0 | 1.5 | 1.9 | 25.2 | 23.8 | 26.4 | 2.6 | 2.7 | 19.0 | 18.2 | 19.7 | 1.5 | 1.7 | ||
| 80.8 | 78.3 | 83.4 | 5.1 | 2.8 | 70.0 | 68.6 | 71.3 | 2.7 | 2.0 | 25.0 | 23.6 | 26.4 | 2.8 | 2.6 | 18.7 | 17.8 | 19.5 | 1.7 | 1.8 | ||
| 80.7 | 78.1 | 83.2 | 5.1 | 3.9 | 70.0 | 69.0 | 71.1 | 2.1 | 3.0 | 24.3 | 22.4 | 25.9 | 3.5 | 3.0 | 18.4 | 17.3 | 19.3 | 2.0 | 2.0 | ||
| 79.9 | 78.5 | 81.3 | 2.8 | 5.5 | 69.5 | 69.2 | 69.8 | 0.6 | 4.6 | 24.4 | 23.7 | 25.1 | 1.4 | 2.1 | 18.5 | 18.3 | 18.7 | 0.4 | 1.5 | ||
| 79.3 | 76.7 | 81.9 | 5.2 | 5.6 | 69.0 | 67.4 | 70.5 | 3.1 | 4.9 | 24.0 | 22.5 | 25.3 | 2.8 | 2.3 | 18.1 | 17.1 | 18.9 | 1.8 | 1.8 | ||
| 79.3 | 76.6 | 82.1 | 5.5 | 2.1 | 68.7 | 67.4 | 70.0 | 2.6 | 1.5 | 24.3 | 22.6 | 26.0 | 3.4 | 1.0 | 18.1 | 17.1 | 19.2 | 2.1 | 0.5 | ||
| 78.5 | 76.3 | 80.7 | 4.4 | 1.8 | 66.1 | 65.2 | 67.0 | 1.8 | 0.3 | 23.1 | 21.8 | 24.4 | 2.6 | 1.7 | 16.4 | 15.6 | 17.1 | 1.5 | 0.7 | ||
| 78.4 | 76.4 | 80.5 | 4.1 | 3.9 | 68.5 | 67.7 | 69.3 | 1.6 | 3.3 | 23.2 | 22.0 | 24.3 | 2.3 | 1.3 | 17.6 | 17.0 | 18.2 | 1.2 | 0.8 | ||
| 77.8 | 75.4 | 80.3 | 4.9 | 1.0 | 67.8 | 66.6 | 69.2 | 2.6 | 0.7 | 21.6 | 20.0 | 23.2 | 3.2 | 0.0 | 16.3 | 15.2 | 17.4 | 2.2 | −0.2 | ||
| Americas[9] | 77.2 | 74.5 | 79.8 | 5.3 | 3.1 | 66.2 | 64.8 | 67.5 | 2.7 | 2.1 | 22.7 | 21.2 | 24.0 | 2.8 | 1.6 | 16.6 | 15.7 | 17.4 | 1.7 | 0.9 | |
| 77.1 | 73.5 | 80.6 | 7.1 | 2.3 | 67.5 | 65.4 | 69.5 | 4.1 | 1.6 | 21.7 | 19.0 | 24.0 | 5.0 | 1.1 | 16.6 | 14.9 | 18.2 | 3.3 | 0.6 | ||
| 76.6 | 73.5 | 79.5 | 6.0 | 2.5 | 67.1 | 65.4 | 68.8 | 3.4 | 2.0 | 21.1 | 18.8 | 23.1 | 4.3 | 0.9 | 16.3 | 14.8 | 17.6 | 2.8 | 0.7 | ||
| 76.5 | 74.9 | 78.0 | 3.1 | 1.9 | 67.0 | 66.2 | 67.7 | 1.5 | 1.5 | 20.6 | 19.8 | 21.3 | 1.5 | 0.3 | 15.8 | 15.3 | 16.3 | 1.0 | 0.1 | ||
| 76.1 | 72.5 | 79.9 | 7.4 | 6.4 | 66.2 | 64.0 | 68.6 | 4.6 | 4.8 | 22.7 | 20.4 | 25.0 | 4.6 | 4.6 | 17.2 | 15.6 | 18.9 | 3.3 | 3.2 | ||
| 76.0 | 74.3 | 77.7 | 3.4 | 1.5 | 67.0 | 66.2 | 67.7 | 1.5 | 1.0 | 20.9 | 19.9 | 21.8 | 1.9 | 0.2 | 16.3 | 15.7 | 16.9 | 1.2 | −0.1 | ||
| 76.0 | 74.4 | 77.7 | 3.3 | 1.8 | 66.6 | 65.9 | 67.3 | 1.4 | 1.2 | 21.3 | 20.1 | 22.6 | 2.5 | 0.3 | 16.4 | 15.5 | 17.3 | 1.8 | 0.1 | ||
| 76.0 | 73.1 | 78.9 | 5.8 | 1.6 | 65.8 | 64.3 | 67.2 | 2.9 | 1.2 | 21.8 | 20.5 | 23.1 | 2.6 | 0.2 | 16.1 | 15.3 | 16.8 | 1.5 | 0.3 | ||
| 75.9 | 72.4 | 79.4 | 7.0 | 4.4 | 65.4 | 63.4 | 67.4 | 4.0 | 3.7 | 21.9 | 20.1 | 23.5 | 3.4 | 2.2 | 16.4 | 15.2 | 17.4 | 2.2 | 1.6 | ||
| 75.8 | 73.1 | 78.8 | 5.7 | 1.0 | 65.8 | 64.5 | 67.3 | 2.8 | 0.8 | 21.8 | 20.2 | 23.5 | 3.3 | −0.2 | 16.5 | 15.4 | 17.6 | 2.2 | −0.3 | ||
| 75.0 | 72.1 | 77.9 | 5.8 | 1.7 | 65.5 | 63.7 | 67.2 | 3.5 | 1.8 | 20.0 | 18.0 | 21.9 | 3.9 | −0.1 | 15.1 | 13.7 | 16.3 | 2.6 | 0.0 | ||
| 75.0 | 70.6 | 79.1 | 8.5 | 2.5 | 64.9 | 61.6 | 67.8 | 6.2 | 2.2 | 22.1 | 20.4 | 23.6 | 3.2 | 0.7 | 16.4 | 15.1 | 17.4 | 2.3 | 0.3 | ||
| 74.4 | 71.4 | 77.8 | 6.4 | 4.1 | 65.3 | 63.5 | 67.3 | 3.8 | 3.0 | 21.5 | 20.3 | 22.9 | 2.6 | 2.8 | 16.7 | 15.9 | 17.6 | 1.7 | 2.0 | ||
| 74.3 | 71.3 | 77.7 | 6.4 | 1.1 | 64.7 | 63.0 | 66.6 | 3.6 | 0.7 | 20.9 | 19.2 | 22.9 | 3.7 | 0.9 | 15.8 | 14.7 | 17.1 | 2.4 | 0.6 | ||
| 73.9 | 69.9 | 78.2 | 8.3 | −0.2 | 64.4 | 61.9 | 67.1 | 5.2 | −0.3 | 21.7 | 19.7 | 23.6 | 3.9 | 0.4 | 16.3 | 15.0 | 17.5 | 2.5 | 0.3 | ||
| World | 73.3 | 70.8 | 75.9 | 5.1 | 6.5 | 63.7 | 62.5 | 64.9 | 2.4 | 5.4 | 21.1 | 19.5 | 22.7 | 3.2 | 2.3 | 15.8 | 14.8 | 16.6 | 1.8 | 1.7 | |
| 73.2 | 69.9 | 76.6 | 6.7 | 2.3 | 64.4 | 62.3 | 66.5 | 4.2 | 1.7 | 20.8 | 19.1 | 22.4 | 3.3 | 0.9 | 16.2 | 14.9 | 17.3 | 2.4 | 0.6 | ||
| 73.2 | 71.3 | 75.3 | 4.0 | 2.6 | 64.0 | 62.9 | 65.1 | 2.2 | 1.8 | 20.9 | 20.2 | 21.6 | 1.4 | 2.4 | 15.9 | 15.4 | 16.4 | 1.0 | 1.6 | ||
| 72.9 | 70.6 | 75.3 | 4.7 | 0.9 | 63.9 | 62.6 | 65.4 | 2.8 | 0.3 | 18.7 | 17.2 | 20.3 | 3.1 | 0.8 | 14.3 | 13.1 | 15.6 | 2.5 | 0.4 | ||
| 72.8 | 69.8 | 76.2 | 6.4 | −0.4 | 64.0 | 62.1 | 66.1 | 4.0 | −0.1 | 20.6 | 19.0 | 22.4 | 3.4 | −1.8 | 16.0 | 14.8 | 17.2 | 2.4 | −1.3 | ||
| 72.1 | 71.1 | 73.1 | 2.0 | 6.1 | 63.3 | 63.2 | 63.3 | 0.1 | 5.4 | 18.6 | 18.0 | 19.1 | 1.1 | 0.8 | 14.2 | 14.0 | 14.4 | 0.4 | 0.6 | ||
| 72.0 | 69.0 | 75.0 | 6.0 | 5.2 | 62.3 | 60.5 | 64.1 | 3.6 | 4.5 | 20.5 | 19.4 | 21.4 | 2.0 | 1.4 | 15.0 | 14.4 | 15.5 | 1.1 | 0.9 | ||
| 71.9 | 70.7 | 73.2 | 2.5 | 1.9 | 63.0 | 62.7 | 63.3 | 0.6 | 1.8 | 18.3 | 17.5 | 19.1 | 1.6 | −1.3 | 13.8 | 13.4 | 14.2 | 0.8 | −0.9 | ||
| 71.5 | 68.5 | 74.6 | 6.1 | 1.6 | 62.4 | 60.7 | 64.2 | 3.5 | 1.1 | 18.5 | 16.4 | 20.5 | 4.1 | −0.4 | 14.1 | 12.6 | 15.4 | 2.8 | −0.4 | ||
| 65.7 | 62.5 | 69.4 | 6.9 | 2.7 | 57.2 | 55.1 | 59.7 | 4.6 | 2.2 | 16.6 | 15.1 | 18.1 | 3.0 | 0.7 | 12.5 | 11.5 | 13.6 | 2.1 | 0.4 | ||
| 64.1 | 63.3 | 64.8 | 1.5 | 7.1 | 55.8 | 55.9 | 55.8 | −0.1 | 5.8 | 16.8 | 16.5 | 17.0 | 0.5 | 1.0 | 12.8 | 12.7 | 12.9 | 0.2 | 0.7 | ||
Charts
 Comparison of life expectancy in some countries of North America[1]
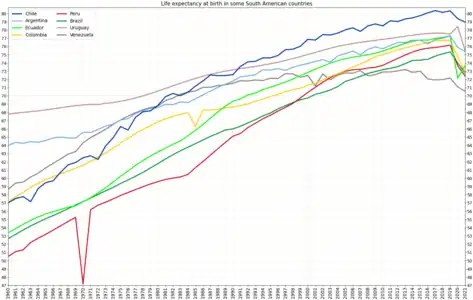 Comparison of life expectancy in some countries of South America[1]

Change in life expectancy in Latin America from 2019 to 2021[1]
See also
- List of countries by life expectancy
- List of North American countries by life expectancy
- List of South American countries by life expectancy
- List of Caribbean countries by life expectancy
- List of Central American countries by life expectancy
- List of Latin American countries by life expectancy
- List of countries in the Americas by population
- Oldest people
- Longevity
- Life extension
References
- "Life expectancy at birth, total". The World Bank Group. 19 September 2023. Retrieved 23 September 2023.
- "Life expectancy at birth, male". The World Bank Group. 19 September 2023. Retrieved 23 September 2023.
- "Life expectancy at birth, female". The World Bank Group. 19 September 2023. Retrieved 23 September 2023.
- "Human Development Report 2020 (tables 1 and 4)" (PDF). UN Development Programme. Archived from the original (PDF) on 15 December 2020. Retrieved 28 February 2021.
- "Human Development Report 2021/2022 (tables 1 and 4)" (PDF). UN Development Programme. Retrieved 28 June 2023.
- "Population & Demography Data Explorer". Retrieved 3 July 2023.
- "Life expectancy and Healthy life expectancy, data by country". World Health Organization. 4 December 2022.
- "Life expectancy and Healthy life expectancy, data by WHO region". World Health Organization. 7 December 2022.
- "WHO: PAHO: Countries and Centers". World Health Organization. Retrieved 7 May 2022.
This article is issued from Wikipedia. The text is licensed under Creative Commons - Attribution - Sharealike. Additional terms may apply for the media files.