List of countries by inequality-adjusted Human Development Index
This is a list of countries by inequality-adjusted Human Development Index (IHDI), as published by the UNDP in its 2022 Human Development Report. According to the 2016 Report, "The IHDI can be interpreted as the level of human development when inequality is accounted for," whereas the Human Development Index itself, from which the IHDI is derived, is "an index of potential human development (or the maximum IHDI that could be achieved if there were no inequality)."[1][2]
.svg.png.webp)
|
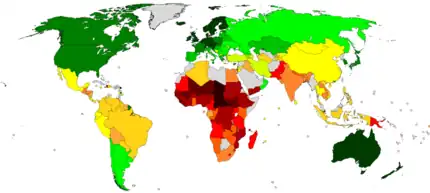
0.800–1.000 (very high)
0.700–0.799 (high)
0.550–0.699 (medium) |
0.350–0.549 (low)
Data unavailable |
|
0.850–0.899
0.800–0.849
0.750–0.799
0.700–0.749
0.650–0.699 |
0.600–0.649
0.550–0.599
0.500–0.549
0.450–0.499
0.400–0.449 |
0.350–0.399
0.300–0.349
0.250–0.299
0.200–0.249
Data unavailable |
Methodology
The index captures the HDI of the average person in society, which is less than the aggregate HDI when there is inequality in the distribution of health, education and income. Under perfect equality, the HDI and IHDI are equal; the greater the difference between the two, the greater the inequality.
The IHDI, estimated for the world and 150 specific countries, captures the losses in human development due to inequality in health, education and income. Losses in all three dimensions vary across countries, ranging from just a few percent (Czech Republic, Slovenia) up to over 40% (Comoros, Central African Republic). Overall loss takes into account all three dimensions.[3]
List
The table below ranks countries according to their inequality-adjusted human development index (IHDI). Data is based on 2021 estimates.
2021 inequality-adjusted HDI (IHDI) (2022 report)
| Rank | Country | 2021 estimates (2022 report)[4][5] | |||
|---|---|---|---|---|---|
| IHDI | HDI | Overall loss (%) due to inequality | Change since 2012 | ||
| 1 | 0.915 | 0.959 | 4.6 | | |
| 2 | 0.908 | 0.961 | 5.5 | | |
| 3 | 0.898 | 0.948 | 5.3 | | |
| 4 | 0.894 | 0.962 | 7.1 | | |
| 5 | 0.890 | 0.940 | 5.3 | | |
| 6 | 0.886 | 0.945 | 6.2 | | |
| 7 | 0.885 | 0.947 | 6.5 | | |
| 8 | 0.883 | 0.942 | 6.3 | | |
| 9 | 0.878 | 0.941 | 6.7 | | |
| 10 | 0.878 | 0.918 | 4.4 | | |
| 11 | 0.876 | 0.951 | 7.9 | | |
| 12 | 0.874 | 0.937 | 6.7 | | |
| 13 | 0.865 | 0.937 | 7.7 | | |
| 14 | 0.860 | 0.936 | 8.1 | | |
| 15 | 0.851 | 0.916 | 7.1 | | |
| 16 | 0.850 | 0.889 | 4.4 | | |
| 16 | 0.850 | 0.925 | 8.1 | | |
| 16 | 0.850 | 0.930 | 8.6 | | |
| 16 | 0.850 | 0.929 | 8.5 | | |
| 20 | 0.849 | 0.918 | 7.5 | | |
| 21 | 0.838 | 0.925 | 9.4 | | |
| 22 | 0.829 | 0.890 | 6.9 | | |
| 23 | 0.828 | 0.952 | 13.0 | | |
| 24 | 0.825 | 0.903 | 8.6 | | |
| 25 | 0.819 | 0.896 | 8.6 | | |
| 25 | 0.819 | 0.921 | 11.1 | | |
| 27 | 0.817 | 0.939 | 13.0 | | |
| 28 | 0.816 | 0.876 | 6.8 | | |
| 29 | 0.815 | 0.919 | 11.3 | | |
| 30 | 0.803 | 0.848 | 5.3 | | |
| 31 | 0.800 | 0.875 | 8.6 | | |
| 32 | 0.797 | 0.858 | 7.1 | | |
| 33 | 0.792 | 0.846 | 6.4 | | |
| 33 | 0.792 | 0.863 | 8.2 | | |
| 35 | 0.791 | 0.887 | 10.8 | | |
| 35 | 0.791 | 0.895 | 11.6 | | |
| 37 | 0.788 | 0.905 | 12.9 | | |
| 38 | 0.773 | 0.866 | 10.7 | | |
| 39 | 0.765 | 0.808 | 5.3 | | |
| 40 | 0.756 | 0.832 | 9.1 | | |
| 41 | 0.755 | 0.811 | 6.9 | | |
| 42 | 0.751 | 0.822 | 8.6 | | |
| 43 | 0.733 | 0.821 | 10.7 | | |
| 44 | 0.726 | 0.773 | 6.1 | | |
| 45 | 0.722 | 0.855 | 15.6 | | |
| 46 | 0.720 | 0.842 | 14.5 | | |
| 46 | 0.720 | 0.802 | 10.2 | | |
| 48 | 0.717 | 0.838 | 14.4 | | |
| 49 | 0.711 | 0.767 | 7.3 | | |
| 50 | 0.710 | 0.796 | 10.8 | | |
| 50 | 0.710 | 0.809 | 12.2 | | |
| 52 | 0.708 | 0.816 | 13.2 | | |
| 53 | 0.706 | 0.802 | 12.0 | | |
| 54 | 0.701 | 0.795 | 11.8 | | |
| 55 | 0.688 | 0.759 | 9.4 | | |
| 56 | 0.686 | 0.774 | 11.4 | | |
| 56 | 0.686 | 0.770 | 10.9 | | |
| 56 | 0.686 | 0.800 | 14.3 | | |
| 59 | 0.685 | 0.745 | 8.1 | | |
| 60 | 0.677 | 0.780 | 13.2 | | |
| 61 | 0.676 | 0.782 | 13.6 | | |
| 62 | 0.666 | 0.802 | 17.0 | | |
| 62 | 0.666 | 0.745 | 10.6 | N/A | |
| 64 | 0.664 | 0.809 | 17.9 | | |
| 65 | 0.661 | 0.785 | 15.8 | N/A | |
| 66 | 0.657 | 0.790 | 16.8 | | |
| 67 | 0.651 | 0.768 | 15.2 | | |
| 68 | 0.644 | 0.739 | 12.9 | | |
| 69 | 0.640 | 0.805 | 20.5 | | |
| 70 | 0.635 | 0.762 | 16.7 | | |
| 71 | 0.627 | 0.692 | 9.4 | | |
| 72 | 0.621 | 0.758 | 18.1 | | |
| 73 | 0.619 | 0.745 | 16.9 | | |
| 74 | 0.618 | 0.767 | 19.4 | | |
| 75 | 0.617 | 0.720 | 14.3 | | |
| 76 | 0.613 | 0.707 | 13.3 | N/A | |
| 77 | 0.604 | 0.740 | 18.4 | | |
| 78 | 0.602 | 0.703 | 14.4 | | |
| 79 | 0.599 | 0.685 | 12.6 | | |
| 80 | 0.598 | 0.745 | 19.7 | | |
| 81 | 0.594 | 0.747 | 20.5 | | |
| 82 | 0.592 | 0.691 | 14.3 | | |
| 83 | 0.591 | 0.714 | 17.2 | | |
| 83 | 0.591 | 0.709 | 16.6 | | |
| — | World | 0.590 | 0.732 | 19.4 | |
| 85 | 0.589 | 0.752 | 21.7 | | |
| 86 | 0.588 | 0.731 | 19.6 | | |
| 87 | 0.585 | 0.705 | 17.0 | | |
| 88 | 0.584 | 0.715 | 18.3 | | |
| 89 | 0.582 | 0.717 | 18.8 | | |
| 90 | 0.576 | 0.754 | 23.6 | | |
| 91 | 0.574 | 0.699 | 17.9 | | |
| 92 | 0.559 | 0.715 | 21.8 | | |
| 93 | 0.554 | 0.706 | 21.5 | | |
| 93 | 0.554 | 0.686 | 19.2 | | |
| 95 | 0.549 | 0.692 | 20.7 | | |
| 96 | 0.548 | 0.675 | 18.8 | | |
| 97 | 0.541 | 0.641 | 15.6 | | |
| 98 | 0.535 | 0.683 | 21.7 | | |
| 99 | 0.532 | 0.730 | 27.1 | | |
| 100 | 0.519 | 0.731 | 29.0 | | |
| 101 | 0.516 | 0.624 | 17.3 | | |
| 101 | 0.516 | 0.667 | 22.6 | | |
| 103 | 0.504 | 0.683 | 26.2 | | |
| 104 | 0.503 | 0.661 | 23.9 | | |
| 104 | 0.503 | 0.618 | 18.6 | | |
| 106 | 0.479 | 0.593 | 19.2 | | |
| 106 | 0.479 | 0.621 | 22.9 | | |
| 108 | 0.475 | 0.633 | 25.0 | | |
| 109 | 0.471 | 0.666 | 29.3 | | |
| 109 | 0.471 | 0.713 | 33.9 | | |
| 111 | 0.460 | 0.627 | 26.6 | | |
| 112 | 0.459 | 0.607 | 24.4 | | |
| 113 | 0.458 | 0.632 | 27.5 | | |
| 113 | 0.458 | 0.593 | 22.8 | | |
| 115 | 0.449 | 0.602 | 25.4 | | |
| 116 | 0.440 | 0.607 | 27.5 | | |
| 117 | 0.432 | 0.571 | 24.3 | | |
| 118 | 0.426 | 0.575 | 25.9 | | |
| 119 | 0.424 | 0.597 | 29.0 | | |
| 120 | 0.418 | 0.549 | 23.9 | | |
| 121 | 0.407 | 0.586 | 30.5 | | |
| 122 | 0.402 | 0.615 | 34.6 | | |
| 122 | 0.402 | 0.534 | 24.7 | | |
| 124 | 0.397 | 0.558 | 28.9 | | |
| 125 | 0.396 | 0.525 | 24.6 | | |
| 126 | 0.393 | 0.576 | 31.8 | | |
| 127 | 0.390 | 0.565 | 31.0 | | |
| 128 | 0.389 | 0.556 | 30.0 | | |
| 129 | 0.380 | 0.544 | 30.1 | | |
| 130 | 0.377 | 0.512 | 26.4 | | |
| 131 | 0.372 | 0.514 | 27.6 | | |
| 131 | 0.372 | 0.539 | 31.0 | | |
| 133 | 0.367 | 0.501 | 26.7 | | |
| 134 | 0.363 | 0.498 | 27.1 | | |
| 135 | 0.358 | 0.550 | 34.9 | | |
| 136 | 0.354 | 0.511 | 30.7 | | |
| 137 | 0.348 | 0.500 | 30.4 | | |
| 138 | 0.341 | 0.479 | 28.8 | | |
| 138 | 0.341 | 0.535 | 36.3 | | |
| 140 | 0.336 | 0.508 | 33.9 | | |
| 141 | 0.334 | 0.525 | 36.4 | | |
| 142 | 0.330 | 0.481 | 31.4 | | |
| 143 | 0.327 | 0.535 | 38.9 | | |
| 144 | 0.315 | 0.449 | 29.8 | | |
| 145 | 0.310 | 0.558 | 44.4 | | |
| 146 | 0.309 | 0.477 | 35.2 | | |
| 147 | 0.307 | 0.455 | 32.5 | | |
| 148 | 0.306 | 0.483 | 36.6 | | |
| 149 | 0.302 | 0.426 | 29.1 | | |
| 150 | 0.300 | 0.446 | 32.7 | | |
| 151 | 0.299 | 0.465 | 35.7 | | |
| 152 | 0.292 | 0.400 | 27.0 | | |
| 153 | 0.291 | 0.428 | 32.0 | | |
| 154 | 0.251 | 0.394 | 36.3 | | |
| 155 | 0.245 | 0.385 | 36.4 | | |
| 156 | 0.240 | 0.404 | 40.6 | | |
See also
- List of countries by Human Development Index
- List of countries by planetary pressures–adjusted Human Development Index
- List of countries by income equality
- List of countries by share of income of the richest one percent
- Social Progress Index
- Economic inequality
- Median income
- Per capita income
- Poverty
- Social inequality
- Welfare's effect on poverty
- Human Development Report
Notes
- Since 2013
- Since 2014
- Since 2016
- Since 2011
- Since 2010
- Since 2015
References
- Human Development Reports, Composite indices — HDI and beyond (2015) 87
- "Inequality-adjusted Human Development Index (IHDI)". Hdr.undp.org. Retrieved 2010-11-05.
- "Frequently Asked Questions - Inequality-adjusted Human Development Index (IHDI)". United Nations.
- "Download IHDI dataset". hdr.undp.org. UNDP. Retrieved 13 September 2022.
- "All composite indices and components time series (1990-2021)". hdr.undp.org. UNDP. Retrieved 13 September 2022.
External links
Economic classification of countries | |||||
|---|---|---|---|---|---|
| Three-World Model | |||||
| Gross domestic product (GDP) |
| ||||
| Gross national income (GNI) | |||||
| Wages | |||||
| Wealth | |||||
| Other national accounts | |||||
| Human development | |||||
| Digital divide | |||||
| Net international investment position (NIIP) | |||||