United States presidential elections in Oklahoma

Following is a table of United States presidential elections in Oklahoma, ordered by year. Since its admission to statehood in 1907, Oklahoma has participated in every U.S. presidential election.
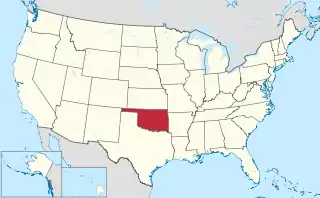
Presidential elections in Oklahoma
Map of the United States with Oklahoma highlighted
Number of elections29
Voted Democratic10
Voted Republican19
Voted other0
Voted for winning candidate20
Voted for losing candidate9

Winners of the state are in bold. The shading refers to the state winner, and not the national winner.

Year Winner (nationally) Votes Percent Runner-up (nationally) Votes Percent Other national
candidates[lower-alpha 1]
Votes Percent Electoral
Votes
Notes
2020[1]Joe Biden503,89032.29Donald Trump1,020,28065.377
2016[2]Donald Trump[lower-alpha 2]949,13665.32Hillary Clinton420,37528.937
2012[3]Barack Obama443,54733.23Mitt Romney891,32566.77 7
2008[4]Barack Obama502,49634.35John McCain960,16565.65 7
2004[5]George W. Bush959,79265.57John Kerry503,96634.43 7
2000[6]George W. Bush[lower-alpha 2]744,33760.31Al Gore474,27638.43 8
1996[7]Bill Clinton488,10540.45Bob Dole582,31548.26Ross Perot130,78810.848
1992Bill Clinton473,06634.02George H. W. Bush592,92942.65Ross Perot319,87823.018
1988George H. W. Bush678,36757.93Michael Dukakis483,42341.28 8
1984Ronald Reagan861,53068.61Walter Mondale385,08030.67 8
1980Ronald Reagan695,57060.5Jimmy Carter402,02634.97John B. Anderson38,2843.338
1976Jimmy Carter532,44248.75Gerald Ford545,70849.96 8
1972Richard Nixon759,02573.7George McGovern247,14724 8
1968Richard Nixon449,69747.68Hubert Humphrey301,65831.99George Wallace191,73120.338
1964Lyndon B. Johnson519,83455.75Barry Goldwater412,66544.25 8
1960John F. Kennedy370,11140.98Richard Nixon533,03959.02 8Nixon received 7 electoral votes; one faithless elector voted for Harry F. Byrd.[8]
1956Dwight D. Eisenhower473,76955.13Adlai Stevenson II385,58144.87T. Coleman Andrews/
Unpledged Electors[lower-alpha 3]
8
1952Dwight D. Eisenhower518,04554.59Adlai Stevenson II430,93945.41 8
1948Harry S. Truman452,78262.75Thomas E. Dewey268,81737.25Strom Thurmond 10
1944Franklin D. Roosevelt401,54955.57Thomas E. Dewey319,42444.2 10
1940Franklin D. Roosevelt474,31357.41Wendell Willkie348,87242.23 11
1936Franklin D. Roosevelt501,06966.83Alf Landon245,12232.69 11
1932Franklin D. Roosevelt516,46873.3Herbert Hoover188,16526.7 11
1928Herbert Hoover394,04663.72Al Smith219,17435.44 10
1924Calvin Coolidge226,24242.82John W. Davis255,79848.41Robert M. La Follette46,3758.7810
1920Warren G. Harding243,83150.11James M. Cox217,05344.61Parley P. Christensen 10
1916Woodrow Wilson148,11350.59Charles E. Hughes97,23333.21 10
1912Woodrow Wilson119,15646.95Theodore Roosevelt William H. Taft90,78635.7710Roosevelt was not on the ballot
1908William H. Taft110,47443.33William Jennings Bryan122,36347.99 7

See also

Notes

  1. For purposes of these lists, other national candidates are defined as those who won at least one electoral vote, or won at least ten percent of the vote in multiple states.
  2. Won the electoral college while losing the popular vote
  3. Was allied with a slate of unpledged electors in Louisiana, Mississippi and South Carolina

References

  1. "OK Election Results". results.okelections.us. Retrieved 13 November 2020.
  2. 2016 official Federal Election Commission report.
  3. 2012 official Federal Election Commission report.
  4. 2008 official Federal Election Commission report.
  5. "Federal Elections 2004: Election Results for the U.S. President, the U.S. Senate and the U.S. House of Representatives" (PDF). Federal Elections Commission. May 2005.
  6. "2000 Presidential Election Statistics". Dave Leip’s Atlas of U.S. Presidential Elections.
  7. "1996 Presidential Election Statistics". Dave Leip’s Atlas of U.S. Presidential Elections. Retrieved 2018-03-05.
  8. "1960 Presidential Election". 270 to win. Retrieved 20 September 2016.
This article is issued from Wikipedia. The text is licensed under Creative Commons - Attribution - Sharealike. Additional terms may apply for the media files.