X
wikiHow is a “wiki,” similar to Wikipedia, which means that many of our articles are co-written by multiple authors. To create this article, 14 people, some anonymous, worked to edit and improve it over time.
This article has been viewed 74,248 times.
Learn more...
There are many ways to graph a line: plugging in points, calculating the slope and y-intercept of a line, using a graphing calculator, etc. This article will teach you how to graph a line using intercepts.
Steps
-
1Linear equations will always have two variables, the independent variable and the dependent variable. Identify both. For the sake of clarity, let the independent be x and the dependent be y.[1]
-
2Set x to zero.[2]Advertisement
-
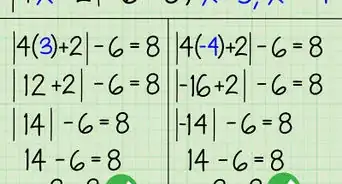
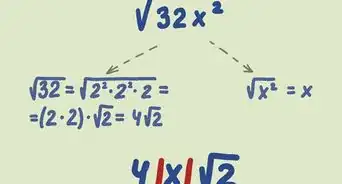
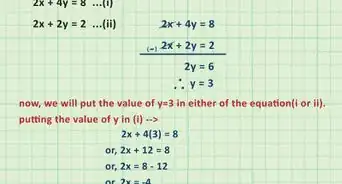
3Solve like a normal equation. This will generate a coordinate for your y-intercept. First, substitute x to zero. Then, subtract the product from both sides of the equation. Note that the operation you will perform with both sides depends on the sign of your number. In this case the number is zero so we will use its opposite, subtraction. After that, divide three from both sides. And, VOILA! You have the answer.[3]
-
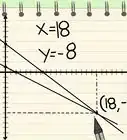
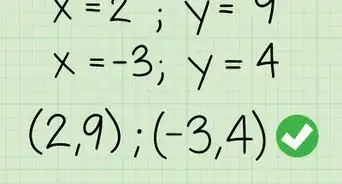
4Put your value in a coordinate pair. (x,y) Since x=0, your coordinate pair will be similar to: (0,y).
-
5Graph the point on a coordinate plane.[4]
-
6Repeat steps 2-5, setting y=0 and solving for x. Again, since you set y=0, your coordinate pair will look something like: (x,0).
-
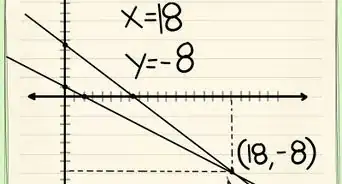
7Take a straightedge and connect the two points.[5]


Advertisement
Community Q&A
-
QuestionDo we need to figure an equation out before knowing to change the x or y to 0, or can I change either/or in any equation?
 Elena HimmerichCommunity AnswerYou do need an equation to figure out an x- or y-intercept, but it doesn't need to be in any specific form. For example, you could just as easily change a variable to zero in a standard form equation as you could in a point-slope form equation.
 -
QuestionWhat if there is something attached to the equation? (E.g. y/2 = 10-4x)
 TechnistCommunity AnswerYou can convert that into a linear equation like the one shown in the article. y/2 is the same as (1/2)y, so the coefficient is 1/2. You can also add 4x to both sides so that the equation is now 4x + (1/2)y = 10 and use the method shown in the article. By substituting 0 into x and then y, we get the intercepts (0, 20) and (5/2, 0). (Note: 5/2 = 2.5 so it doesn't matter which one you end up with.) You can then plot those two points and draw a straight line through both.
 -
QuestionCan we take other values of x and y in table?DonaganTop AnswererYes. A straight line is defined by two points. So if you're simply trying to graph a straight line, you can use any two pairs of coordinates (from the table) to find two points on the line. If, however, you want to use the intercepts method shown above, you would need to set either x or y equal to zero as shown in the article.
Advertisement
Warnings
Advertisement
References
- ↑ https://2012books.lardbucket.org/books/beginning-algebra/s06-03-graph-using-intercepts.html
- ↑ https://math.libretexts.org/Bookshelves/Algebra/Beginning_Algebra/03%3A_Graphing_Lines/3.03%3A_Graph_Using_Intercepts
- ↑ https://2012books.lardbucket.org/books/beginning-algebra/s06-03-graph-using-intercepts.html
- ↑ https://www.chilimath.com/lessons/intermediate-algebra/graph-a-line-using-x-and-y-intercepts/
- ↑ https://pressbooks.bccampus.ca/algebraintermediate/chapter/graph-linear-equations-in-two-variables/
- ↑ https://pressbooks.bccampus.ca/algebraintermediate/chapter/graph-linear-equations-in-two-variables/
- ↑ https://www.eduplace.com/math/mathsteps/4/c/index.html
About This Article
Advertisement