This article was co-authored by wikiHow Staff. Our trained team of editors and researchers validate articles for accuracy and comprehensiveness. wikiHow's Content Management Team carefully monitors the work from our editorial staff to ensure that each article is backed by trusted research and meets our high quality standards.
This article has been viewed 57,260 times.
Learn more...
The familiar rectangular grid is an easy system to learn, but it is not convenient in all situations. What if you want to plot the spokes on a wheel, or the movement of water down a drain? In these cases, a circular coordinate system is a more natural fit. In fact, you've already used the basic idea of polar coordinates in everyday life.[1] If you're locating the source of a siren, for example, you need two piece of information: how far away it is, and which direction the sound is coming from. The polar coordinate system maps points the same way, describing the distance from a fixed point, and the angle from a fixed ray.
Steps
Plotting Polar Coordinates
-
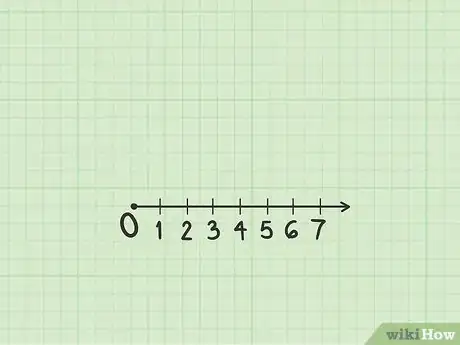
1Set up the polar plane. You've probably graphed points with Cartesian coordinates before, using notation to mark locations on a rectangular grid. Polar coordinates use a different kind of graph instead, based on circles:[2]
- The center point of the graph (or "origin" in a rectangular grid) is the pole. You can label this with the letter O.
- Starting from the pole, draw a horizontal line to the right. This is the polar axis. Label the axis with units as you would the positive x-axis on a rectangular grid.
- If you have special polar graph paper, it will include many circles of different sizes, all centered on the pole. You do not have to draw these yourself if using blank paper.
-
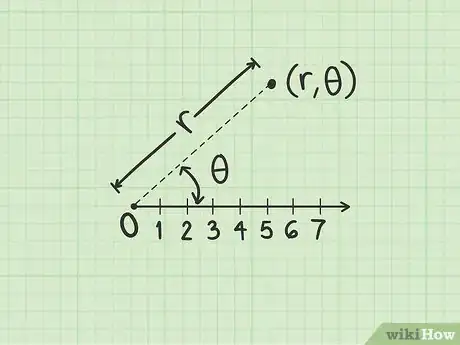
2Understand polar coordinates. On the polar plane, a point is represented by a coordinate in the form :
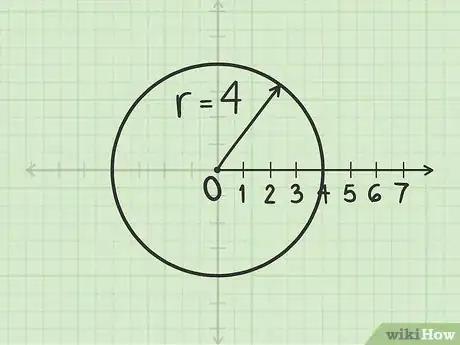
- The first variable, , stands for radius. The point is located on a circle with radius , centered on the pole (origin).
- The second variable, , represents an angle. The point is located along a line that passes through the pole and forms an angle with the polar axis.
Advertisement -
3Review the unit circle. In polar coordinates, the angle is usually measured in radians instead of degrees. In this system, one full rotation (360º or a full circle) covers an angle of 2 radians. (This value is chosen because a circle with radius 1 has a circumference of 2.) Familiarizing yourself with the unit circle will make working with polar coordinates much easier.
- If your textbook uses degrees, you don't need to worry about this for now. It is possible to plot polar points using degree values for .
Plotting a Point
-
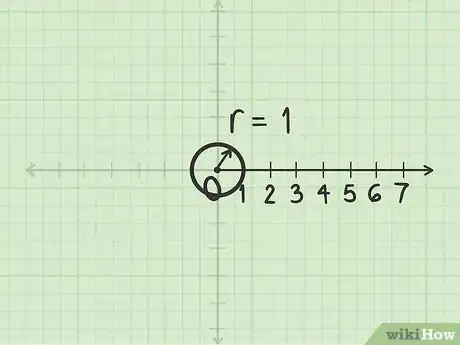
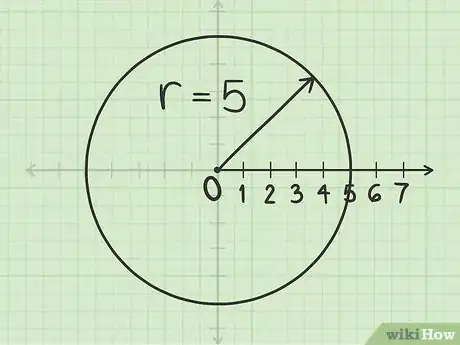
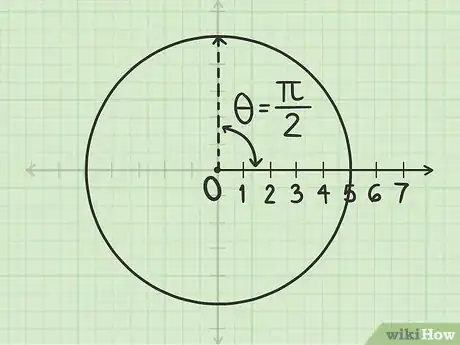
1Construct a circle with radius . Any point has polar coordinates in the form . Begin by drawing a circle with radius , centred on the pole.
- The pole is the center point of the graph, where the origin is on the rectangular coordinate plane.
- For example, to plot the point , place your compass on the pole. Extend the pencil end of the compass to 5 units along the polar axis. Rotate the compass to draw a circle.
-
2Measure an angle of from the polar axis. Place a protractor so the center is on the pole, and the edge runs along the polar axis. Measure the angle from this axis. If the angle is in radians and your protractor only shows degrees, you can convert the units or refer to the unit circle for help.
- For the point , the unit circle tells you that is ¼ of the way around the circle, equivalent to 90 degrees from the polar axis.
- Always measure positive angles counter-clockwise from the axis. Measure negative angles clockwise from the axis.
-
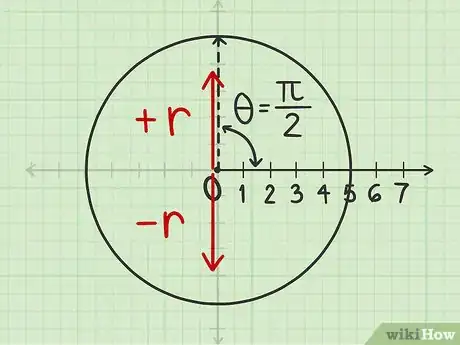
3Draw a line based on the sign of . The next step will be to draw a line along the angle you measured. Before you can do this, however, you need to know which way to draw the line. Refer back to the polar coordinates to find out:
- If is positive, draw the line "forward", from the pole straight through the angle marking you just made.
- If is negative, draw the line "backward": from the angle marking back through the pole, to intersect the circle on the opposite side.
- Don't be confused by rectangular coordinates: this does not correspond to positive or negative values on an x- or y- axis.
-
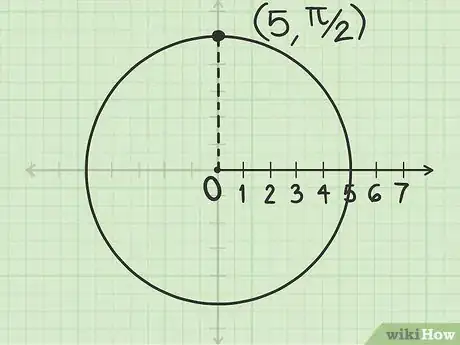
4Label the point where the line and circle meet. This is the point .
- The point is located on a circle with radius 5 centered on the pole, ¼ of the way along the circle's circumference in a counter-clockwise direction from the polar axis. (This point is equivalent to (0, 5) in rectangular coordinates.)
Examples
First Example
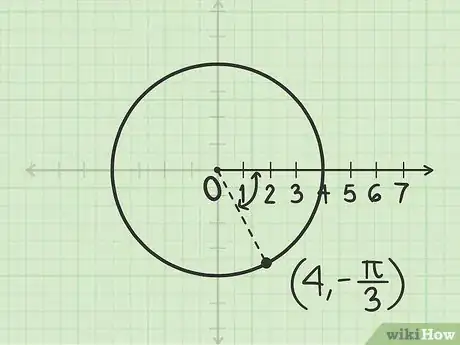
Plot the point P located at on the polar plane
-
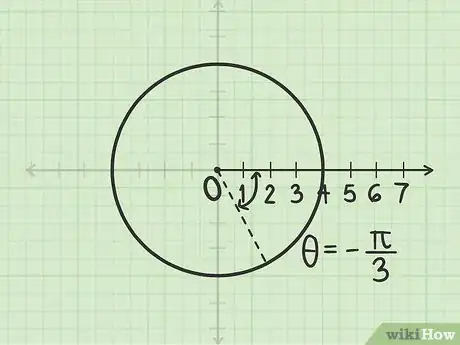
1Construct a circle with radius . Use the pole as its centre.
-
2Measure the angle radians. Measure this angle from the polar axis (equivalent to the positive x-axis). Since the angle is negative, measure this angle in a clockwise direction.
-
3Draw a line at this angle. Start at the pole (origin). Since the radius is positive, move forward from the pole through the angle you measured. The point where the line intersects the circle is .
Second Example
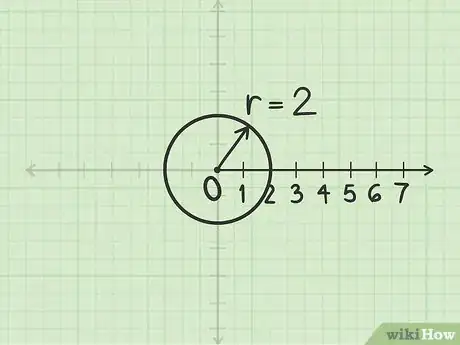
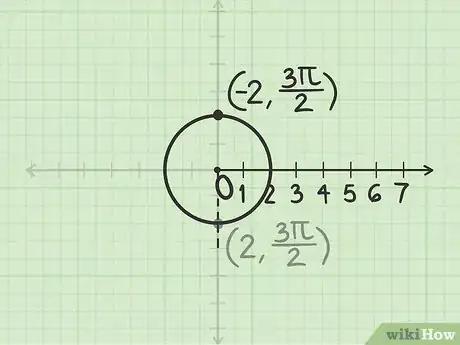
Plot the point Q located at on the polar plane.
-
1Construct a circle with radius . Use the pole as its centre. Although the radius is actually -2, the sign is not important for this step.
-
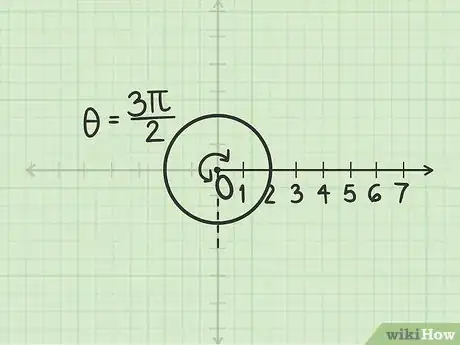
2Measure the angle radians. Since the angle is positive, you must go counter-clockwise from the polar axis.
-
3Construct a line opposite that angle. Since the radius is negative, you must go from the pole in the opposite direction of the given angle. The point where the line intersects the circle is .
Converting Cartesian Coordinates to Polar Coordinates
-
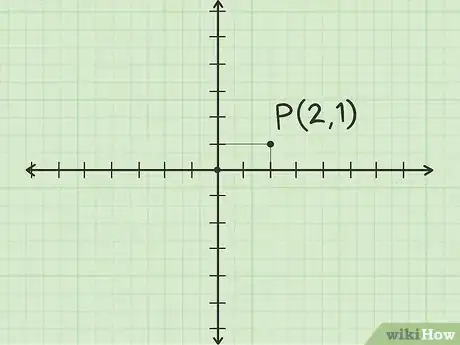
1Consider the point in the Cartesian plane. Starting at the origin, draw a line segment 2 units along the positive x-axis. Draw a second line segment from that point 1 unit in the positive y direction. You are now at point (2, 1), so label this point P.
-
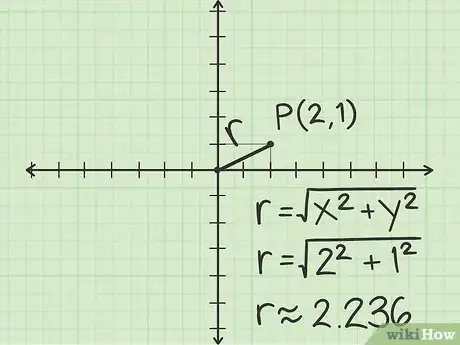
2Find the distance between the origin and . Draw a line between O and P. This line has length in polar coordinates. It is also the hypotenuse of a right triangle, so you can find the hypotenuse's length using geometry. For example:
- The legs of this right triangle have values of 2 and 1.
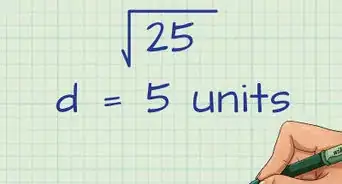
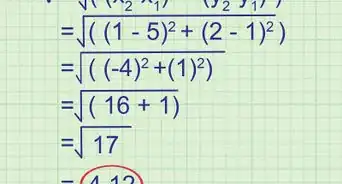
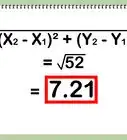
- With the Pythagorean theorem, calculate that the hypotenuse's length is .
- The general formula to find from Cartesian coordinates is , where is the Cartesian x-coordinate and the Cartesian y-coordinate.
-
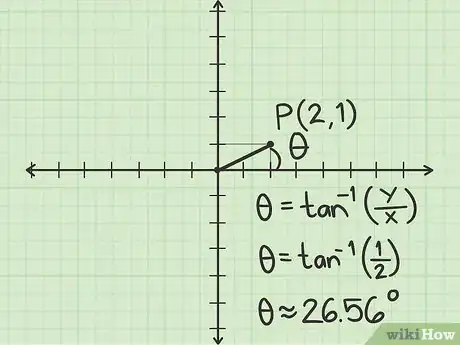
3Find the angle between and the positive x-axis. Use trigonometry to find this value:
-
- The general formula to find is , where is the Cartesian y-coordinate and the Cartesian x-coordinate.
-
-
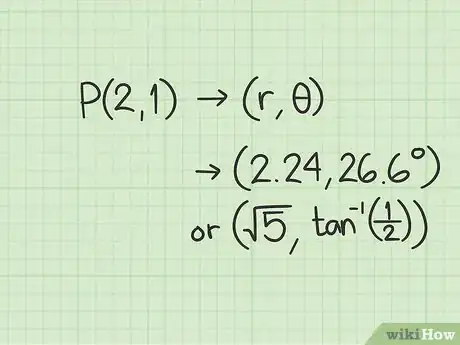
4Write down the polar coordinates. You now have the values of and . The rectangular coordinates (2, 1) convert to approximate polar coordinates of (2.24, 26.6º), or exact coordinates of .
Community Q&A
-
QuestionHow can I calculate a vector in 3D?
 Community AnswerVectors in 3D are represented using the x, y, and z axes. You can find their intersections and lengths just like you would in 2D vectors.
Things You'll Need
- Paper
- Pencil
- Drawing compass
- Protractor
References
About This Article
To plot polar coordinates, set up the polar plane by drawing a dot labeled “O” on your graph at your point of origin. Draw a horizontal line to the right to set up the polar axis. When you look at the polar coordinate, the first number is the radius of a circle. To plot the coordinate, draw a circle centered on point O with that radius. The second coordinate is an angle. Use a protractor to draw a line that intersects point O at that angle. The point where the circle and the angled line meet is the polar coordinate. To learn what direction to draw your line, keep reading!


