1999 European Parliament election in Ireland
The 1999 European Parliament election in Ireland was the Irish component of the 1999 European Parliament election. The election was conducted under the single transferable vote.
| |||||||||||||||||||||||||||||||||||||||||||||||||||||||||||||||||||||||||||||||||||||||||
15 seats to the European Parliament | |||||||||||||||||||||||||||||||||||||||||||||||||||||||||||||||||||||||||||||||||||||||||
|---|---|---|---|---|---|---|---|---|---|---|---|---|---|---|---|---|---|---|---|---|---|---|---|---|---|---|---|---|---|---|---|---|---|---|---|---|---|---|---|---|---|---|---|---|---|---|---|---|---|---|---|---|---|---|---|---|---|---|---|---|---|---|---|---|---|---|---|---|---|---|---|---|---|---|---|---|---|---|---|---|---|---|---|---|---|---|---|---|---|
| Turnout | 50.2% | ||||||||||||||||||||||||||||||||||||||||||||||||||||||||||||||||||||||||||||||||||||||||
| |||||||||||||||||||||||||||||||||||||||||||||||||||||||||||||||||||||||||||||||||||||||||
| Members of the European Parliament for Ireland | |
|---|---|
| 1st delegation | (1973) |
| 2nd delegation | (1973–1977) |
| 3rd delegation | (1977–1979) |
| 1st term | (1979) |
| 2nd term | (1984) |
| 3rd term | (1989) |
| 4th term | (1994) |
| 5th term | (1999) |
| 6th term | (2004) |
| 7th term | (2009) |
| 8th term | (2014) |
| 9th term | (2019) |
| 10th term | (2024) |
| List of women MEPs | |
Results
| Party | European party | Party Leader | 1st Pref Vote | % | ±% | Seats | ± | |
|---|---|---|---|---|---|---|---|---|
| Fianna Fáil | UEN | Bertie Ahern | 537,757 | 38.6 | +3.6 | 6 | −1 | |
| Fine Gael | EPP-ED | John Bruton | 342,171 | 24.6 | +0.3 | 4 | ±0 | |
| Green Party | Greens/EFA | none | 93,100 | 6.7 | −1.2 | 2 | ±0 | |
| Labour Party | PES | Ruairi Quinn | 121,542 | 8.7 | −2.3 | 1 | ±0 | |
| Sinn Féin | Gerry Adams | 88,165 | 6.3 | +3.3 | 0 | ±0 | ||
| Socialist Party | Joe Higgins | 10,619 | 0.8 | +0.8 | 0 | ±0 | ||
| Independent | 198,386 | 14.3 | +7.4 | 2 | +1 | |||
| Total | 1,391,740 | 100 | — | 15 | — | |||
MEPs elected
Voting details

1979–2004 European Parliament Ireland constituencies
| Constituency | Electorate | Turnout | Spoilt | Valid Poll | Quota | Seats | Candidates |
|---|---|---|---|---|---|---|---|
| Connacht–Ulster | 541,552 | 332,236 (61.3%) | 12,085 (3.6%) | 320,151 | 80,038 | 3 | 11 |
| Dublin | 793,200 | 286,684 (36.1%) | 6,013 (2.1%) | 280,671 | 56,135 | 4 | 13 |
| Leinster | 706,200 | 357,064 (50.5%) | 14,725 (4.1%) | 342,339 | 68,468 | 4 | 8 |
| Munster | 823,008 | 462,303 (56.2%) | 13,724 (2.9%) | 448,579 | 89,716 | 4 | 10 |
| Total | 2,864,361 | 1,438,287 (50.2%) | 46,547 (3.2%) | 1,391,740 | — | 15 | 42 |
See also
- List of members of the European Parliament for Ireland, 1999–2004 – List ordered by constituency
External links
Footnotes
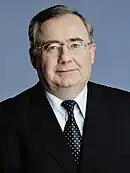
- Pictured here is Pat Cox, one of two successful Independent candidates in this election. Cox would become leader of the ELDR group in the European parliament between 1998 and 2002.
References
This article is issued from Wikipedia. The text is licensed under Creative Commons - Attribution - Sharealike. Additional terms may apply for the media files.
.jpg.webp)
.jpg.webp)
.jpg.webp)

.jpg.webp)