Demographics of Kuwait
This is a demography of the population of Kuwait (Arabic: سكان الكويت).
| Demographics of Kuwait | |
|---|---|
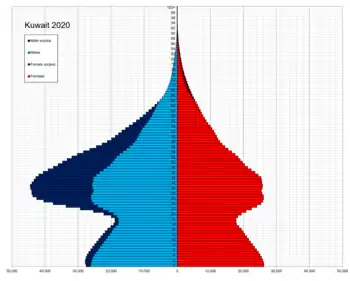 Population pyramid of Kuwait in 2020 | |
| Population | 3,068,155 (2022 est.) |
| Growth rate | 1.17% (2022 est.) |
| Birth rate | 17.78 births/1,000 population (2022 est.) |
| Death rate | 2.25 deaths/1,000 population (2022 est.) |
| Life expectancy | 79.13 years |
| • male | 77.67 years |
| • female | 80.65 years |
| Fertility rate | 2.24 children born/woman (2022 est.) |
| Infant mortality rate | 7.43 deaths/1,000 live births |
| Net migration rate | -3.87 migrant(s)/1,000 population (2022 est.) |
| Age structure | |
| 0–14 years | 19.49% |
| 15–64 years | 76.71% |
| 65 and over | 3.80% |
| Sex ratio | |
| Total | 1.37 male(s)/female (2022 est.) |
| At birth | 1.05 male(s)/female |
| Under 15 | 1.09 male(s)/female |
| 65 and over | 0.66 male(s)/female |
| Nationality | |
| Nationality | Kuwaiti |
| Language | |
| Official | Arabic |

Expatriates account for around 60% of Kuwait's total population, with Kuwaitis constituting 38%-42% of the total population. The government and some Kuwaiti citizens consider the proportion of expatriates (which has been relatively stable since the mid-1970s) to be a problem, and in 2016 the number of deportations increased.[1]
Governorates
Kuwait consists of six governorates: Hawalli, Asimah, Farwaniyah, Jahra, Ahmadi and Mubarak Al-Kabeer.[2] Most people in Kuwait live in the governorates of Hawalli, Asimah, and Farwaniyah.[2]
Historical populations
| Year | Pop. | ±% |
|---|---|---|
| 1950 | 152,000 | — |
| 1960 | 264,000 | +73.7% |
| 1970 | 753,000 | +185.2% |
| 1980 | 1,377,000 | +82.9% |
| 1990 | 2,088,000 | +51.6% |
| 2000 | 1,941,000 | −7.0% |
| 2010 | 2,737,000 | +41.0% |
| 2020 | 4,464,000 | +63.1% |
| Source:[3] | ||
| Census year | Kuwaiti | non-Kuwaiti | Total | Change | ||||
|---|---|---|---|---|---|---|---|---|
| Population | % | Population | % | Population | % | |||
| 1975 | 307,755 | 30.9 | 687,082 | 69 | 994,837 | - | ||
| 1985 | 470,473 | 35 | 1,226,828 | 65 | 1,697,301 | 70.6 | ||
| 1995 | 653,616 | 41.5 | 921,954 | 58.5 | 1,575,570 | -7.2 | ||
| 2005 | 860,324 | 39.2 | 1,333,327 | 60.8 | 2,193,651 | 39.2 | ||
| 2015 | 1,208,643 | 32.3 | 2,535,017 | 67.7 | 3,743,660 | 70.6 | ||
The biggest population difficulty in Kuwait involves the Bedoon, stateless people. According to Human Rights Watch in 1995, Kuwait has produced 300,000 stateless Bedoon.[4] Kuwait has the largest number of stateless people in the entire region.[5][6][7] The Bedoon issue in Kuwait is largely sectarian.[8][9][10][11][12]
Vital statistics
- UN estimates
| Period | Live births per year | Deaths per year | Natural change per year | CBR* | CDR* | NC* | TFR* | IMR* |
|---|---|---|---|---|---|---|---|---|
| 1950-1955 | 8,000 | 2,000 | 6,000 | 43.7 | 12.3 | 31.4 | 7.21 | 113 |
| 1955-1960 | 9,000 | 2,000 | 7,000 | 40.0 | 9.6 | 30.4 | 7.21 | 90 |
| 1960-1965 | 16,000 | 3,000 | 13,000 | 43.4 | 7.6 | 35.8 | 7.31 | 70 |
| 1965-1970 | 30,000 | 4,000 | 26,000 | 48.8 | 6.3 | 42.5 | 7.41 | 53 |
| 1970-1975 | 43,000 | 5,000 | 38,000 | 47.6 | 5.2 | 42.4 | 6.90 | 40 |
| 1975-1980 | 49,000 | 5,000 | 44,000 | 40.7 | 4.2 | 36.5 | 5.89 | 29 |
| 1980-1985 | 58,000 | 5,000 | 52,000 | 37.1 | 3.4 | 33.6 | 5.10 | 22 |
| 1985-1990 | 51,000 | 5,000 | 45,000 | 26.5 | 2.8 | 23.7 | 3.34 | 16 |
| 1990-1995 | 33,000 | 5,000 | 28,000 | 18.0 | 2.7 | 15.3 | 2.20 | 13 |
| 1995-2000 | 43,000 | 5,000 | 38,000 | 24.1 | 3.0 | 21.1 | 2.93 | 11 |
| 2000-2005 | 39,000 | 6,000 | 32,000 | 18.5 | 3.1 | 15.4 | 2.24 | 10 |
| 2005-2010 | 47,000 | 7,000 | 40,000 | 18.7 | 3.1 | 15.6 | 2.32 | 8 |
| 2010-2015 | 58,000 | 9,000 | 49,000 | 16.1 | 2.4 | 13.7 | 2.08 | 8 |
| 2015-2020 | 60,000 | 12,000 | 48,000 | 12.6 | 2.9 | 9.7 | 2.07 | 7 |
| * CBR = crude birth rate (per 1000); CDR = crude death rate (per 1000); NC = natural change (per 1000); IMR = infant mortality rate per 1000 births; TFR = total fertility rate (number of children per woman) | ||||||||
- Registered births and deaths
| Average population | Live births | Deaths | Natural change | Crude birth rate (per 1000) | Crude death rate (per 1000) | Natural change (per 1000) | TFR | |
|---|---|---|---|---|---|---|---|---|
| 1958 | 6,881 | |||||||
| 1959 | 9,023 | |||||||
| 1960 | 11,616 | 1,235 | 10,381 | |||||
| 1961 | 296,000 | 12,942 | 2,504 | 10,438 | 43.7 | 8.4 | 35.2 | |
| 1962 | 337,000 | 15,204 | 2,180 | 13,024 | 45.1 | 6.5 | 38.6 | |
| 1963 | 384,000 | 17,397 | 2,139 | 15,258 | 45.4 | 5.6 | 39.8 | |
| 1964 | 433,000 | 19,428 | 2,618 | 16,810 | 44.8 | 6.0 | 38.8 | |
| 1965 | 484,000 | 21,950 | 2,454 | 19,496 | 45.3 | 5.1 | 40.3 | |
| 1966 | 536,000 | 23,732 | 2,813 | 20,919 | 44.3 | 5.3 | 39.0 | |
| 1967 | 588,000 | 28,334 | 3,111 | 25,223 | 48.2 | 5.3 | 42.9 | |
| 1968 | 642,000 | 33,026 | 3,346 | 29,680 | 51.5 | 5.2 | 46.3 | |
| 1969 | 697,000 | 35,135 | 3,378 | 31,757 | 50.4 | 4.8 | 45.6 | |
| 1970 | 753,000 | 33,842 | 3,735 | 30,107 | 44.9 | 5.0 | 40.0 | |
| 1971 | 811,000 | 35,558 | 3,832 | 31,726 | 43.8 | 4.7 | 39.1 | |
| 1972 | 870,000 | 37,688 | 4,149 | 33,539 | 43.3 | 4.8 | 38.5 | |
| 1973 | 931,000 | 40,165 | 4,601 | 35,564 | 43.2 | 4.9 | 38.2 | |
| 1974 | 992,000 | 41,060 | 4,693 | 36,367 | 41.4 | 4.7 | 36.7 | |
| 1975 | 1,054,000 | 42,861 | 4,778 | 38,083 | 40.7 | 4.5 | 36.1 | |
| 1976 | 1,116,000 | 46,039 | 4,661 | 41,378 | 41.3 | 4.2 | 37.1 | |
| 1977 | 1,179,000 | 46,864 | 5,365 | 41,499 | 39.8 | 4.6 | 35.2 | |
| 1978 | 1,243,000 | 48,010 | 4,936 | 43,074 | 38.6 | 4.0 | 34.7 | |
| 1979 | 1,309,000 | 48,273 | 5,028 | 43,245 | 36.9 | 3.8 | 33.0 | |
| 1980 | 1,377,000 | 51,090 | 4,932 | 46,158 | 37.1 | 3.6 | 33.5 | |
| 1981 | 1,446,000 | 52,041 | 4,678 | 47,363 | 36.0 | 3.2 | 32.8 | |
| 1982 | 1,514,000 | 54,257 | 4,992 | 49,265 | 35.8 | 3.3 | 32.5 | |
| 1983 | 1,584,000 | 55,617 | 4,654 | 50,963 | 35.1 | 2.9 | 32.2 | |
| 1984 | 1,660,000 | 56,776 | 4,544 | 52,232 | 34.2 | 2.7 | 31.5 | |
| 1985 | 1,742,000 | 55,087 | 4,711 | 50,376 | 31.6 | 2.7 | 28.9 | |
| 1986 | 1,836,000 | 53,845 | 4,390 | 49,455 | 29.3 | 2.4 | 26.9 | |
| 1987 | 1,937,000 | 52,412 | 4,113 | 48,299 | 27.1 | 2.1 | 24.9 | |
| 1988 | 2,028,000 | 53,080 | 4,581 | 48,499 | 26.2 | 2.3 | 23.9 | |
| 1989 | 2,084,000 | 52,858 | 4,628 | 48,230 | 25.4 | 2.2 | 23.1 | |
| 1990 | 2,088,000 | |||||||
| 1991 | 2,031,000 | 20,609 | 3,380 | 17,229 | 10.1 | 1.7 | 8.5 | |
| 1992 | 1,924,000 | 34,817 | 3,369 | 31,448 | 18.1 | 1.8 | 16.3 | |
| 1993 | 1,796,000 | 37,379 | 3,441 | 33,938 | 20.8 | 1.9 | 18.9 | |
| 1994 | 1,688,000 | 38,868 | 3,464 | 35,404 | 23.0 | 2.1 | 21.0 | |
| 1995 | 1,628,000 | 41,169 | 3,781 | 37,388 | 25.3 | 2.3 | 23.0 | |
| 1996 | 1,628,000 | 44,620 | 3,812 | 40,808 | 27.4 | 2.3 | 25.1 | |
| 1997 | 1,679,000 | 42,815 | 4,017 | 38,798 | 25.5 | 2.4 | 23.1 | |
| 1998 | 1,764,000 | 41,424 | 4,216 | 37,208 | 23.5 | 2.4 | 21.1 | |
| 1999 | 1,857,000 | 41,135 | 4,187 | 36,948 | 22.1 | 2.3 | 19.9 | |
| 2000 | 1,941,000 | 41,843 | 4,227 | 37,616 | 21.6 | 2.2 | 19.4 | |
| 2001 | 2,010,000 | 41,342 | 4,364 | 36,978 | 20.6 | 2.2 | 18.4 | |
| 2002 | 2,070,000 | 43,490 | 4,342 | 39,148 | 21.0 | 2.1 | 18.9 | |
| 2003 | 2,127,000 | 43,982 | 4,424 | 39,558 | 20.7 | 2.1 | 18.6 | |
| 2004 | 2,189,000 | 47,274 | 4,793 | 42,481 | 21.6 | 2.2 | 19.4 | |
| 2005 | 2,264,000 | 50,941 | 4,784 | 46,157 | 22.5 | 2.1 | 20.4 | |
| 2006 | 2,351,000 | 52,759 | 5,247 | 47,512 | 22.4 | 2.2 | 20.2 | |
| 2007 | 2,448,000 | 53,587 | 5,293 | 48,294 | 21.9 | 2.2 | 19.7 | |
| 2008 | 2,548,000 | 54,571 | 5,701 | 48,870 | 21.4 | 2.2 | 19.2 | |
| 2009 | 2,778,000 | 56,503 | 6,266 | 50,237 | 20.3 | 2.3 | 18.1 | |
| 2010 | 2,933,000 | 57,533 | 5,448 | 52,085 | 19.6 | 1.9 | 17.8 | |
| 2011 | 3,099,000 | 58,198 | 5,339 | 52,859 | 18.7 | 1.7 | 17.0 | 1.95 |
| 2012 | 3,246,622 | 59,753 | 5,950 | 53,803 | 18.4 | 1.8 | 16.6 | 1.86 |
| 2013 | 3,427,595 | 59,426 | 5,909 | 53,517 | 17.3 | 1.7 | 15.6 | 1.72 |
| 2014 | 3,588,092 | 61,313 | 6,031 | 55,282 | 16.3 | 1.6 | 14.7 | 1.90 |
| 2015 | 3,743,660 | 59,271 | 6,481 | 52,790 | 14.9 | 1.6 | 13.3 | |
| 2016 | 3,925,487 | 58,797 | 6,338 | 52,459 | 14.4 | 1.5 | 12.9 | 1.47 |
| 2017 | 4,082,704 | 59,172 | 6,679 | 52,493 | 14.7 | 1.7 | 13.0 | 2.15 |
| 2018 | 4,226,920 | 56,121 | 6,807 | 49,314 | 13.6 | 1.7 | 11.9 | 2.161 |
| 2019 | 4,420,110 | 53,565 | 7,306 | 46,259 | 12.1 | 1.6 | 10.4 | 2.082 |
| 2020 | 4,464,521 | 52,463 | 10,569 | 41,894 | 11.7 | 2.4 | 9.3 | 2.033 |
| 2021 | 4,336,012 | 51,585 | 10,938 | 40,647 | 11.9 | 2.5 | 9.4 | 2.148 |
| 2022 | 4,385,717 | 49,793 | 8,041 | 41,752 | 10.9 | 1.8 | 9.1 | 1.546 |
| 2023 | 4,793,568 |
Structure of the population
Structure of the population (1.01.2020) (Census - provisional):[16]
| Age Group | Male | Female | Total | % |
|---|---|---|---|---|
| Total | 2,743,617 | 1,720,904 | 4,464,521 | 100 |
| 0-4 | 123,863 | 111,800 | 235,663 | 5,27 |
| 5-9 | 190,736 | 153,412 | 344,148 | 7,7 |
| 10-14 | 160,820 | 129,882 | 290,702 | 6,51 |
| 15-19 | 135,324 | 111,798 | 247,122 | 5,53 |
| 20-24 | 126,687 | 102,773 | 229,460 | 5,13 |
| 25-29 | 113,416 | 93,183 | 206,599 | 4,62 |
| 30-34 | 205,555 | 157,101 | 362,656 | 8,12 |
| 35-39 | 341,766 | 192,989 | 534,755 | 11,97 |
| 40-44 | 368,779 | 180,249 | 549,028 | 12,29 |
| 45-49 | 342,307 | 165,443 | 507,750 | 11,37 |
| 50-54 | 234,060 | 112,764 | 346,824 | 7,76 |
| 55-59 | 158,989 | 76,976 | 235,965 | 5,28 |
| 60-64 | 105,746 | 46,617 | 152,363 | 3,41 |
| 65-69 | 59,345 | 27,921 | 87,266 | 1,95 |
| 70-74 | 26,885 | 15,982 | 42,867 | 0,96 |
| 75-79 | 11,984 | 8,711 | 20,695 | 0,46 |
| 80+ | 10,839 | 7,912 | 18,751 | 0,42 |
| Age group | Male | Female | Total | Percent |
| 0-14 | 475,419 | 395,094 | 870,513 | 19,49 |
| 15-64 | 2,132,629 | 1,239,893 | 3,372,522 | 75,54 |
| 65+ | 109,053 | 60,526 | 169,579 | 3,80 |
Life expectancy

| Period | Life expectancy in Years |
Period | Life expectancy in Years |
|---|---|---|---|
| 1950–1955 | 53.6 | 1985–1990 | 71.6 |
| 1955–1960 | 58.3 | 1990–1995 | 72.4 |
| 1960–1965 | 62.0 | 1995–2000 | 73.0 |
| 1965–1970 | 64.9 | 2000–2005 | 73.3 |
| 1970–1975 | 67.1 | 2005–2010 | 73.7 |
| 1975–1980 | 68.7 | 2010–2015 | 74.3 |
| 1980–1985 | 70.3 | 2015–2020 | 75.1 |
Source: UN World Population Prospects[17]
- Ethnic groups[18]
- Kuwaiti 41.4%, Arab expat 21.4%, Asian (mostly South Asian) 35.3%, African 1%, other 0.7% (includes European, North American, South American, and Australian) (2018 est.)
- Languages[18]
- Religion[18]
- Muslim (official) 74.6%
- Christian 18.2%
- Other and Unspecified 7.2%
See also
References
- "Kuwait steps up deportations of expat workers". 29 April 2016. Retrieved 24 October 2018.
- "2013 Population Census". Government of Kuwait. 2013. Archived from the original on 2014-03-13. Retrieved 2013-12-04.
- World Population Prospects: The 2010 Revision Archived February 28, 2013, at the Wayback Machine
- "THE BEDOONS OF KUWAIT Citizens without Citizenship". Human Rights Watch.
- "Kuwait's humanitarian disaster Inter-generational erasure, ethnic cleansing and genocide of the Bedoon". OHCHR. 2019.
- "No Dignity for Kuwait's 'Humanitarian' State - Kuwaiti's Laws and Policies of Ethnic Discrimination, Erasure and Genocide Against The Bedoon Minority Submission on 'Human Rights Protections for Minorities Recognised in the UN System'". Susan Kennedy Nour al Deen. 2020.
- "Kuwait Bedoon - Special Rapporteurs, United Nations, Requesting Investigation of Kuwait's Treatment of the Bedoon". Un Special Procedures Request. January 2019.
- "Government of United Kingdom".
"The Kuwaiti Bedoon`s continued exclusion from nationality can only be understood in the light of the power struggle in a system which was largely based on sectarianism and tribalism within newly emerging emirates striving to assert their legitimacy and authority. The majority of the Bedoon are in fact an extended branch of tribes across the borders between Iraq, Iran, Syria and Saudi Arabia and are largely of the Muslim Shi'ite faith".
- "State formation of Kuwait" (PDF). p. 83.
- "Exploring the perceptions of informed individuals about the education provisions of Bidoun in Kuwait". p. 13.
- Eman Shams Aldeen (September 19, 2012). "البدون فــي الكويـــت.. مواطنون بلا هوية". As-Safir Al-Arabi (in Arabic).
- "כוויית: עושר רב לצד מתחים אתניים ודיכוי". Israel Hayom (in Hebrew).
- "World Population Prospects: The 2010 Revision". Retrieved 24 October 2018.
- United nations. Demographic Yearbooks
- Archived 2013-03-09 at the Wayback Machine Central Statistical Bureau
- "United Nations Statistics Division - Demographic and Social Statistics". Archived from the original on 2004-09-21. Retrieved 2013-05-11.
- "World Population Prospects – Population Division – United Nations". Retrieved 2017-07-15.
- "Middle East ::KUWAIT". CIA The World Factbook. 6 October 2022.
| Religions | |
|---|---|
| Foreign nationals | |
| From Asia | ||
|---|---|---|

| Sovereign states |
|
|---|---|
| States with limited recognition | |
| Dependencies and other territories |
|
| |