Lybrook, New Mexico
Lybrook is an unincorporated community and census-designated place (CDP) in Rio Arriba County, New Mexico, United States. It was first listed as a CDP prior to the 2020 census.[3]
Lybrook, New Mexico | |
|---|---|
 Lybrook  Lybrook | |
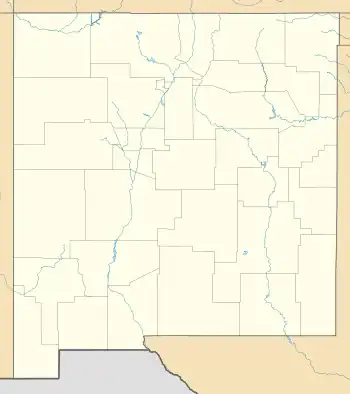
| Coordinates: 36°13′59″N 107°33′39″W | |
| Country | United States |
| State | New Mexico |
| County | Rio Arriba |
| Area | |
| • Total | 3.89 sq mi (10.07 km2) |
| • Land | 3.88 sq mi (10.05 km2) |
| • Water | 0.01 sq mi (0.01 km2) |
| Elevation | 7,240 ft (2,210 m) |
| Population | |
| • Total | 19 |
| • Density | 4.90/sq mi (1.89/km2) |
| Time zone | UTC-7 (Mountain (MST)) |
| • Summer (DST) | UTC-6 (MDT) |
| ZIP Code | 87013 (Cuba) |
| Area code | 575 |
| FIPS code | 35-45635 |
| GNIS feature ID | 2806742[3] |
The CDP is in the southwest corner of the county, bordered to the south by Sandoval County. U.S. Route 550 passes through the center of the community, leading northwest 48 miles (77 km) to Bloomfield and southeast 40 miles (64 km) to Cuba.
Climate
According to the Köppen Climate Classification system, Lybrook has a cold semi-arid climate, abbreviated "BSk" on climate maps. The hottest temperature recorded in Lybrook was 100 °F (37.8 °C) on July 22, 1952, while the coldest temperature recorded was −28 °F (−33.3 °C) on January 7, 1971.[5]
| Climate data for Lybrook, New Mexico, 1991–2020 normals, extremes 1951–2011 | |||||||||||||
|---|---|---|---|---|---|---|---|---|---|---|---|---|---|
| Month | Jan | Feb | Mar | Apr | May | Jun | Jul | Aug | Sep | Oct | Nov | Dec | Year |
| Record high °F (°C) | 61 (16) |
67 (19) |
73 (23) |
86 (30) |
91 (33) |
97 (36) |
100 (38) |
97 (36) |
89 (32) |
86 (30) |
77 (25) |
65 (18) |
100 (38) |
| Mean maximum °F (°C) | 51.8 (11.0) |
56.5 (13.6) |
65.7 (18.7) |
72.8 (22.7) |
81.1 (27.3) |
88.6 (31.4) |
91.4 (33.0) |
88.6 (31.4) |
83.7 (28.7) |
73.9 (23.3) |
63.2 (17.3) |
52.8 (11.6) |
92.2 (33.4) |
| Average high °F (°C) | 38.7 (3.7) |
43.8 (6.6) |
52.8 (11.6) |
60.2 (15.7) |
69.8 (21.0) |
81.3 (27.4) |
84.1 (28.9) |
81.4 (27.4) |
74.8 (23.8) |
62.6 (17.0) |
49.2 (9.6) |
39.2 (4.0) |
61.5 (16.4) |
| Daily mean °F (°C) | 27.5 (−2.5) |
32.0 (0.0) |
39.7 (4.3) |
46.6 (8.1) |
55.8 (13.2) |
66.7 (19.3) |
70.2 (21.2) |
67.9 (19.9) |
61.4 (16.3) |
49.5 (9.7) |
37.0 (2.8) |
27.4 (−2.6) |
48.5 (9.1) |
| Average low °F (°C) | 16.3 (−8.7) |
20.3 (−6.5) |
26.5 (−3.1) |
33.0 (0.6) |
41.7 (5.4) |
52.1 (11.2) |
56.3 (13.5) |
54.4 (12.4) |
48.0 (8.9) |
36.5 (2.5) |
24.7 (−4.1) |
15.5 (−9.2) |
35.4 (1.9) |
| Mean minimum °F (°C) | 1.3 (−17.1) |
4.8 (−15.1) |
13.7 (−10.2) |
21.5 (−5.8) |
29.5 (−1.4) |
37.9 (3.3) |
47.9 (8.8) |
45.9 (7.7) |
35.4 (1.9) |
22.7 (−5.2) |
9.6 (−12.4) |
0.8 (−17.3) |
−3.7 (−19.8) |
| Record low °F (°C) | −28 (−33) |
−18 (−28) |
0 (−18) |
4 (−16) |
18 (−8) |
24 (−4) |
36 (2) |
34 (1) |
26 (−3) |
11 (−12) |
−3 (−19) |
−18 (−28) |
−28 (−33) |
| Average precipitation inches (mm) | 0.84 (21) |
0.52 (13) |
0.33 (8.4) |
0.58 (15) |
0.86 (22) |
0.52 (13) |
1.48 (38) |
1.97 (50) |
1.32 (34) |
0.86 (22) |
0.49 (12) |
0.59 (15) |
10.36 (263.4) |
| Average snowfall inches (cm) | 5.9 (15) |
2.9 (7.4) |
1.4 (3.6) |
1.3 (3.3) |
0.1 (0.25) |
0.0 (0.0) |
0.0 (0.0) |
0.0 (0.0) |
0.0 (0.0) |
0.6 (1.5) |
1.0 (2.5) |
3.7 (9.4) |
16.9 (42.95) |
| Average precipitation days (≥ 0.01 in) | 4.6 | 4.8 | 3.1 | 3.6 | 2.7 | 2.5 | 5.3 | 7.4 | 4.3 | 3.8 | 2.3 | 3.4 | 47.8 |
| Average snowy days (≥ 0.1 in) | 3.3 | 2.5 | 1.5 | 1.1 | 0.1 | 0.0 | 0.0 | 0.0 | 0.0 | 0.4 | 0.9 | 2.9 | 12.7 |
| Source 1: NOAA[6] | |||||||||||||
| Source 2: XMACIS2 (mean maxima/minima 1981–2010)[5] | |||||||||||||
References
- "ArcGIS REST Services Directory". United States Census Bureau. Retrieved October 12, 2022.
- "Census Population API". United States Census Bureau. Retrieved October 12, 2022.
- "Lybrook Census Designated Place". Geographic Names Information System. United States Geological Survey, United States Department of the Interior.
- "Census of Population and Housing". Census.gov. Retrieved June 4, 2016.
- "xmACIS2". National Oceanic and Atmospheric Administration. Retrieved April 13, 2023.
- "U.S. Climate Normals Quick Access – Station: Lybrook, NM". National Oceanic and Atmospheric Administration. Retrieved April 13, 2023.
Municipalities and communities of Rio Arriba County, New Mexico, United States | ||
|---|---|---|
| City | 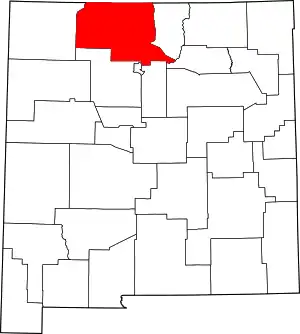 Map of New Mexico highlighting Rio Arriba County | |
| Village | ||
| CDPs |
| |
| Other communities | ||
| Ghost towns and former settlements | ||
| Indian reservations | ||
| Footnotes | ‡This populated place also has portions in an adjacent county or counties | |
This article is issued from Wikipedia. The text is licensed under Creative Commons - Attribution - Sharealike. Additional terms may apply for the media files.