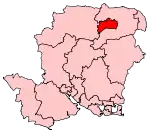
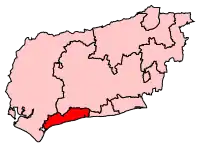
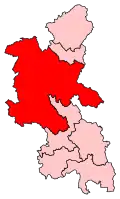
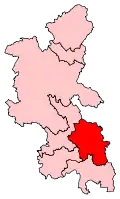
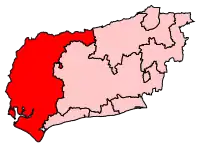
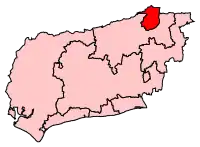
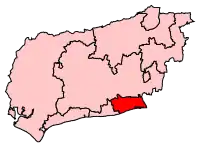
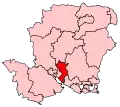
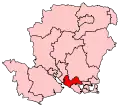
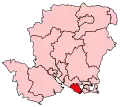
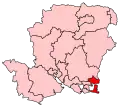
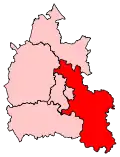
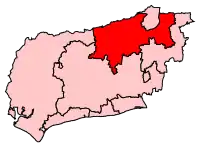
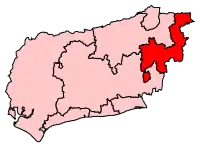
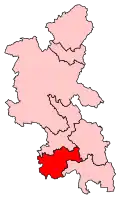
Parliamentary constituencies in South East England
The region[1] of South East England is divided into 84 parliamentary constituencies, which are made up of 23 borough constituencies and 61 county constituencies. Since the general election of December 2019,[2] 73 are represented by Conservative MPs, 8 by Labour MPs, 2 by Liberal Democrat MPs, and 1 by a Green MP.
Constituencies
† Conservative # Independent ‡ Labour ¤ Liberal Democrat ♣ Green Party
Proposed boundary changes
See 2023 Periodic Review of Westminster constituencies for further details.
Following the abandonment of the Sixth Periodic Review (the 2018 review), the Boundary Commission for England formally launched the 2023 Review on 5 January 2021. The Commission calculated that the number of seats to be allocated to the South East region will increase by 7 from 84 to 91.[5] This includes the Isle of Wight which will have two protected seats, compared to one at present. Initial proposals were published on 8 June 2021 and, following two periods of public consultation, revised proposals were published on 8 November 2022. The final proposals were published on 28 June 2023.
Under proposals, the following constituencies for the region will come into effect at the next general election:[6]
| Constituency | Electorate | Ceremonial county | Local authority |
|---|---|---|---|
| Aldershot BC | 76,765 | Hampshire | Hart / Rushmoor |
| Arundel and South Downs CC | 76,974 | West Sussex | Arun / Chichester / Horsham |
| Ashford CC | 73,546 | Kent | Ashford / Folkestone and Hythe |
| Aylesbury CC | 75,636 | Buckinghamshire | Buckinghamshire |
| Banbury CC | 69,943 | Oxfordshire | Cherwell / West Oxfordshire |
| Basingstoke BC | 77,050 | Hampshire | Basingstoke and Deane |
| Beaconsfield CC | 72,315 | Buckinghamshire | Buckinghamshire |
| Bexhill and Battle CC | 70,869 | East Sussex | Rother / Wealden |
| Bicester and Woodstock CC | 70,389 | Oxfordshire | Cherwell / West Oxfordshire |
| Bognor Regis and Littlehampton CC | 76,985 | West Sussex | Arun |
| Bracknell BC | 70,247 | Berkshire | Bracknell Forest |
| Brighton Kemptown and Peacehaven BC | 69,865 | East Sussex | Brighton and Hove / Lewes |
| Brighton Pavilion BC | 75,722 | East Sussex | Brighton and Hove |
| Buckingham and Bletchley CC | 73,644 | Buckinghamshire | Buckinghamshire / Milton Keynes |
| Canterbury CC | 75,499 | Kent | Canterbury |
| Chatham and Aylesford CC | 74,840 | Kent | Medway / Tonbridge and Malling |
| Chesham and Amersham CC | 74,155 | Buckinghamshire | Buckinghamshire |
| Chichester CC | 76,785 | West Sussex | Arun / Chichester |
| Crawley BC | 74,446 | West Sussex | Crawley |
| Dartford CC | 72,048 | Kent | Dartford |
| Didcot and Wantage CC | 74,456 | Oxfordshire | South Oxfordshire / Vale of White Horse |
| Dorking and Horley CC | 70,317 | Surrey | Mole Valley / Reigate and Banstead |
| Dover and Deal CC | 75,855 | Kent | Dover |
| Earley and Woodley BC | 70,083 | Berkshire | Reading / Wokingham |
| East Grinstead and Uckfield CC | 72,356 | East Sussex / West Sussex | Lewes / Mid Sussex / Wealden |
| East Hampshire CC | 69,959 | Hampshire | East Hampshire |
| East Surrey CC | 73,145 | Surrey | Reigate and Banstead / Tandridge |
| East Thanet BC | 73,790 | Kent | Thanet |
| East Worthing and Shoreham BC | 75,466 | West Sussex | Adur / Worthing |
| Eastbourne BC | 73,322 | East Sussex | Eastbourne |
| Eastleigh BC | 69,982 | Hampshire | Eastleigh / Test Valley |
| Epsom and Ewell BC | 76,844 | Surrey | Epsom and Ewell / Mole Valley |
| Esher and Walton BC | 73,280 | Surrey | Elmbridge |
| Fareham and Waterlooville CC | 77,036 | Hampshire | Fareham / Havant / Winchester |
| Farnham and Bordon CC | 72,938 | Hampshire / Surrey | East Hampshire / Waverley |
| Faversham and Mid Kent CC | 71,798 | Kent | Maidstone / Swale |
| Folkestone and Hythe CC | 70,023 | Kent | Folkestone and Hythe |
| Gillingham and Rainham BC | 73,951 | Kent | Medway |
| Godalming and Ash CC | 71,399 | Surrey | Guildford / Waverley |
| Gosport BC | 73,763 | Hampshire | Fareham / Gosport |
| Gravesham CC | 72,866 | Kent | Gravesham |
| Guildford CC | 71,367 | Surrey | Guildford |
| Hamble Valley CC | 76,902 | Hampshire | Eastleigh / Fareham / Winchester |
| Hastings and Rye CC | 75,581 | East Sussex | Hastings / Rother |
| Havant BC | 72,766 | Hampshire | Havant |
| Henley and Thame CC | 70,626 | Oxfordshire | South Oxfordshire |
| Herne Bay and Sandwich CC | 76,028 | Kent | Canterbury / Dover / Thanet |
| Horsham CC | 76,981 | West Sussex | Horsham |
| Hove and Portslade BC | 73,726 | East Sussex | Brighton and Hove |
| Isle of Wight East CC | 56,805 | Isle of Wight | Isle of Wight |
| Isle of Wight West CC | 54,911 | Isle of Wight | Isle of Wight |
| Lewes CC | 75,091 | East Sussex | Lewes / Wealden |
| Maidenhead CC | 73,463 | Berkshire | Bracknell Forest / Windsor and Maidenhead |
| Maidstone and Malling CC | 73,084 | Kent | Maidstone / Tonbridge and Malling |
| Mid Buckinghamshire CC | 72,240 | Buckinghamshire | Buckinghamshire |
| Mid Sussex CC | 72,255 | West Sussex | Mid Sussex |
| Milton Keynes North CC | 70,620 | Buckinghamshire | Milton Keynes |
| Milton Keynes Central BC | 76,708 | Buckinghamshire | Milton Keynes |
| New Forest East CC | 73,823 | Hampshire | New Forest |
| New Forest West CC | 71,009 | Hampshire | New Forest |
| Newbury CC | 71,631 | Berkshire | West Berkshire |
| North East Hampshire CC | 73,306 | Hampshire | Basingstoke and Deane / Hart |
| North West Hampshire CC | 76,004 | Hampshire | Basingstoke and Deane / Test Valley |
| Oxford East BC | 72,731 | Oxfordshire | Oxford |
| Oxford West and Abingdon CC | 72,004 | Oxfordshire | Oxford / Vale of White Horse |
| Portsmouth North BC | 71,844 | Hampshire | Portsmouth |
| Portsmouth South BC | 74,253 | Hampshire | Portsmouth |
| Reading Central BC | 71,283 | Berkshire | Reading |
| Reading West and Mid Berkshire CC | 69,999 | Berkshire | Reading / West Berkshire |
| Reigate CC | 76,139 | Surrey | Reigate and Banstead |
| Rochester and Strood CC | 72,155 | Kent | Medway |
| Romsey and Southampton North CC | 73,831 | Hampshire | Southampton / Test Valley |
| Runnymede and Weybridge CC | 73,778 | Surrey | Elmbridge / Runnymede |
| Sevenoaks CC | 73,684 | Kent | Dartford / Sevenoaks |
| Sittingbourne and Sheppey CC | 76,818 | Kent | Swale |
| Slough BC | 75,287 | Berkshire | Slough |
| Southampton Itchen BC | 72,150 | Hampshire | Southampton |
| Southampton Test BC | 69,960 | Hampshire | Southampton |
| Spelthorne BC | 72,897 | Surrey | Spelthorne |
| Surrey Heath CC | 70,825 | Surrey | Guildford / Surrey Heath |
| Sussex Weald CC | 70,075 | East Sussex | Wealden |
| Tonbridge CC | 73,692 | Kent | Sevenoaks / Tonbridge and Malling |
| Tunbridge Wells CC | 75,213 | Kent | Tunbridge Wells |
| Weald of Kent CC | 70,110 | Kent | Ashford / Maidstone / Tunbridge Wells |
| Winchester CC | 76,577 | Hampshire | Winchester |
| Windsor CC | 74,338 | Berkshire / Surrey | Runnymede / Slough / Windsor and Maidenhead |
| Witney CC | 70,042 | Oxfordshire | Vale of White Horse / West Oxfordshire |
| Woking BC | 71,737 | Surrey | Woking |
| Wokingham CC | 70,235 | Berkshire | Wokingham |
| Worthing West BC | 76,293 | West Sussex | Adur / Worthing |
| Wycombe CC | 71,769 | Buckinghamshire | Buckinghamshire |
Results history
Primary data source: House of Commons research briefing - General election results from 1918 to 2019[7]
2019
The number of votes cast for each political party who fielded candidates in constituencies comprising the South East region in the 2019 general election were as follows:
| Party | Votes | % | Change from 2017 | Seats | Change from 2017 |
|---|---|---|---|---|---|
| Conservative | 2,512,866 | 54.0% | 74 | ||
| Labour | 1,029,996 | 22.1% | 8 | 0 | |
| Liberal Democrats | 848,381 | 18.2% | 1 | ||
| Greens | 183,724 | 3.9% | 1 | 0 | |
| Brexit | 12,868 | 0.3% | new | 0 | 0 |
| Others | 64,917 | 1.5% | 0 | 0 | |
| Total | 4,652,752 | 100.0 | 84 |
Percentage votes
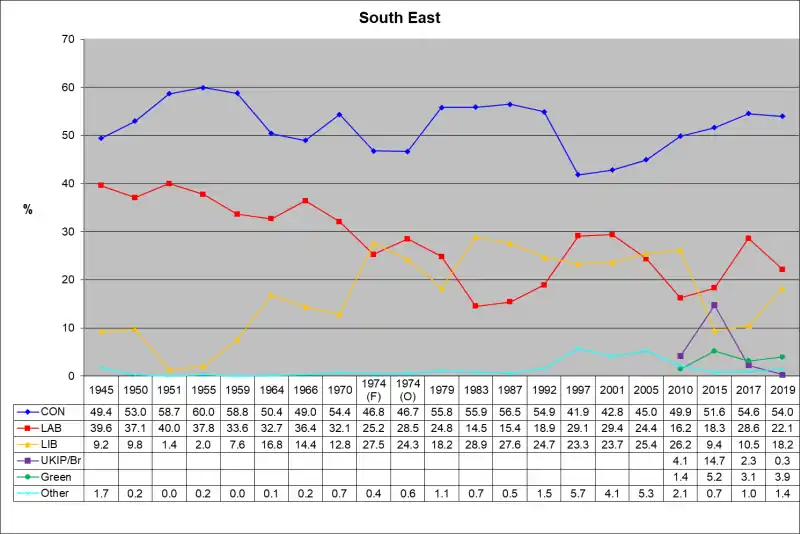
Key:
CON - Conservative Party, including National Liberal Party up to 1966
LAB - Labour Party
LIB - Liberal Party up to 1979; SDP-Liberal Alliance 1983 & 1987; Liberal Democrats from 1992
UKIP/Br - UK Independence Party 2010 to 2017 (included in Other up to 2005 and in 2019); Brexit Party in 2019
Green - Green Party of England and Wales (included in Other up to 2005)
Seats
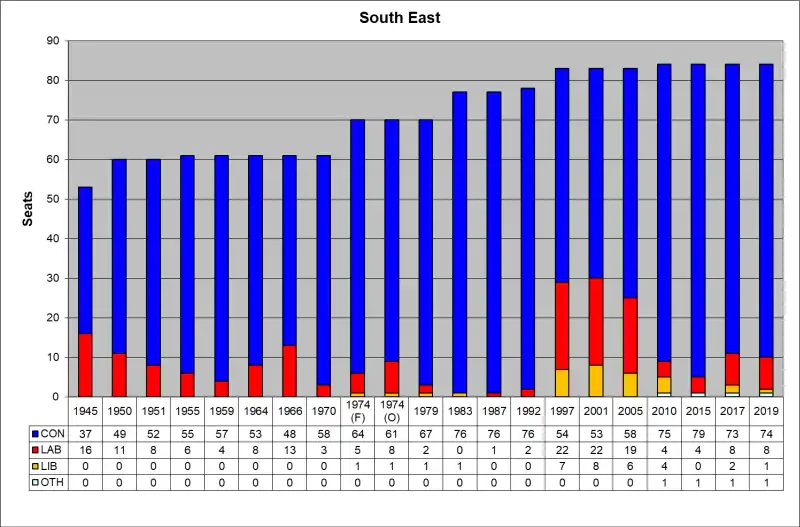
Key:
CON - Conservative Party, including National Liberal Party up to 1966 (2010-2017 - includes The Speaker, John Bercow)
LAB - Labour Party
LIB - Liberal Party up to 1979; SDP-Liberal Alliance 1983 & 1987; Liberal Democrats from 1992
OTH - 2010-2019 - Green Party
See also
- List of United Kingdom Parliament constituencies
- List of parliamentary constituencies in Berkshire
- List of parliamentary constituencies in Buckinghamshire
- List of parliamentary constituencies in East Sussex
- List of parliamentary constituencies in Hampshire
- Isle of Wight (UK Parliament constituency)
- List of parliamentary constituencies in Kent
- List of parliamentary constituencies in Oxfordshire
- List of parliamentary constituencies in Surrey
- List of parliamentary constituencies in West Sussex
Notes
- BC denotes borough constituency, CC denotes county constituency.
- The majority is the number of votes the winning candidate receives more than their nearest rival.
External links
- Politics Resources (2017 Election results)
References
- See NUTS 1 statistical regions of England
- "2019 Election Results". BBC.
- Baker, Carl; Uberoi, Elise; Cracknell, Richard (28 January 2020). "General Election 2019: full results and analysis".
{{cite journal}}: Cite journal requires|journal=(help) - "Constituencies A-Z - Election 2019". BBC News. Retrieved 26 April 2020.
- "2023 Review". Boundary Commission for England. Retrieved 8 January 2021.
- "Revised proposals for new Parliamentary constituency boundaries in the South East region | Boundary Commission for England". boundarycommissionforengland.independent.gov.uk. Retrieved 8 December 2022.
- Watson, Christopher; Uberoi, Elise; Loft, Philip (17 April 2020). "General election results from 1918 to 2019".
{{cite journal}}: Cite journal requires|journal=(help)
