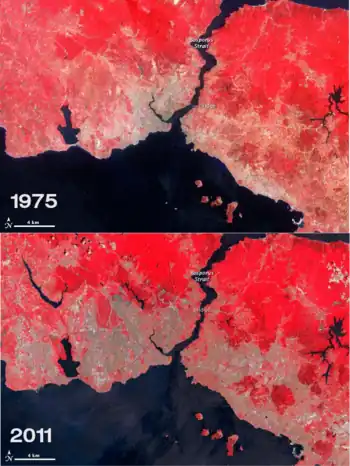
Demographics of Turkey
Demographic features of the population of Turkey include population density, ethnicity, education level, health of the populace, economic status, religious affiliations and other aspects of the population.
| Demographics of the Republic of Turkey | |
|---|---|
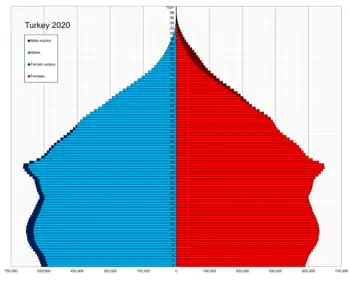 Turkey population pyramid in 2020 | |
| Population | (31 December 2022) |
| Growth rate | |
| Birth rate | population (2022) |
| Death rate | population (2022) |
| Life expectancy | |
| • male | |
| • female | |
| Fertility rate | |
| Infant mortality rate | |
| Age structure | |
| 0–14 years | |
| 15–64 years | |
| 65 and over | |
| Sex ratio | |
| Total | 0.99 male(s)/female (2021)[2] |
| At birth | 1.30 male(s)/female (2006 est.) |
| Under 15 | 1.25 male(s)/female |
| 65 and over | 1.05 male(s)/female |
| Nationality | |
| Nationality | noun: Turk(s) adjective: Turkish |
| Major ethnic | Turks |
| Language | |
| Official | Turkish |
| Spoken | See Languages of Turkey |
As of 31 December 2022, the population of Turkey was 85.2 million with a growth rate of 0.55% per annum.[3] Turks are the largest ethnic group, followed by Kurds.
The population has been quite young in recent times but is now aging, with just 22% falling in the 0–14 age bracket (down from 26.4% in 2007).[4] The population over the age of 65 is 9.9% (up from 7.1% in 2007). As of 2022, the median age of the Turkish population is 33.5 years (up from 28.3 in 2007).[5] According to OECD/World Bank population statistics, from 1990 to 2008 the population growth in Turkey was 16 million or 29%.[6]
Population
Historical population

|
|
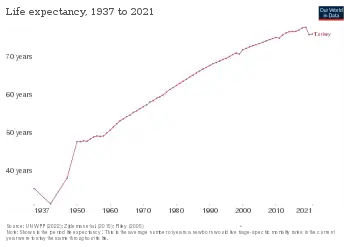
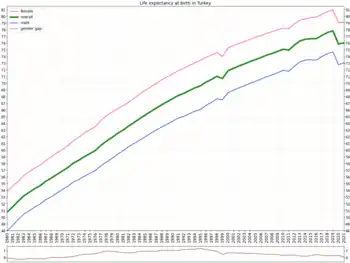
Life expectancy
| Period | Life expectancy in Years |
Period | Life expectancy in Years |
|---|---|---|---|
| 1950–1955 | 41.01 | 1985–1990 | 63.04 |
| 1955–1960 | 43.69 | 1990–1995 | 65.49 |
| 1960–1965 | 47.22 | 1995–2000 | 68.49 |
| 1965–1970 | 50.78 | 2000–2005 | 71.37 |
| 1970–1975 | 53.75 | 2005–2010 | 73.37 |
| 1975–1980 | 57.05 | 2010–2015 | 74.83 |
| 1980–1985 | 60.22 | 2015–2020 | 77.31 |
According to the CIA World Factbook, in 2019, life expectancy was 78.3 years for the total population, 75.6 years for men and 81.0 years for women.[10]
Urbanization
According to the CIA World Factbook:[11]
- Urban population: 75.1% of total population (2018)
- Rate of urbanization: 2.04% annual rate of change (2015–20 est.)
Median age
According to the CIA World Factbook:[11]
- Total population: 32.4 years
- Male: 31.7 years
- Female: 33.1 years (2019 est.)[12]
Sex ratio
According to the CIA World Factbook:[11]
- At birth: 1.05 male(s)/female
- Under 15 years: 1.05 male(s)/female
- 15–24 years: 1.04 male(s)/female
- 25–54 years: 1.03 male(s)/female
- 55–64 years: 0.99 male(s)/female
- 65 years and over: 0.8 male(s)/female
- Total population: 1.01 male(s)/female (2017 est.)
Literacy
According to the CIA World Factbook:[11] Defined as people age 15 and over who can read and write, 2016 est.
- Total population: 96.2%
- Male: 98.8%
- Female: 93.6%
Vital statistics
UN estimates
The figures from the UN Department of Economic and Social Affairs:[13]
| Period | Live births per year | Deaths per year | Natural change per year | CBR1 | CDR1 | NC1 | TFR1 | IMR1 |
|---|---|---|---|---|---|---|---|---|
| 1950–1955 | 1,127,000 | 551,000 | 677,000 | 48.4 | 18.8 | 29.6 | 6.69 | 167.4 |
| 1955–1960 | 1,216,000 | 564,000 | 752,000 | 46.9 | 18.4 | 28.5 | 6.5 | 163.9 |
| 1960–1965 | 1,277,000 | 547,000 | 799,000 | 44.3 | 17.6 | 26.7 | 6.2 | 160.5 |
| 1965–1970 | 1,343,000 | 527,000 | 792,000 | 40.3 | 16.7 | 23.6 | 5.80 | 156.9 |
| 1970–1975 | 1,451,000 | 523,000 | 887,000 | 38.7 | 15.0 | 23.7 | 5.39 | 141.3 |
| 1975–1980 | 1,497,000 | 505,000 | 977,000 | 36.4 | 13.0 | 23.4 | 4.69 | 119.4 |
| 1980–1985 | 1,527,000 | 481,000 | 1,074,000 | 33.8 | 10.8 | 23.0 | 4.11 | 96.7 |
| 1985–1990 | 1,431,000 | 454,000 | 976,000 | 27.7 | 8.8 | 18.9 | 3.39 | 78.0 |
| 1990–1995 | 1,375,000 | 438,000 | 987,000 | 25.1 | 7.7 | 17.4 | 3.11 | 63.0 |
| 1995–2000 | 1,389,000 | 418,000 | 983,000 | 22.8 | 6.9 | 15.9 | 2.76 | 45.5 |
| 2000–2005 | 1,345,000 | 404,000 | 923,000 | 20.5 | 6.2 | 14.3 | 2.50 | 31.4 |
| 2005–2010 | 1,309,000 | 415,000 | 932,000 | 18.7 | 5.9 | 12.8 | 2.27 | 24.0 |
| 2010–2015 | 1,302,000 | 439,000 | 914,000 | 17.3 | 5.8 | 11.5 | 2.15 | 13.0 |
| 2015–2020 | 1,281,000 | 473,000 | 808,000 | 15.8 | 5.8 | 10.0 | 2.10 | |
| 2020–2025 | 1,242,000 | 509,000 | 733,000 | 14.6 | 6.0 | 8.6 | 2.04 | |
| 2025–2030 | 1,191,000 | 543,000 | 648,000 | 13.6 | 6.2 | 7.4 | 2.01 | |
| 1 CBR = crude birth rate (per 1000); CDR = crude death rate (per 1000); NC = natural change (per 1000); TFR = total fertility rate (number of children per woman); IMR = infant mortality rate per 1000 births | ||||||||
Registered births and deaths
Birth statistics of Turkey from 2001 onward are from the Central Population Administrative System (MERNIS) database which is available on-line.[14] Birth statistics are updated continually because MERNIS has dynamic structure.[15]
In 2010 Turkey had a crude birth rate of 17.2 per 1000, in 2011 16.7, down from 20.3 in 2001. The total fertility rate (TFR) in 2010 was 2.05 children per woman, in 2011 2.02. The crude birth rate in 2010 ranged from 11.5 per 1,000 in West Marmara (TFR 1.52) (11,5;1.55 in 2011), similar to neighbouring Bulgaria, to 27.9 per 1,000 in Southeast Anatolia (TFR 3.53) (27.1;3,42 in 2011), similar to neighbouring Syria. Similarly, in 2012, the TFR ranged from 1.43 in Kırklareli, to 4.39 in Şanlıurfa.[16] Death statistics from MERNIS are available as of 2009. Mortality data prior to 2009 are incomplete.
| Population (31.12.) | Live births | Deaths | Natural change | Crude birth rate (per 1000) | Crude death (per 1000) | Natural increase (per 1000) | Total fertility rate (TFR) | |
|---|---|---|---|---|---|---|---|---|
| 1990 | 1,392,000 | 388,000 | 1,004,000 | 3.11 | ||||
| 1991 | 1,390,000 | 391,000 | 999,000 | 3.02 | ||||
| 1992 | 1,388,000 | 394,000 | 994,000 | 2.94 | ||||
| 1993 | 1,385,000 | 396,000 | 989,000 | 2.87 | ||||
| 1994 | 1,372,000 | 399,000 | 973,000 | 2.81 | ||||
| 1995 | 1,368,000 | 402,000 | 966,000 | 2.76 | ||||
| 1996 | 1,386,000 | 419,000 | 967,000 | 2.70 | ||||
| 1997 | 1,317,000 | 424,000 | 893,000 | 2.66 | ||||
| 1998 | 1,318,000 | 426,000 | 892,000 | 2.61 | ||||
| 1999 | 1,313,000 | 427,000 | 886,000 | 2.56 | ||||
| 2000 | 1,307,000 | 422,000 | 885,000 | 2.50 | ||||
| 2001 | 1,323,341 | 175,137 | 1,148,204 | 20.3 | 2.38 | |||
| 2002 | 1,229,555 | 175,434 | 1,054,121 | 18.6 | 2.40 | |||
| 2003 | 1,198,927 | 184,330 | 1,014,597 | 17.9 | 2.35 | |||
| 2004 | 1,222,484 | 187,086 | 1,035,398 | 18.1 | 2.31 | |||
| 2005 | 1,244,041 | 197,520 | 1,046,521 | 18.2 | 2.27 | |||
| 2006 | 1,255,432 | 210,146 | 1,045,286 | 18.1 | 2.24 | |||
| 2007 | 70,586,256 | 1,289,992 | 212,731 | 1,077,261 | 18.3 | 3.0 | 15.3 | 2.21 |
| 2008 | 71,517,100 | 1,295,511 | 215,562 | 1,079,949 | 18.1 | 3.0 | 15.1 | 2.19 |
| 2009 | 72,561,312 | 1,266,751 | 369,703 | 897,048 | 17.6 | 5.1 | 12.5 | 2.10 |
| 2010 | 73,722,988 | 1,261,169 | 366,471 | 894,698 | 17.2 | 5.0 | 12.2 | 2.08 |
| 2011 | 74,724,269 | 1,252,812 | 376,162 | 876,650 | 16.9 | 5.1 | 11.8 | 2.05 |
| 2012 | 75,627,384 | 1,294,605 | 376,520 | 918,085 | 17.2 | 5.0 | 12.2 | 2.11 |
| 2013 | 76,667,864 | 1,297,505 | 373,041 | 924,464 | 17.0 | 4.9 | 12.1 | 2.11 |
| 2014 | 77,695,904 | 1,351,088 | 391,091 | 959,997 | 17.5 | 5.1 | 12.4 | 2.19 |
| 2015 | 78,741,053 | 1,336,908 | 405,528 | 931,380 | 17.1 | 5.2 | 11.9 | 2.16 |
| 2016 | 79,814,871 | 1,316,204 | 422,964 | 893,240 | 16.6 | 5.3 | 11.3 | 2.11 |
| 2017 | 80,810,525 | 1,300,258 | 426,662 | 873,596 | 16.2 | 5.3 | 10.9 | 2.08 |
| 2018 | 82,003,882 | 1,256,282 | 426,785 | 829,497 | 15.4 | 5.2 | 10.2 | 2.00 |
| 2019 | 83,154,997 | 1,189,939 | 436,624 | 753,315 | 14.4 | 5.3 | 9.1 | 1.89 |
| 2020 | 83,614,362 | 1,117,942 | 509,048 | 608,894 | 13.4 | 6.1 | 7.3 | 1.77 |
| 2021 | 84,680,273 | 1,083,336 | 566,485 | 516,851 | 12.9 | 6.7 | 6.2 | 1.71 |
| 2022 | 85,279,553 | 1,035,795 | 504,839 | 530,956 | 12.2 | 5.9 | 6.3 | 1.62 |
Birth and death rate by region and year
| Region | Population (2022) | Birth Rate (TFR)/2022 | Birth Rate (TFR)/2021 | Birth Rate (TFR)/2020 | Birth Rate (TFR)/2019 | Birth Rate (TFR)/2018 | Birth Rate (TFR)/2017 | Birth Rate (TFR)/2016 | Birth Rate (TFR)/2015 | Birth Rate (TFR)/2014 | Birth Rate (TFR)/2013 | Birth Rate (TFR)/2012 | Birth Rate (TFR)/2011 | Birth Rate (TFR)/2010 | Birth Rate (TFR)/2009 |
|---|---|---|---|---|---|---|---|---|---|---|---|---|---|---|---|
| Turkey | 85 279 553 | 12.2 (1.62) | 12.9 (1.71) | 13.4 (1.77) | 14.4 (1.89) | 15.4 (2.00) | 16.2 (2.08) | 16.6 (2.11) | 17.1 (2.16) | 17.5 (2.19) | 17.0 (2.11) | 17.2 (2.11) | 16.9 (2.05) | 17.2 (2.08) | 17.6 (2.10) |
| İstanbul | 15 907 951 | 10.7 (1.29) | 11.5 (1.39) | 12.4 (1.48) | 13.6 (1.60) | 14.8 (1.73) | 15.6 (1.80) | 16.3 (1.86) | 16.7 (1.88) | 17.0 (1.89) | 16.4 (1.81) | 16.5 (1.80) | 15.9 (1.72) | 16.3 (1.77) | 16.4 (1.77) |
| West Marmara | 3 743 485 | 9.4 (1.41) | 9.6 (1.43) | 10.1 (1.50) | 10.6 (1.57) | 11.5 (1.67) | 11.8 (1.70) | 11.9 (1.69) | 12.0 (1.69) | 12.1 (1.69) | 11.9 (1.64) | 11.9 (1.63) | 11.6 (1.57) | 11.5 (1.54) | 11.7 (1.54) |
| Aegean | 10 886 803 | 9.8 (1.41) | 10.2 (1.45) | 10.7 (1.50) | 11.4 (1.58) | 12.2 (1.68) | 12.9 (1.75) | 13.2 (1.76) | 13.6 (1.80) | 13.8 (1.80) | 13.4 (1.73) | 13.7 (1.74) | 13.2 (1.66) | 13.3 (1.66) | 13.7 (1.69) |
| East Marmara | 8 511 450 | 11.0 (1.48) | 11.7 (1.56) | 12.2 (1.61) | 13.2 (1.72) | 14.2 (1.83) | 14.6 (1.87) | 15.0 (1.89) | 15.2 (1.90) | 15.3 (1.88) | 14.8 (1.80) | 15.0 (1.80) | 14.5 (1.71) | 14.8 (1.74) | 15.2 (1.77) |
| West Anatolia | 8 339 470 | 10.9 (1.42) | 11.4 (1.48) | 12.0 (1.55) | 13.0 (1.66) | 14.1 (1.78) | 14.7 (1.84) | 15.1 (1.87) | 15.5 (1.90) | 15.8 (1.91) | 15.4 (1.85) | 15.4 (1.83) | 15.2 (1.79) | 15.4 (1.80) | 15.8 (1.83) |
| Mediterranean | 11 020 550 | 12.2 (1.71) | 12.8 (1.77) | 13.3 (1.83) | 14.3 (1.96) | 15.4 (2.08) | 16.3 (2.18) | 17.0 (2.24) | 17.5 (2.29) | 18.0 (2.32) | 17.6 (2.24) | 17.8 (2.23) | 17.3 (2.14) | 17.8 (2.18) | 18.3 (2.20) |
| Central Anatolia | 4 124 939 | 11.3 (1.56) | 11.8 (1.62) | 12.3 (1.68) | 13.2 (1.79) | 14.1 (1.89) | 14.9 (1.99) | 15.4 (2.05) | 15.8 (2.09) | 16.4 (2.14) | 16.0 (2.06) | 16.3 (2.07) | 16.4 (2.06) | 16.7 (2.08) | 17.6 (2.16) |
| West Black Sea | 4 665 938 | 9.0 (1.35) | 9.4 (1.41) | 9.8 (1.47) | 10.6 (1.57) | 11.2 (1.63) | 11.6 (1.67) | 11.9 (1.69) | 12.2 (1.73) | 12.7 (1.77) | 12.8 (1.76) | 13.0 (1.77) | 13.0 (1.74) | 13.6 (1.79) | 14.2 (1.84) |
| East Black Sea | 2 690 038 | 9.3 (1.39) | 9.8 (1.45) | 10.3 (1.52) | 11.0 (1.61) | 11.6 (1.69) | 12.0 (1.73) | 12.3 (1.77) | 12.5 (1.78) | 12.8 (1.81) | 12.8 (1.77) | 13.0 (1.78) | 13.1 (1.77) | 13.6 (1.81) | 14.1 (1.86) |
| Northeast Anatolia | 2 154 748 | 15.0 (1.92) | 16.5 (2.11) | 17.1 (2.18) | 18.4 (2.36) | 19.1 (2.45) | 20.6 (2.64) | 21.2 (2.72) | 21.7 (2.79) | 22.7 (2.90) | 22.4 (2.85) | 22.8 (2.90) | 22.9 (2.90) | 23.4 (2.97) | 23.1 (2.91) |
| Central East Anatolia | 3 928 271 | 16.0 (2.01) | 16.8 (2.12) | 17.8 (2.23) | 19.3 (2.43) | 20.0 (2.52) | 21.1 (2.65) | 21.2 (2.67) | 21.9 (2.75) | 23.0 (2.87) | 22.6 (2.83) | 22.5 (2.82) | 22.9 (2.85) | 23.6 (2.95) | 23.9 (3.00) |
| Southeast Anatolia | 9 305 910 | 21.3 (2.71) | 22.7 (2.86) | 22.5 (2.84) | 23.8 (3.03) | 25.5 (3.23) | 26.6 (3.36) | 26.7 (3.38) | 27.8 (3.52) | 28.7 (3.63) | 27.6 (3.48) | 28.0 (3.53) | 27.7 (3.48) | 28.2 (3.57) | 28.3 (3.59) |
| Region | Population (2022) | Death Rate (2022) | Death Rate (2021) | Death Rate (2020) | Death Rate (2019) | Death Rate (2018) | Death Rate (2017) | Death Rate (2016) | Death Rate (2015) | Death Rate (2014) | Death Rate (2013) | Death Rate (2012) | Death Rate (2011) | Death Rate (2010) | Death Rate (2009) |
|---|---|---|---|---|---|---|---|---|---|---|---|---|---|---|---|
| Turkey | 85 279 553 | 5.9 | 6.7 | 6.1 | 5.3 | 5.2 | 5.3 | 5.3 | 5.2 | 5.1 | 4.9 | 5.0 | 5.1 | 5.0 | 5.1 |
| İstanbul | 15 907 951 | 4.6 | 5.4 | 4.9 | 4.2 | 4.2 | 4.2 | 4.2 | 4.1 | 4.1 | 3.9 | 4.0 | 4.0 | 4.0 | 4.2 |
| West Marmara | 3 743 485 | 9.0 | 9.8 | 8.1 | 7.7 | 7.8 | 7.8 | 7.7 | 7.8 | 7.5 | 7.1 | 7.3 | 7.3 | 7.3 | 7.3 |
| Aegean | 10 886 803 | 7.7 | 8.2 | 7.5 | 6.7 | 6.6 | 6.6 | 6.6 | 6.4 | 6.1 | 5.9 | 6.2 | 6.2 | 5.9 | 6.0 |
| East Marmara | 8 511 450 | 6.3 | 7.3 | 6.3 | 5.6 | 5.7 | 5.7 | 5.7 | 5.7 | 5.5 | 5.4 | 5.5 | 5.5 | 5.5 | 5.6 |
| West Anatolia | 8 339 470 | 5.5 | 6.2 | 6.1 | 5.0 | 5.0 | 5.0 | 4.9 | 4.7 | 4.7 | 4.5 | 4.6 | 4.7 | 4.6 | 4.8 |
| Mediterranean | 11 020 550 | 5.7 | 6.5 | 5.8 | 5.0 | 4.9 | 4.9 | 5.0 | 4.8 | 4.6 | 4.5 | 4.5 | 4.5 | 4.5 | 4.5 |
| Central Anatolia | 4 124 939 | 6.7 | 7.8 | 7.1 | 5.9 | 5.9 | 6.1 | 6.1 | 5.9 | 5.8 | 5.5 | 5.5 | 5.7 | 5.5 | 5.7 |
| West Black Sea | 4 665 938 | 8.8 | 9.9 | 8.5 | 7.6 | 7.6 | 7.6 | 7.6 | 7.4 | 7.3 | 6.9 | 7.0 | 7.0 | 6.8 | 7.0 |
| East Black Sea | 2 690 038 | 8.7 | 9.6 | 8.0 | 7.2 | 7.0 | 7.3 | 7.0 | 6.9 | 6.8 | 6.3 | 6.5 | 6.5 | 6.2 | 6.4 |
| Northeast Anatolia | 2 154 748 | 5.2 | 6.1 | 5.7 | 4.9 | 5.0 | 5.0 | 5.0 | 5.0 | 4.9 | 4.8 | 5.0 | 5.4 | 5.0 | 5.1 |
| Central East Anatolia | 3 928 271 | 4.3 | 5.2 | 5.1 | 4.1 | 4.0 | 4.2 | 4.2 | 4.1 | 4.1 | 4.1 | 4.1 | 4.5 | 4.4 | 4.5 |
| Southeast Anatolia | 9 305 910 | 3.5 | 4.3 | 4.2 | 3.5 | 3.3 | 3.4 | 3.7 | 3.4 | 3.5 | 3.4 | 3.5 | 3.6 | 3.7 | 3.8 |
Total births and deaths by region and year
| Region | Population (2022) | Births (2022) | Births (2021) | Births (2020) | Births (2019) | Births (2018) | Births (2017) | Births (2016) | Births (2015) | Births (2014) | Births (2013) | Births (2012) | Births (2011) | Births (2010) | Births (2009) |
|---|---|---|---|---|---|---|---|---|---|---|---|---|---|---|---|
| Turkey | 85 279 553 | 1,035,795 | 1,083,336 | 1,117,942 | 1,189,939 | 1,256,282 | 1,300,258 | 1,316,204 | 1,336,908 | 1,351,088 | 1,297,505 | 1,294,605 | 1,252,812 | 1,261,169 | 1,266,751 |
| İstanbul | 15 907 951 | 170,084 | 180,718 | 192,424 | 208,264 | 223,013 | 233,220 | 240,027 | 242,888 | 242,397 | 229,390 | 226,594 | 213,441 | 213,821 | 210,441 |
| West Marmara | 3 743 485 | 34,812 | 35,060 | 36,522 | 38,159 | 40,590 | 40,933 | 40,495 | 40,391 | 40,138 | 38,806 | 38,517 | 37,058 | 36,284 | 36,400 |
| Aegean | 10 886 803 | 106,284 | 109,564 | 113,538 | 120,023 | 127,579 | 132,868 | 134,176 | 137,187 | 137,438 | 132,299 | 133,419 | 127,833 | 128,112 | 129,927 |
| East Marmara | 8 511 450 | 93,238 | 97,590 | 99,942 | 106,064 | 112,164 | 113,462 | 113,585 | 112,635 | 111,115 | 105,761 | 105,203 | 99,704 | 100,386 | 100,928 |
| West Anatolia | 8 339 470 | 90,738 | 93,796 | 98,139 | 104,588 | 111,376 | 115,079 | 116,456 | 117,694 | 117,405 | 112,593 | 111,279 | 108,026 | 106,921 | 107,734 |
| Mediterranean | 11 020 550 | 134,115 | 138,127 | 142,483 | 150,950 | 159,689 | 166,815 | 171,561 | 174,874 | 177,272 | 170,686 | 169,985 | 163,817 | 166,123 | 167,506 |
| Central Anatolia | 4 124 939 | 46,628 | 48,257 | 50,332 | 53,825 | 56,527 | 58,933 | 60,381 | 61,569 | 63,446 | 61,669 | 62,634 | 62,989 | 64,216 | 67,174 |
| West Black Sea | 4 665 938 | 41,807 | 43,903 | 45,773 | 49,595 | 51,705 | 52,779 | 53,722 | 54,995 | 57,099 | 57,369 | 58,377 | 58,511 | 61,393 | 63,972 |
| East Black Sea | 2 690 038 | 25,073 | 26,202 | 27,682 | 29,627 | 31,002 | 31,556 | 32,092 | 32,144 | 32,817 | 32,558 | 32,774 | 32,836 | 34,272 | 35,565 |
| Northeast Anatolia | 2 154 748 | 32,640 | 36,004 | 37,557 | 40,613 | 41,915 | 45,262 | 46,609 | 47,720 | 49,996 | 49,605 | 50,781 | 50,779 | 51,578 | 50,778 |
| Central East Anatolia | 3 928 271 | 62,761 | 66,389 | 70,007 | 75,717 | 77,860 | 81,133 | 81,298 | 83,682 | 87,027 | 84,963 | 84,018 | 84,344 | 86,055 | 86,812 |
| Southeast Anatolia | 9 305 910 | 197,615 | 207,726 | 203,543 | 212,514 | 222,862 | 228,218 | 225,802 | 231,129 | 234,938 | 221,806 | 221,024 | 213,474 | 212,008 | 209,514 |
| Region | Population (2022) | Deaths (2022) | Deaths (2021) | Deaths (2020) | Deaths (2019) | Deaths (2018) | Deaths (2017) | Deaths (2016) | Deaths (2015) | Deaths (2014) | Deaths (2013) | Deaths (2012) | Deaths (2011) | Deaths (2010) | Deaths (2009) |
|---|---|---|---|---|---|---|---|---|---|---|---|---|---|---|---|
| Turkey | 85 279 553 | 504,839 | 566,485 | 509,048 | 436,624 | 426,785 | 426,662 | 422,964 | 405,528 | 391,091 | 373,041 | 376,520 | 376,162 | 366,471 | 369,703 |
| İstanbul | 15 907 951 | 73,751 | 84,243 | 76,407 | 63,486 | 62,594 | 63,372 | 62,572 | 60,093 | 58,009 | 54,770 | 54,696 | 53,165 | 52,812 | 53,761 |
| West Marmara | 3 743 485 | 33,315 | 35,752 | 29,385 | 27,589 | 27,456 | 27,219 | 26,416 | 26,145 | 24,864 | 23,229 | 23,496 | 23,167 | 23,007 | 22,687 |
| Aegean | 10 886 803 | 83,124 | 87,904 | 79,805 | 71,047 | 68,644 | 68,475 | 67,699 | 64,844 | 61,126 | 57,651 | 60,234 | 59,623 | 56,658 | 57,068 |
| East Marmara | 8 511 450 | 53,615 | 60,288 | 51,536 | 45,264 | 44,858 | 44,250 | 43,628 | 41,991 | 40,007 | 38,291 | 38,220 | 38,094 | 37,526 | 37,379 |
| West Anatolia | 8 339 470 | 45,783 | 51,273 | 50,005 | 39,814 | 39,382 | 38,910 | 37,765 | 35,814 | 34,589 | 33,219 | 33,369 | 33,097 | 32,270 | 32,976 |
| Mediterranean | 11 020 550 | 62,678 | 69,851 | 61,592 | 52,801 | 50,776 | 50,533 | 50,229 | 47,411 | 45,439 | 43,949 | 43,404 | 42,900 | 41,834 | 41,264 |
| Central Anatolia | 4 124 939 | 27,462 | 31,862 | 28,802 | 24,198 | 23,890 | 24,005 | 23,914 | 23,086 | 22,379 | 21,238 | 21,049 | 21,873 | 21,299 | 21,582 |
| West Black Sea | 4 665 938 | 40,926 | 46,100 | 39,595 | 35,366 | 34,984 | 34,748 | 34,359 | 33,355 | 32,772 | 31,011 | 31,476 | 31,651 | 30,541 | 31,279 |
| East Black Sea | 2 690 038 | 23,365 | 25,906 | 21,342 | 19,345 | 18,606 | 19,183 | 18,339 | 17,672 | 17,292 | 15,996 | 16,504 | 16,266 | 15,574 | 16,158 |
| Northeast Anatolia | 2 154 748 | 11,344 | 13,370 | 12,564 | 10,779 | 10,900 | 10,915 | 11,020 | 11,013 | 10,787 | 10,667 | 11,052 | 11,870 | 10,955 | 11,154 |
| Central East Anatolia | 3 928 271 | 16,953 | 20,460 | 19,979 | 15,969 | 15,530 | 16,086 | 16,132 | 15,685 | 15,441 | 15,430 | 15,419 | 16,551 | 16,114 | 16,491 |
| Southeast Anatolia | 9 305 910 | 32,523 | 39,476 | 38,036 | 30,966 | 29,165 | 28,966 | 30,891 | 28,419 | 28,386 | 27,590 | 27,601 | 27,905 | 27,881 | 27,904 |
Natural increase by region and year
| Region | Population (2022) | Natural Increase (2022) | Natural Increase (2021) | Natural Increase (2020) | Natural Increase (2019) | Natural Increase (2018) | Natural Increase (2017) | Natural Increase (2016) | Natural Increase (2015) | Natural Increase (2014) | Natural Increase (2013) | Natural Increase (2012) | Natural Increase (2011) | Natural Increase (2010) | Natural Increase (2009) |
|---|---|---|---|---|---|---|---|---|---|---|---|---|---|---|---|
| Turkey | 85 279 553 | 530 956/6.3 | 516 851/6.2 | 608 894/7.3 | 753 315/9.1 | 829 497/10.2 | 873 596/10.9 | 893 240/11.3 | 931 380/11.9 | 959 997/12.4 | 924 464/12.1 | 918 085/12.2 | 876 650/11.8 | 894 698/12.2 | 897 048/12.5 |
| İstanbul | 15 907 951 | 96 333/6.1 | 96 475/6.1 | 116 017/7.5 | 144 778/9.4 | 160 419/10.6 | 169 848/11.4 | 177 455/12.0 | 182 795/12.6 | 184 388/12.9 | 174 620/12.5 | 171 898/12.5 | 160 276/11.9 | 161 009/12.3 | 156 680/12.2 |
| West Marmara | 3 743 485 | 1 497/0.4 | -692/-0.2 | 7 137/2.0 | 10 570/2.9 | 13 134/3.7 | 13 714/3.9 | 14 079/4.1 | 14 246/4.2 | 15 274/4.6 | 15 577/4.8 | 15 021/4.7 | 13 891/4.4 | 13 277/4.2 | 13 713/4.4 |
| Aegean | 10 886 803 | 23 160/2.1 | 21 660/2.0 | 33 733/3.2 | 48 976/4.7 | 58 935/5.6 | 64 393/6.2 | 66 477/6.5 | 72 343/7.2 | 76 312/7.7 | 74 648/7.6 | 73 185/7.5 | 68 210/7.0 | 71 454/7.4 | 72 859/7.7 |
| East Marmara | 8 511 450 | 39 623/4.7 | 37 302/4.4 | 48 406/5.9 | 60 800/7.6 | 67 306/8.5 | 69 212/8.9 | 69 957/9.2 | 70 644/9.5 | 71 108/9.8 | 67 470/9.5 | 66 983/9.6 | 61 610/8.9 | 62 860/9.3 | 63 549/9.6 |
| West Anatolia | 8 339 470 | 44 955/5.4 | 42 523/5.2 | 48 134/5.9 | 64 774/8.0 | 71 994/9.1 | 76 169/9.7 | 78 691/10.2 | 81 880/10.8 | 82 816/11.1 | 79 374/10.9 | 77 910/10.8 | 74 929/10.6 | 74 651/10.7 | 74 758/11.0 |
| Mediterranean | 11 020 550 | 71 437/6.5 | 68 276/6.3 | 80 891/7.5 | 98 149/9.3 | 108 913/10.5 | 116 282/11.4 | 121 332/12.0 | 127 463/12.8 | 131 833/13.4 | 126 737/13.1 | 126 581/13.2 | 120 917/12.8 | 124 289/13.3 | 126 242/13.8 |
| Central Anatolia | 4 124 939 | 19 166/4.6 | 16 395/4.0 | 21 530/5.2 | 29 627/7.3 | 32 637/8.2 | 34 928/8.8 | 36 467/9.3 | 38 483/9.9 | 41 067/10.6 | 40 431/10.5 | 41 585/10.8 | 41 116/10.7 | 42 917/11.2 | 45 592/12.0 |
| West Black Sea | 4 665 938 | 881/0.2 | -2 197/-0.5 | 6 178/1.3 | 14 229/3.0 | 16 721/3.6 | 18 031/4.0 | 19 363/4.3 | 21 640/4.8 | 24 327/5.4 | 26 358/5.9 | 26 901/6.0 | 26 860/6.0 | 30 852/6.8 | 32 693/7.3 |
| East Black Sea | 2 690 038 | 1 708/0.6 | 296/0.2 | 6 340/2.3 | 10 282/3.8 | 12 396/4.6 | 12 373/4.7 | 13 753/5.3 | 14 472/5.6 | 15 525/6.1 | 16 562/6.5 | 16 270/6.4 | 16 570/6.6 | 18 698/7.4 | 19 407/7.7 |
| Northeast Anatolia | 2 154 748 | 21 296/9.8 | 22 634/10.4 | 24 993/11.4 | 29 834/13.5 | 31 015/14.1 | 34 347/15.6 | 35 589/16.2 | 36 707/16.7 | 39 209/17.8 | 38 938/17.6 | 39 729/17.8 | 38 909/17.6 | 40 623/18.5 | 39 624/18.0 |
| Central East Anatolia | 3 928 271 | 45 808/11.7 | 45 929/11.6 | 50 028/12.7 | 59 748/15.2 | 62 330/16.0 | 65 047/16.9 | 65 166/17.0 | 67 997/17.8 | 71 586/18.9 | 69 533/18.5 | 68 599/18.4 | 67 793/18.4 | 69 941/19.2 | 70 321/19.4 |
| Southeast Anatolia | 9 305 910 | 165 092/17.8 | 168 250/18.4 | 165 507/18.3 | 181 548/20.3 | 193 697/22.2 | 199 252/23.2 | 194 911/23.1 | 202 710/24.4 | 206 552/25.3 | 194 216/24.2 | 193 423/24.5 | 185 569/24.1 | 184 127/24.5 | 181 610/24.5 |
Historical fertility rate
Fertility Rate (TFR) (Wanted Fertility Rate) and CBR (Crude Birth Rate):[17]
| Year | CBR (Total) | TFR (Total) | CBR (Urban) | TFR (Urban) | CBR (Rural) | TFR (Rural) |
|---|---|---|---|---|---|---|
| 1993 | 22,9 | 2,7 (1,8) | 21,7 | 2,4 (1,7) | 24,0 | 3,1 (2,0) |
| 1998 | 23,4 | 2,61 (1,9) | 22,8 | 2,39 (1,9) | 24,7 | 3,08 (2,1) |
Total fertility rate by region in Turkey by Turkish General Census (GNS) and Turkish population and health research (TNSA).[18]
| South-East | East | Mediterranean | Black Sea | Central | Aegean | Marmara | Turkey | |
|---|---|---|---|---|---|---|---|---|
| TNSA 1978 | 6,31 | 3,77 | 4,99 | 4,26 | 2,89 | 4,33 | ||
| GNS 1980 | 4,61 | 4,64 | 3,50 | 3,65 | 3,76 | 2,81 | 2,73 | 3,41 |
| TNSA 1993 | 4,40 | 2,37 | 3,15 | 2,44 | 2,03 | 2,65 | ||
| TNSA 1998 | 4,19 | 2,55 | 2,68 | 2,56 | 2,03 | 2,61 | ||
| GNS 2000 | 4,31 | 3,72 | 2,43 | 2,28 | 2,29 | 1,96 | 1,88 | 2,53 |
| TNSA 2003 | 3,65 | 2,30 | 1,94 | 1,86 | 1,88 | 2,23 | ||
| GNS rural 2000 | 4,80 | 4,52 | 2,52 | 2,56 | 2,91 | 2,23 | 2,03 | 2,87 |
| GNS urban 2000 | 4,05 | 3,08 | 2,38 | 2,01 | 2,05 | 1,80 | 1,85 | 2,20 |
| GNS metropolitan 2000 | 3,81 | 2,34 | 2,41 | 1,87 | 1,89 | 1,60 | 1,83 | 2,03 |
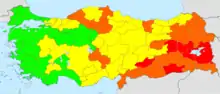
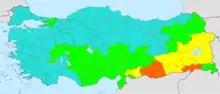
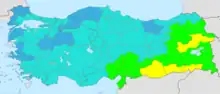
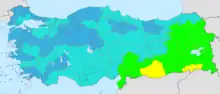
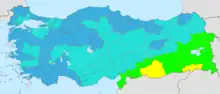
Total fertility rate (TFR) by province and year

Figures from Turkish Statistical Institute (TurkStat):[19]
|
5–6
4–5
3–4
2–3
1.5 – 2
1 – 1.5 |
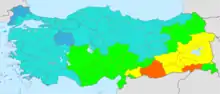
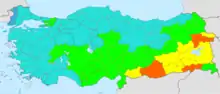
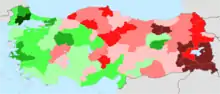
|
> 12%
8 to 12%
4 to 8%
0 to 4%
-4 to 0%
-8 to −4%
-12 to −8%
< -12% |
| Province | Population (2022)[20] | TFR (1980)[18] | TFR (2000) | TFR (2009) | TFR (2010) | TFR (2011) | TFR (2012) | TFR (2013) | TFR (2014) | TFR (2015) | TFR (2016) | TFR (2017) | TFR (2018) | TFR (2019) | TFR (2020) | TFR (2021) | TFR (2022) |
|---|---|---|---|---|---|---|---|---|---|---|---|---|---|---|---|---|---|
| Turkey | 85 279 553 | 2.12 | 2.08 | 2.05 | 2.11 | 2.10 | 2.18 | 2.15 | 2.11 | 2.07 | 1.99 | 1.88 | 1.76 | 1.71 | 1.62 | ||
| İstanbul | 15 907 951 | 1.77 | 1.77 | 1.72 | 1.80 | 1.81 | 1.89 | 1.88 | 1.86 | 1.80 | 1.73 | 1.60 | 1.48 | 1.39 | 1.29 | ||
| West Marmara | 3 743 485 | 1.54 | 1.54 | 1.57 | 1.63 | 1.64 | 1.69 | 1.69 | 1.68 | 1.69 | 1.66 | 1.56 | 1.49 | 1.43 | 1.41 | ||
| Tekirdağ | 1 142 451 | 1.83 | 1.69 | 1.67 | 1.72 | 1.79 | 1.82 | 1.88 | 1.94 | 1.93 | 1.93 | 1.92 | 1.77 | 1.65 | 1.59 | 1.53 | |
| Edirne | 414 714 | 2.41 | 1.66 | 1.43 | 1.39 | 1.45 | 1.51 | 1.49 | 1.46 | 1.54 | 1.48 | 1.46 | 1.43 | 1.34 | 1.34 | 1.31 | 1.31 |
| Kırklareli | 369 347 | 1.70 | 1.38 | 1.39 | 1.35 | 1.45 | 1.45 | 1.56 | 1.55 | 1.48 | 1.53 | 1.48 | 1.43 | 1.40 | 1.30 | 1.31 | |
| Balıkesir | 1 257 590 | 1.95 | 1.53 | 1.56 | 1.58 | 1.62 | 1.65 | 1.71 | 1.65 | 1.67 | 1.66 | 1.63 | 1.54 | 1.48 | 1.41 | 1.42 | |
| Çanakkale | 559 383 | 1.68 | 1.50 | 1.44 | 1.53 | 1.58 | 1.52 | 1.57 | 1.55 | 1.56 | 1.57 | 1.56 | 1.47 | 1.39 | 1.32 | 1.28 | |
| Aegean | 10 886 803 | 1.69 | 1.66 | 1.66 | 1.74 | 1.73 | 1.80 | 1.80 | 1.76 | 1.74 | 1.67 | 1.57 | 1.49 | 1.45 | 1.41 | ||
| İzmir | 4 462 056 | 1.75 | 1.57 | 1.54 | 1.56 | 1.66 | 1.64 | 1.72 | 1.72 | 1.68 | 1.65 | 1.59 | 1.48 | 1.39 | 1.36 | 1.31 | |
| Aydın | 1 148 241 | 2.12 | 1.74 | 1.71 | 1.69 | 1.82 | 1.79 | 1.84 | 1.85 | 1.82 | 1.87 | 1.78 | 1.67 | 1.57 | 1.54 | 1.49 | |
| Denizli | 1 056 332 | 2.19 | 1.73 | 1.66 | 1.70 | 1.74 | 1.76 | 1.87 | 1.86 | 1.80 | 1.79 | 1.71 | 1.61 | 1.55 | 1.50 | 1.47 | |
| Muğla | 1 048 185 | 1.94 | 1.71 | 1.70 | 1.67 | 1.76 | 1.73 | 1.76 | 1.77 | 1.73 | 1.69 | 1.64 | 1.55 | 1.50 | 1.43 | 1.35 | |
| Manisa | 1 468 279 | 2.14 | 1.78 | 1.77 | 1.79 | 1.86 | 1.89 | 1.94 | 1.93 | 1.91 | 1.86 | 1.83 | 1.75 | 1.68 | 1.64 | 1.61 | |
| Afyonkarahisar | 747 555 | 3.74 | 2.82 | 2.06 | 2.01 | 2.01 | 2.03 | 1.98 | 2.09 | 2.08 | 2.01 | 1.97 | 1.89 | 1.84 | 1.74 | 1.67 | 1.61 |
| Kütahya | 580 701 | 2.19 | 1.55 | 1.60 | 1.53 | 1.55 | 1.52 | 1.58 | 1.59 | 1.52 | 1.50 | 1.43 | 1.34 | 1.31 | 1.21 | 1.18 | |
| Uşak | 375 454 | 2.18 | 1.64 | 1.67 | 1.64 | 1.74 | 1.76 | 1.79 | 1.74 | 1.68 | 1.69 | 1.59 | 1.50 | 1.44 | 1.37 | 1.38 | |
| East Marmara | 8 511 450 | 1.77 | 1.74 | 1.71 | 1.80 | 1.80 | 1.88 | 1.89 | 1.89 | 1.86 | 1.83 | 1.71 | 1.61 | 1.56 | 1.48 | ||
| Bursa | 3 194 720 | 1.98 | 1.78 | 1.77 | 1.73 | 1.85 | 1.85 | 1.90 | 1.92 | 1.91 | 1.88 | 1.86 | 1.74 | 1.65 | 1.57 | 1.47 | |
| Eskişehir | 906 617 | 1.74 | 1.40 | 1.38 | 1.38 | 1.46 | 1.48 | 1.57 | 1.56 | 1.54 | 1.54 | 1.49 | 1.40 | 1.35 | 1.35 | 1.29 | |
| Bilecik | 228 673 | 1.98 | 1.71 | 1.67 | 1.63 | 1.75 | 1.77 | 1.78 | 1.72 | 1.74 | 1.70 | 1.69 | 1.62 | 1.50 | 1.45 | 1.40 | |
| Kocaeli | 2 079 072 | 3.23 | 2.13 | 1.90 | 1.87 | 1.82 | 1.91 | 1.91 | 2.04 | 2.07 | 2.04 | 2.01 | 1.96 | 1.85 | 1.70 | 1.66 | 1.58 |
| Sakarya | 1 080 080 | 2,23 | 1.87 | 1.82 | 1.78 | 1.85 | 1.83 | 1.91 | 1.93 | 1.95 | 1.94 | 1.94 | 1.80 | 1.68 | 1.68 | 1.55 | |
| Düzce | 405 131 | 2.18 | 1.87 | 1.83 | 1.82 | 1.81 | 1.87 | 1.90 | 1.86 | 1.90 | 1.83 | 1.77 | 1.71 | 1.60 | 1.49 | 1.48 | |
| Bolu | 320 824 | 1.93 | 1.60 | 1.57 | 1.64 | 1.59 | 1.64 | 1.66 | 1.60 | 1.62 | 1.56 | 1.52 | 1.46 | 1.36 | 1.37 | 1.31 | |
| Yalova | 296 333 | 1.93 | 1.78 | 1.64 | 1.62 | 1.72 | 1.69 | 1.81 | 1.78 | 1.88 | 1.82 | 1.75 | 1.65 | 1.49 | 1.48 | 1.39 | |
| West Anatolia | 8 339 470 | 1.83 | 1.80 | 1.79 | 1.83 | 1.85 | 1.91 | 1.90 | 1.86 | 1.83 | 1.77 | 1.65 | 1.54 | 1.48 | 1.42 | ||
| Ankara | 5 782 285 | 1.90 | 1.68 | 1.66 | 1.65 | 1.68 | 1.71 | 1.77 | 1.77 | 1.73 | 1.71 | 1.65 | 1.53 | 1.42 | 1.34 | 1.28 | |
| Konya | 2 296 347 | 3.00 | 2.14 | 2.12 | 2.13 | 2.18 | 2.18 | 2.25 | 2.20 | 2.18 | 2.11 | 2.06 | 1.93 | 1.84 | 1.80 | 1.75 | |
| Karaman | 260 838 | 2.77 | 2.15 | 1.95 | 1.98 | 2.02 | 2.09 | 2.04 | 2.12 | 2.09 | 2.06 | 1.95 | 1.85 | 1.77 | 1.66 | 1.60 | |
| Mediterranean | 11 020 550 | 2.20 | 2.18 | 2.14 | 2.23 | 2.24 | 2.32 | 2.28 | 2.24 | 2.16 | 2.07 | 1.94 | 1.83 | 1.77 | 1.71 | ||
| Antalya | 2 688 004 | 1.93 | 1.91 | 1.87 | 1.84 | 1.93 | 1.91 | 1.96 | 1.98 | 1.94 | 1.84 | 1.76 | 1.63 | 1.54 | 1.48 | 1.37 | |
| Isparta | 445 325 | 2.04 | 1.76 | 1.66 | 1.66 | 1.72 | 1.70 | 1.75 | 1.72 | 1.72 | 1.76 | 1.62 | 1.54 | 1.45 | 1.43 | 1.39 | |
| Burdur | 273 799 | 2.12 | 1.74 | 1.73 | 1.68 | 1.66 | 1.68 | 1.79 | 1.79 | 1.74 | 1.66 | 1.58 | 1.50 | 1.41 | 1.37 | 1.36 | |
| Adana | 2 274 106 | 2.68 | 2.18 | 2.14 | 2.12 | 2.21 | 2.25 | 2.34 | 2.32 | 2.26 | 2.22 | 2.12 | 2.01 | 1.87 | 1.83 | 1.82 | |
| Mersin | 1 916 432 | 2.38 | 2.03 | 2.04 | 2.00 | 2.12 | 2.11 | 2.20 | 2.17 | 2.14 | 2.07 | 2.02 | 1.86 | 1.77 | 1.72 | 1.68 | |
| Hatay | 1 686 043 | 2.97 | 2.57 | 2.54 | 2.51 | 2.63 | 2.62 | 2.82 | 2.74 | 2.69 | 2.58 | 2.49 | 2.37 | 2.20 | 2.15 | 2.04 | |
| Kahramanmaraş | 1 177 436 | 3.54 | 2.70 | 2.68 | 2.66 | 2.68 | 2.74 | 2.74 | 2.64 | 2.60 | 2.53 | 2.38 | 2.22 | 2.10 | 2.00 | 1.94 | |
| Osmaniye | 559 405 | 2.95 | 2.55 | 2.57 | 2.40 | 2.51 | 2.51 | 2.59 | 2.50 | 2.43 | 2.39 | 2.26 | 2.21 | 2.03 | 1.92 | 1.98 | |
| Central Anatolia | 4 124 939 | 2.16 | 2.08 | 2.06 | 2.07 | 2.06 | 2.13 | 2.08 | 2.03 | 1.96 | 1.87 | 1.78 | 1.67 | 1.62 | 1.56 | ||
| Kırıkkale | 277 046 | 2.39 | 1.77 | 1.70 | 1.60 | 1.59 | 1.65 | 1.69 | 1.72 | 1.69 | 1.68 | 1.59 | 1.53 | 1.43 | 1.39 | 1.33 | |
| Aksaray | 433 055 | 2.85 | 2.42 | 2.35 | 2.34 | 2.30 | 2.29 | 2.35 | 2.30 | 2.24 | 2.19 | 2.13 | 1.99 | 1.92 | 1.86 | 1.83 | |
| Niğde | 365 419 | 2.98 | 2.40 | 2.28 | 2.23 | 2.32 | 2.25 | 2.33 | 2.19 | 2.20 | 2.08 | 1.99 | 1.92 | 1.76 | 1.72 | 1.69 | |
| Nevşehir | 310 011 | 2.55 | 2.10 | 1.98 | 1.97 | 1.98 | 1.94 | 2.10 | 1.98 | 1.93 | 1.85 | 1.78 | 1.66 | 1.62 | 1.58 | 1.51 | |
| Kırşehir | 244 519 | 2.40 | 1.72 | 1.69 | 1.69 | 1.75 | 1.78 | 1.86 | 1.82 | 1.79 | 1.76 | 1.73 | 1.65 | 1.49 | 1.40 | 1.38 | |
| Kayseri | 1 441 523 | 2.62 | 2.21 | 2.14 | 2.16 | 2.18 | 2.17 | 2.25 | 2.19 | 2.13 | 2.02 | 1.96 | 1.85 | 1.71 | 1.66 | 1.60 | |
| Sivas | 634 924 | 2.76 | 2.07 | 2.02 | 1.99 | 1.99 | 1.94 | 1.99 | 1.98 | 1.96 | 1.94 | 1.78 | 1.73 | 1.63 | 1.55 | 1.46 | |
| Yozgat | 418 442 | 2.84 | 2.25 | 2.07 | 2.04 | 2.03 | 1.97 | 2.06 | 2.06 | 2.01 | 1.99 | 1.83 | 1.71 | 1.63 | 1.53 | 1.47 | |
| West Black Sea | 4 665 938 | 1.84 | 1.79 | 1.74 | 1.77 | 1.76 | 1.77 | 1.73 | 1.69 | 1.66 | 1.63 | 1.56 | 1.46 | 1.41 | 1.35 | ||
| Zonguldak | 588 510 | 1.93 | 1.71 | 1.65 | 1.58 | 1.62 | 1.59 | 1.60 | 1.56 | 1.50 | 1.48 | 1.43 | 1.38 | 1.31 | 1.26 | 1.18 | |
| Karabük | 252 058 | 1.99 | 1.67 | 1.60 | 1.62 | 1.54 | 1.59 | 1.56 | 1.57 | 1.46 | 1.50 | 1.49 | 1.41 | 1.29 | 1.32 | 1.21 | |
| Bartın | 203 351 | 2.11 | 1.68 | 1.67 | 1.61 | 1.50 | 1.57 | 1.69 | 1.58 | 1.55 | 1.45 | 1.48 | 1.42 | 1.38 | 1.25 | 1.26 | |
| Kastamonu | 378 115 | 3.44 | 2.18 | 1.70 | 1.69 | 1.64 | 1.69 | 1.68 | 1.59 | 1.63 | 1.59 | 1.50 | 1.54 | 1.47 | 1.41 | 1.39 | 1.39 |
| Çankırı | 195 766 | 2.27 | 1.97 | 1.93 | 1.91 | 1.84 | 1.78 | 1.86 | 1.78 | 1.84 | 1.75 | 1.69 | 1.69 | 1.67 | 1.69 | 1.51 | |
| Sinop | 220 799 | 4.35 | 2.48 | 1.91 | 1.81 | 1.77 | 1.84 | 1.75 | 1.79 | 1.72 | 1.70 | 1.70 | 1.61 | 1.60 | 1.56 | 1.47 | 1.41 |
| Samsun | 1 368 488 | 2.55 | 1.87 | 1.81 | 1.77 | 1.83 | 1.83 | 1.85 | 1.82 | 1.80 | 1.78 | 1.75 | 1.65 | 1.51 | 1.43 | 1.38 | |
| Tokat | 596 454 | 3.06 | 1.95 | 1.92 | 1.83 | 1.79 | 1.82 | 1.82 | 1.74 | 1.70 | 1.67 | 1.63 | 1.61 | 1.47 | 1.42 | 1.39 | |
| Çorum | 524 130 | 2.66 | 1.93 | 1.90 | 1.86 | 1.96 | 1.89 | 1.97 | 1.85 | 1.86 | 1.79 | 1.73 | 1.68 | 1.57 | 1.52 | 1.45 | |
| Amasya | 338 267 | 2.34 | 1.80 | 1.75 | 1.71 | 1.75 | 1.78 | 1.75 | 1.80 | 1.70 | 1.72 | 1.66 | 1.60 | 1.48 | 1.46 | 1.38 | |
| East Black Sea | 2 690 038 | 1.86 | 1.81 | 1.77 | 1.78 | 1.77 | 1.80 | 1.78 | 1.76 | 1.71 | 1.68 | 1.60 | 1.51 | 1.45 | 1.39 | ||
| Trabzon | 818 023 | 2.10 | 1.87 | 1.82 | 1.78 | 1.80 | 1.79 | 1.84 | 1.86 | 1.85 | 1.82 | 1.79 | 1.68 | 1.56 | 1.53 | 1.43 | |
| Ordu | 763 190 | 2.81 | 1.94 | 1.89 | 1.84 | 1.86 | 1.85 | 1.89 | 1.83 | 1.84 | 1.81 | 1.72 | 1.67 | 1.56 | 1.44 | 1.44 | |
| Giresun | 450 862 | 2.31 | 1.74 | 1.74 | 1.65 | 1.66 | 1.64 | 1.65 | 1.64 | 1.57 | 1.56 | 1.55 | 1.49 | 1.40 | 1.33 | 1.32 | |
| Rize | 344 016 | 2.01 | 1.80 | 1.76 | 1.75 | 1.73 | 1.80 | 1.79 | 1.79 | 1.79 | 1.75 | 1.76 | 1.65 | 1.57 | 1.53 | 1.41 | |
| Artvin | 169 403 | 2.24 | 1.73 | 1.72 | 1.67 | 1.78 | 1.73 | 1.78 | 1.74 | 1.77 | 1.72 | 1.64 | 1.60 | 1.57 | 1.40 | 1.39 | |
| Gümüşhane | 144 544 | 2.92 | 2.09 | 1.88 | 1.89 | 1.84 | 1.84 | 1.84 | 1.72 | 1.62 | 1.37 | 1.33 | 1.35 | 1.38 | 1.35 | 1.30 | |
| Northeast Anatolia | 2 154 748 | 2.91 | 2.97 | 2.90 | 2.90 | 2.85 | 2.90 | 2.79 | 2.72 | 2.64 | 2.44 | 2.36 | 2.18 | 2.11 | 1.92 | ||
| Erzurum | 749 754 | 3.51 | 2.51 | 2.49 | 2.50 | 2.50 | 2.49 | 2.60 | 2.51 | 2.45 | 2.40 | 2.24 | 2.15 | 2.02 | 1.95 | 1.80 | |
| Erzincan | 239 223 | 2.54 | 1.82 | 1.82 | 1.91 | 1.88 | 1.89 | 1.82 | 1.82 | 1.89 | 1.73 | 1.63 | 1.65 | 1.53 | 1.58 | 1.39 | |
| Bayburt | 84 241 | 3.29 | 2.38 | 2.31 | 2.16 | 2.30 | 2.13 | 2.18 | 2.09 | 1.96 | 1.83 | 1.84 | 1.71 | 1.61 | 1.60 | 1.42 | |
| Ağrı | 510 626 | 5.49 | 4.22 | 4.38 | 4.13 | 4.11 | 4.01 | 4.04 | 3.84 | 3.73 | 3.63 | 3.28 | 3.18 | 2.89 | 2.73 | 2.51 | |
| Kars | 274 829 | 3.76 | 2.90 | 3.05 | 2.88 | 2.92 | 2.74 | 2.75 | 2.64 | 2.59 | 2.54 | 2.35 | 2.25 | 2.10 | 1.98 | 1.86 | |
| Iğdır | 203 594 | 4.17 | 3.06 | 3.16 | 3.12 | 3.10 | 3.21 | 3.19 | 3.05 | 2.98 | 2.81 | 2.70 | 2.56 | 2.27 | 2.22 | 1.99 | |
| Ardahan | 92 481 | 2.95 | 2.35 | 2.25 | 2.25 | 2.21 | 2.11 | 2.24 | 2.17 | 2.01 | 2.05 | 1.91 | 1.88 | 1.74 | 1.82 | 1.63 | |
| Central East Anatolia | 3 928 271 | 3.00 | 2.95 | 2.85 | 2.82 | 2.83 | 2.87 | 2.75 | 2.67 | 2.65 | 2.52 | 2.43 | 2.23 | 2.12 | 2.01 | ||
| Malatya | 812 580 | 3.66 | 2.56 | 2.08 | 2.06 | 1.99 | 1.99 | 1.96 | 2.05 | 2.01 | 1.99 | 1.99 | 1.90 | 1.80 | 1.66 | 1.64 | 1.59 |
| Elazığ | 591 497 | 2.52 | 2.02 | 1.98 | 1.98 | 1.97 | 1.93 | 2.04 | 1.99 | 1.96 | 1.95 | 1.86 | 1.79 | 1.71 | 1.60 | 1.51 | |
| Bingöl | 282 556 | 3.56 | 2.56 | 2.55 | 2.52 | 2.49 | 2.49 | 2.63 | 2.42 | 2.44 | 2.39 | 2.37 | 2.26 | 2.10 | 1.99 | 1.80 | |
| Tunceli | 84 366 | 4.87 | 1.90 | 1.56 | 1.47 | 1.50 | 1.53 | 1.55 | 1.62 | 1.69 | 1.58 | 1.56 | 1.64 | 1.69 | 1.57 | 1.49 | 1.40 |
| Van | 1 128 749 | 6.00 | 3.93 | 3.84 | 3.66 | 3.58 | 3.64 | 3.54 | 3.37 | 3.20 | 3.15 | 2.96 | 2.85 | 2.56 | 2.35 | 2.28 | |
| Muş | 399 202 | 4.18 | 3.93 | 3.94 | 3.66 | 3.65 | 3.59 | 3.71 | 3.49 | 3.37 | 3.42 | 3.25 | 3.16 | 2.85 | 2.77 | 2.53 | |
| Bitlis | 353 988 | 6.01 | 5.03 | 3.80 | 3.71 | 3.52 | 3.49 | 3.44 | 3.47 | 3.40 | 3.30 | 3.23 | 3.07 | 2.90 | 2.70 | 2.65 | 2.48 |
| Hakkâri | 275 333 | 6.69 | 3.35 | 3.18 | 3.14 | 2.99 | 3.01 | 3.03 | 2.76 | 2.60 | 2.56 | 2.42 | 2.35 | 2.16 | 2.05 | 1.99 | |
| Southeast Anatolia | 9 305 910 | 3.59 | 3.57 | 3.48 | 3.53 | 3.48 | 3.63 | 3.52 | 3.38 | 3.36 | 3.23 | 3.02 | 2.84 | 2.86 | 2.71 | ||
| Gaziantep | 2 154 051 | 3.83 | 3.15 | 3.07 | 3.04 | 3.15 | 3.17 | 3.28 | 3.19 | 3.06 | 2.93 | 2.85 | 2.62 | 2.47 | 2.48 | 2.39 | |
| Adıyaman | 635 169 | 3.66 | 2.76 | 2.79 | 2.77 | 2.79 | 2.75 | 2.90 | 2.87 | 2.78 | 2.79 | 2.69 | 2.56 | 2.36 | 2.36 | 2.24 | |
| Kilis | 147 919 | 3.54 | 2.93 | 3.01 | 2.83 | 2.99 | 2.96 | 3.13 | 3.03 | 2.87 | 2.83 | 2.75 | 2.55 | 2.48 | 2.47 | 2.34 | |
| Şanlıurfa | 2 170 110 | 4.83 | 4.57 | 4.58 | 4.46 | 4.47 | 4.41 | 4.57 | 4.42 | 4.35 | 4.33 | 4.15 | 3.90 | 3.71 | 3.82 | 3.59 | |
| Diyarbakır | 1 804 880 | 4.51 | 3.23 | 3.24 | 3.19 | 3.23 | 3.16 | 3.30 | 3.22 | 3.13 | 3.13 | 2.97 | 2.79 | 2.54 | 2.54 | 2.42 | |
| Mardin | 870 374 | 4.98 | 3.46 | 3.53 | 3.35 | 3.46 | 3.33 | 3.55 | 3.46 | 3.26 | 3.28 | 3.15 | 3.00 | 2.76 | 2.79 | 2.62 | |
| Batman | 634 491 | 5.27 | 3.70 | 3.64 | 3.43 | 3.42 | 3.34 | 3.41 | 3.25 | 3.11 | 3.08 | 2.90 | 2.72 | 2.55 | 2.57 | 2.39 | |
| Şırnak | 557 605 | 7.06 | 4.69 | 4.51 | 4.26 | 4.21 | 4.19 | 4.27 | 4.09 | 3.51 | 3.76 | 3.63 | 3.39 | 3.23 | 3.19 | 2.94 | |
| Siirt | 331 311 | 6.05 | 4.23 | 4.12 | 3.96 | 3.85 | 3.70 | 3.89 | 3.56 | 3.47 | 3.33 | 3.18 | 2.93 | 2.88 | 2.71 | 2.47 |
Structure of the population
Structure of the population (31.XII.2015) (Data based on Address Based Population Registration System.):[21][22][23]
| Age group | Male | Female | Total | Percent |
|---|---|---|---|---|
| Total | 39,511,191 | 39,229,862 | 78,741,053 | 100 |
| 0–4 | 3,275,520 | 3,105,996 | 6,381,516 | 8.10 |
| 5–9 | 3,252,811 | 3,084,908 | 6,337,719 | 8.05 |
| 10–14 | 3,166,860 | 3,000,125 | 6,166,985 | 7.83 |
| 15–19 | 3,382,363 | 3,203,137 | 6,585,500 | 8.36 |
| 20–24 | 3,224,168 | 3,089,999 | 6,314,167 | 8.02 |
| 25–29 | 3,178,350 | 3,084,899 | 6,263,249 | 7.95 |
| 30–34 | 3,252,171 | 3,175,879 | 6,428,150 | 8.16 |
| 35–39 | 3,134,041 | 3,069,282 | 6,203,323 | 7.88 |
| 40–44 | 2,788,425 | 2,764,155 | 5,552,580 | 7.05 |
| 45–49 | 2,337,087 | 2,252,992 | 4,590,079 | 5.83 |
| 50–54 | 2,317,534 | 2,315,375 | 4,632,909 | 5.88 |
| 55–59 | 1,843,354 | 1,837,816 | 3,681,170 | 4.68 |
| 60–64 | 1,515,065 | 1,593,402 | 3,108,467 | 3.95 |
| 65–69 | 1,100,734 | 1,255,651 | 2,356,385 | 2.99 |
| 70–74 | 737,892 | 888,292 | 1,626,184 | 2.07 |
| 75–79 | 501,411 | 682,335 | 1,183,746 | 1.50 |
| 80–84 | 339,904 | 470,584 | 810,488 | 1.03 |
| 85–89 | 128,879 | 261,571 | 390,450 | 0.50 |
| 90+ | 34,622 | 93,364 | 127,986 | 0.16 |
| Age group | Male | Female | Total | Percent |
|---|---|---|---|---|
| 0–14 | 9,695,191 | 9,191,029 | 18,886,220 | 23.99 |
| 15–64 | 26,972,558 | 26,387,036 | 53,359,594 | 67.77 |
| 65+ | 2,843,442 | 3,651,797 | 6,495,239 | 8.25 |
Structure of the population (31.XII.2016):
| Age group | Male | Female | Total | Percent |
|---|---|---|---|---|
| Total | 40,043,650 | 39,771,221 | 79,814,871 | 100 |
| 0–4 | 3,314,542 | 3,144,753 | 6,459,295 | 8.09 |
| 5–9 | 3,253,345 | 3,084,099 | 6,337,444 | 7.94 |
| 10–14 | 3,147,133 | 2,981,910 | 6,129,043 | 7.68 |
| 15–19 | 3,400,443 | 3,222,876 | 6,623,319 | 8.30 |
| 20–24 | 3,247,764 | 3,117,959 | 6,365,723 | 7.98 |
| 25–29 | 3,169,360 | 3,076,681 | 6,246,041 | 7.83 |
| 30–34 | 3,196,645 | 3,113,766 | 6,310,411 | 7.91 |
| 35–39 | 3,275,175 | 3,219,158 | 6,494,333 | 8.14 |
| 40–44 | 2,833,655 | 2,800,662 | 5,634,317 | 7.06 |
| 45–49 | 2,412,875 | 2,335,639 | 4,748,514 | 5.95 |
| 50–54 | 2,381,640 | 2,374,604 | 4,756,244 | 5.96 |
| 55–59 | 1,855,171 | 1,860,565 | 3,715,736 | 4.66 |
| 60–64 | 1,636,510 | 1,706,438 | 3,342,948 | 4.19 |
| 65–69 | 1,132,464 | 1,280,073 | 2,412,537 | 3.02 |
| 70–74 | 763,121 | 917,371 | 1,680,492 | 2.11 |
| 75–79 | 512,607 | 689,443 | 1,202,050 | 1.51 |
| 80–84 | 336,206 | 473,119 | 809,325 | 1.01 |
| 85–89 | 136,238 | 265,520 | 401,758 | 0.50 |
| 90+ | 38,756 | 106,585 | 145,341 | 0.18 |
| Age group | Male | Female | Total | Percent |
|---|---|---|---|---|
| 0–14 | 9,715,020 | 9,210,762 | 18,925,782 | 23.71 |
| 15–64 | 27,409,238 | 26,828,348 | 54,237,586 | 67.95 |
| 65+ | 2,919,392 | 3,732,111 | 6,651,503 | 8.33 |
Structure of the population (31.XII.2017):
| Age group | Male | Female | Total | Percent |
|---|---|---|---|---|
| Total | 40 535 135 | 40 275 390 | 80 810 525 | 100 |
| 0–4 | 3 326 591 | 3 155 258 | 6 481 849 | 8.02 |
| 5–9 | 3 254 177 | 3 086 592 | 6 340 769 | 7.85 |
| 10–14 | 3 188 333 | 3 022 537 | 6 210 870 | 7.69 |
| 15–19 | 3 351 043 | 3 175 544 | 6 526 587 | 8.08 |
| 20–24 | 3 294 336 | 3 162 174 | 6 456 510 | 7.99 |
| 25–29 | 3 163 889 | 3 067 653 | 6 231 542 | 7.71 |
| 30–34 | 3 189 075 | 3 107 849 | 6 296 924 | 7.79 |
| 35–39 | 3 308 413 | 3 252 283 | 6 560 696 | 8.12 |
| 40–44 | 2 891 799 | 2 849 020 | 5 740 819 | 7.10 |
| 45–49 | 2 556 364 | 2 498 790 | 5 055 154 | 6.26 |
| 50–54 | 2 349 139 | 2 326 316 | 4 675 455 | 5.79 |
| 55–59 | 1 977 328 | 1 989 399 | 3 966 727 | 4.91 |
| 60–64 | 1 651 215 | 1 720 023 | 3 371 238 | 4.17 |
| 65–69 | 1 188 986 | 1 322 918 | 2 511 904 | 3.11 |
| 70–74 | 784 614 | 952 653 | 1 737 267 | 2.15 |
| 75–79 | 533 757 | 715 428 | 1 249 185 | 1.55 |
| 80–84 | 330 240 | 471 436 | 801 676 | 0.99 |
| 85–89 | 152 317 | 282 516 | 434 833 | 0.54 |
| 90+ | 43 519 | 117 001 | 160 520 | 0.20 |
| Age group | Male | Female | Total | Percent |
|---|---|---|---|---|
| 0–14 | 9 769 101 | 9 264 387 | 19 033 488 | 23.55 |
| 15–64 | 27 732 601 | 27 149 051 | 54 881 652 | 67.91 |
| 65+ | 3 033 433 | 3 861 952 | 6 895 385 | 8.53 |
Structure of the population (31.XII.2018):
| Age group | Male | Female | Total | Percent |
|---|---|---|---|---|
| Total | 41 139 980 | 40 863 902 | 82 003 882 | 100 |
| 0–4 | 3 327 780 | 3 157 206 | 6 484 986 | 7.91% |
| 5–9 | 3 264 608 | 3 094 412 | 6 358 920 | 7.75% |
| 10–14 | 3 254 277 | 3 086 146 | 6 340 423 | 7.73% |
| 15–19 | 3 299 449 | 3 124 818 | 6 424 267 | 7.83% |
| 20–24 | 3 347 297 | 3 199 832 | 6 547 129 | 7.98% |
| 25–29 | 3 190 023 | 3 086 446 | 6 276 469 | 7.65% |
| 30–34 | 3 205 205 | 3 127 948 | 6 333 153 | 7.72% |
| 35–39 | 3 316 603 | 3 259 469 | 6 576 072 | 8.02% |
| 40–44 | 2 953 329 | 2 892 697 | 5 846 026 | 7.13% |
| 45–49 | 2 670 183 | 2 640 524 | 5 310 707 | 6.48% |
| 50–54 | 2 372 182 | 2 329 142 | 4 701 324 | 5.73% |
| 55–59 | 2 076 882 | 2 095 459 | 4 172 341 | 5.09% |
| 60–64 | 1 692 130 | 1 753 731 | 3 445 861 | 4.20% |
| 65–69 | 1 245 979 | 1 366 228 | 2 612 207 | 3.19% |
| 70–74 | 835 353 | 1 021 569 | 1 856 922 | 2.26% |
| 75–79 | 539 825 | 722 725 | 1 262 550 | 1.54% |
| 80–84 | 318 882 | 474 854 | 793 736 | 0.97% |
| 85–89 | 182 957 | 302 957 | 485 914 | 0.59% |
| 90+ | 47 136 | 127 739 | 174 875 | 0.21% |
| Age group | Male | Female | Total | Percent |
|---|---|---|---|---|
| 0–14 | 9 846 565 | 9 337 764 | 19 184 329 | 23.39% |
| 15–64 | 28 123 283 | 27 510 066 | 55 633 349 | 67.84% |
| 65+ | 3 170 132 | 4 016 072 | 7 186 204 | 8.76% |
Structure of the population (31.XII.2019):
| Age group | Male | Female | Total | Percent |
|---|---|---|---|---|
| Total | 41 721 136 | 41 433 861 | 83 154 997 | 100 |
| 0–4 | 3 254 719 | 3 090 417 | 6 345 136 | 7.63% |
| 5–9 | 3 316 621 | 3 144 418 | 6 461 039 | 7.77% |
| 10–14 | 3 288 207 | 3 117 963 | 6 406 170 | 7.70% |
| 15–19 | 3 254 891 | 3 076 703 | 6 331 594 | 7.61% |
| 20–24 | 3 392 374 | 3 231 704 | 6 624 078 | 7.97% |
| 25–29 | 3 240 657 | 3 126 654 | 6 367 311 | 7.66% |
| 30–34 | 3 221 381 | 3 141 636 | 6 363 017 | 7.65% |
| 35–39 | 3 324 759 | 3 260 084 | 6 584 843 | 7.92% |
| 40–44 | 3 016 898 | 2 950 486 | 5 967 384 | 7.18% |
| 45–49 | 2 772 838 | 2 760 721 | 5 533 559 | 6.65% |
| 50–54 | 2 367 577 | 2 307 796 | 4 675 373 | 5.62% |
| 55–59 | 2 178 454 | 2 211 543 | 4 389 997 | 5.28% |
| 60–64 | 1 754 500 | 1 800 269 | 3 554 769 | 4.27% |
| 65–69 | 1 301 371 | 1 421 301 | 2 722 672 | 3.27% |
| 70–74 | 907 850 | 1 109 063 | 2 016 913 | 2.43% |
| 75–79 | 560 695 | 747 604 | 1 308 299 | 1.57% |
| 80–84 | 323 732 | 493 998 | 817 730 | 0.98% |
| 85–89 | 192 938 | 304 472 | 497 410 | 0.60% |
| 90+ | 50 674 | 137 029 | 187 703 | 0.23% |
| Age group | Male | Female | Total | Percent |
|---|---|---|---|---|
| 0–14 | 9 859 547 | 9 352 798 | 19 212 345 | 23.10% |
| 15–64 | 28 524 329 | 27 867 596 | 56 391 925 | 67.82% |
| 65+ | 3 337 260 | 4 213 467 | 7 550 727 | 9.08% |
Population Estimates by Sex and Age Group (31.XII.2020):[24]
| Age Group | Male | Female | Total | % |
|---|---|---|---|---|
| Total | 41 915 985 | 41 698 377 | 83 614 362 | 100 |
| 0–4 | 3 140 172 | 2 981 535 | 6 121 707 | 7.32 |
| 5–9 | 3 349 253 | 3 177 340 | 6 526 593 | 7.81 |
| 10–14 | 3 294 985 | 3 124 952 | 6 419 937 | 7.68 |
| 15–19 | 3 201 588 | 3 028 526 | 6 230 114 | 7.45 |
| 20–24 | 3 408 434 | 3 255 202 | 6 663 636 | 7.97 |
| 25–29 | 3 240 543 | 3 130 411 | 6 370 954 | 7.62 |
| 30–34 | 3 199 710 | 3 119 184 | 6 318 894 | 7.56 |
| 35–39 | 3 270 512 | 3 203 071 | 6 473 583 | 7.74 |
| 40–44 | 3 145 645 | 3 089 465 | 6 235 110 | 7.46 |
| 45–49 | 2 788 035 | 2 775 631 | 5 563 666 | 6.65 |
| 50–54 | 2 325 190 | 2 259 442 | 4 584 632 | 5.48 |
| 55–59 | 2 273 088 | 2 304 499 | 4 577 587 | 5.47 |
| 60–64 | 1 764 938 | 1 809 456 | 3 574 394 | 4.27 |
| 65–69 | 1 399 052 | 1 539 663 | 2 938 715 | 3.51 |
| 70–74 | 960 742 | 1 170 963 | 2 131 705 | 2.55 |
| 75–79 | 583 671 | 771 675 | 1 355 346 | 1.62 |
| 80–84 | 339 767 | 521 432 | 861 199 | 1.03 |
| 85–89 | 177 532 | 289 216 | 466 748 | 0.56 |
| 90+ | 53 128 | 146 714 | 199 842 | 0.24 |
| Age group | Male | Female | Total | Percent |
| 0–14 | 9 784 410 | 9 283 827 | 19 068 237 | 22.80 |
| 15–64 | 28 617 683 | 27 974 887 | 56 592 570 | 67.68 |
| 65+ | 3 513 892 | 4 439 663 | 7 953 555 | 9.51 |
Population Estimates by Sex and Age Group (31.XII.2021):[24]
| Age Group | Male | Female | Total | % |
|---|---|---|---|---|
| Total | 42 428 101 | 42 252 172 | 84 680 273 | 100 |
| 0–4 | 3 033 029 | 2 880 580 | 5 913 609 | 6.98 |
| 5–9 | 3 398 812 | 3 225 390 | 6 624 202 | 7.82 |
| 10–14 | 3 304 851 | 3 133 301 | 6 438 152 | 7.60 |
| 15–19 | 3 203 519 | 3 026 190 | 6 229 709 | 7.36 |
| 20–24 | 3 445 410 | 3 296 170 | 6 741 580 | 7.96 |
| 25–29 | 3 296 919 | 3 179 980 | 6 476 899 | 7.65 |
| 30–34 | 3 212 668 | 3 129 119 | 6 341 787 | 7.49 |
| 35–39 | 3 228 063 | 3 158 145 | 6 386 208 | 7.54 |
| 40–44 | 3 294 071 | 3 253 091 | 6 547 162 | 7.73 |
| 45–49 | 2 838 766 | 2 823 495 | 5 662 261 | 6.69 |
| 50–54 | 2 403 726 | 2 350 758 | 4 754 484 | 5.61 |
| 55–59 | 2 337 304 | 2 369 876 | 4 707 180 | 5.56 |
| 60–64 | 1 776 254 | 1 835 662 | 3 611 916 | 4.27 |
| 65–69 | 1 508 990 | 1 647 458 | 3 156 448 | 3.73 |
| 70–74 | 982 573 | 1 192 451 | 2 175 024 | 2.57 |
| 75–79 | 598 307 | 794 411 | 1 392 718 | 1.64 |
| 80–84 | 340 568 | 520 841 | 861 409 | 1.02 |
| 85–89 | 169 807 | 286 741 | 456 548 | 0.54 |
| 90+ | 54 464 | 148 513 | 202 977 | 0.24 |
| Age group | Male | Female | Total | Percent |
| 0–14 | 9 736 692 | 9 239 271 | 18 975 963 | 22.41 |
| 15–64 | 29 036 700 | 28 422 486 | 57 459 186 | 67.85 |
| 65+ | 3 654 709 | 4 590 415 | 8 245 124 | 9.74 |
Population Estimates by Sex and Age Group (31.XII.2022):[24]
| Age Group | Male | Female | Total | % |
|---|---|---|---|---|
| Total | 42 704 112 | 42 575 441 | 85 279 553 | 100 |
| 0–4 | 2 904 379 | 2 759 241 | 5 663 620 | 6.64 |
| 5–9 | 3 404 972 | 3 230 105 | 6 635 077 | 7.78 |
| 10–14 | 3 303 371 | 3 133 043 | 6 436 414 | 7.55 |
| 15–19 | 3 244 500 | 3 070 609 | 6 315 109 | 7.41 |
| 20–24 | 3 388 724 | 3 245 984 | 6 634 708 | 7.78 |
| 25–29 | 3 334 439 | 3 218 730 | 6 553 169 | 7.68 |
| 30–34 | 3 199 028 | 3 116 019 | 6 315 047 | 7.41 |
| 35–39 | 3 215 451 | 3 151 290 | 6 366 741 | 7.47 |
| 40–44 | 3 321 873 | 3 284 156 | 6 606 029 | 7.75 |
| 45–49 | 2 893 831 | 2 869 703 | 5 763 534 | 6.76 |
| 50–54 | 2 543 588 | 2 511 036 | 5 054 624 | 5.93 |
| 55–59 | 2 305 846 | 2 321 295 | 4 627 141 | 5.53 |
| 60–64 | 1 893 862 | 1 962 809 | 3 856 671 | 4.52 |
| 65-69 | 1 523 412 | 1 661 877 | 3 185 289 | 3.74 |
| 70-74 | 1 031 897 | 1 232 222 | 2 264 119 | 2.65 |
| 75+ | 1 194 939 | 1 807 322 | 3 002 261 | 3.52 |
| Age group | Male | Female | Total | Percent |
| 0–14 | 9 612 722 | 9 122 389 | 18 735 111 | 21.97 |
| 15–64 | 29 341 142 | 28 751 631 | 58 092 773 | 68.12 |
| 65+ | 3 750 248 | 4 701 421 | 8 451 669 | 9.91 |
Immigration
Immigration to Turkey is the process by which people migrate to Turkey to reside in the country. After the dissolution of the Ottoman Empire and following Turkish War of Independence, an exodus by the large portion of Turkish (Turkic) and Muslim peoples from the Balkans (Balkan Turks, Albanians, Bosniaks, Pomaks), Caucasus (Abkhazians, Ajarians, Circassians, Chechens), Crimea (Crimean Tatar diaspora), and Crete (Cretan Turks) took refuge in present-day Turkey and moulded the country's fundamental features. Trends of immigration towards Turkey continue to this day, although the motives are more varied and are usually in line with the patterns of global immigration movements — Turkey, for example, receives many economic migrants from nearby countries such as Armenia, the Moldova, Georgia, Iran, and Azerbaijan, but also from Central Asia, Ukraine and Russia. Turkey's migrant crisis during the 2010s saw high numbers of people arriving in Turkey, particularly those fleeing the Syrian civil war.
As of August 2023, the number of refugees of the Syrian civil war in Turkey was estimated to be 3,307,882 people. The number of Syrians had decreased by 205,894 people since the beginning of the year.[25] In 2022, nearly 100 000 Russian citizens migrated to Turkey, becoming the first in the list of foreigners who moved to Turkey, meaning an increase of more than 218% from 2021.[26]
In order to obtain Turkish citizenship there is a range of legal grounds, which can include: reunification with their family, marriage to a Turkish citizen, for the purchase of real estate worth $400,000 from a Turkish citizen or company.[27] The minimum investment amount was increased in May 2022, previously it was enough to invest $250,000. Also the basis is to work in Turkey, training, business, medical treatment, refugee status.
Population in Turkey by country of citizenship by the end of each years:[24]
| Country | 2022 | 2021 | 2020 |
|---|---|---|---|
| Total people living in Turkey | 85 279 553 | 84 680 273 | 83 614 362 |
| 83 455 717 (97.86%) | 82 888 237 (97.88%) | 82 280 952 (98.41%) | |
| Total foreign population | 1 823 836 (2.14%) | 1 792 036 (2.12%) | 1 333 410 (1.59%) |
| 275 305 (0.32%) | 322 015 (0.38%) | 281 074 (0.34%) | |
| 186 160 (0.22%) | 183 567 (0.22%) | 158 252 (0.19%) | |
| 151 049 (0.18%) | 66 786 (0.08%) | 43 679 (0.05%) | |
| 117 026 (0.14%) | 128 883 (0.15%) | 68 561 (0.08%) | |
| 116 447 (0.14%) | 123 965 (0.15%) | 91 218 (0.11%) | |
| 110 453 (0.13%) | 102 592 (0.12%) | 92 284 (0.11%) | |
| 99 360 (0.12%) | 104 554 (0.12%) | 88 907 (0.11%) | |
| 68 884 (0.08%) | 68 562(0.08%) | 48 495 (0.06%) | |
| 61 754 (0.07%) | 71 145 (0.08%) | 36 510 (0.04%) | |
| 50 357 (0.06%) | 23 377 (0.03%) | 17 505 (0.02%) | |
| 45 530 (0.05%) | 39 454 (0.05%) | 23 645 (0.03%) | |
| 33 040 (0.04%) | 34 162 (0.04%) | 25 475 (0.03%) | |
| 26 278 (0.03%) | 28 027 (0.03%) | 17 915 (0.02%) | |
| 24 485 (0.03%) | 26 541 (0.03%) | 18 019 (0.02%) | |
| 22 733 (0.03%) | 23 656 (0.03%) | 14 260 (0.02%) | |
| 21 677 (0.03%) | 24 188 (0.03%) | 18 607 (0.02%) | |
| 21 311 (0.02%) | 19 900 (0.02%) | 18 047 (0.02%) | |
| 20 906 (0.02%) | 28 081 (0.03%) | 17 245 (0.02%) | |
| 19 099 (0.02%) | 18 094 (0.02%) | 14 927 (0.02%) | |
| 18 482 (0.02%) | 20 520 (0.02%) | 12 122 (0.01%) | |
| 17 193 (0.02%) | 16 440 (0.02%) | 13 985 (0.02%) | |
| 16 880 (0.02%) | 20 486 (0.02%) | 18 740 (0.02%) | |
| 16 612 (0.02%) | 15 426 (0.02%) | 14 195 (0.02%) | |
| 16 505 (0.02%) | 17 290 (0.02%) | 7 248 (0.01%) | |
| 14 680 (0.02%) | 19 276 (0.02%) | 15 661 (0.02%) | |
| 13 583 (0.02%) | 12 569 (0.01%) | 12 137 (0.01%) | |
| 12 928 (0.02%) | 12 920 (0.02%) | 7 120 (0.01%) | |
| 12 793 (0.02%) | 12 773 (0.02%) | 9 032 (0.01%) | |
| 12 430 (0.01%) | 13 242 (0.02%) | 5 943 (0.01%) | |
| 12 248 (0.01%) | 10 698 (0.01%) | 5 914 (0.01%) | |
| 11 613 (0.01%) | 9 538 (0.01%) | 3 193 (<0.01%) | |
| 11 280 (0.01%) | 10 219 (0.01%) | 5 226 (0.01%) | |
| 8 104 (0.01%) | 7 686 (0.01%) | 6 550 (0.01%) | |
| 7 153 (0.01%) | 7 965 (0.01%) | 3 626 (<0.01%) | |
| 6 790 (0.01%) | 7 546 (0.01%) | 6 295 (0.01%) | |
| 6 190 (0.01%) | 5 498 (0.01%) | 3 559 (<0.01%) | |
| 6 165 (0.01%) | 6 633 (0.01%) | 2 936 (<0.01%) | |
| 6 075 (0.01%) | 6 033 (0.01%) | 2 961 (<0.01%) | |
| 5 169 (0.01%) | 3 873 (<0.01%) | ||
| 4 669 (0.01%) | 3 092 (<0.01%) | ||
| 4 526 (0.01%) | 4 294 (0.01%) | 3 181 (<0.01%) | |
Internal migration
| Regions | İstanbul | West Marmara | Aegean | East Marmara | West Anatolia | Mediterranean | Central Anatolia | West Black Sea | East Black Sea | Northeast Anatolia | Central East Anatolia | Southeast Anatolia | Total Population |
|---|---|---|---|---|---|---|---|---|---|---|---|---|---|
| İstanbul | 2,162,588 | 79,009 | 72,123 | 84,689 | 38,802 | 38,673 | 4,858 | 11,976 | 9,147 | 3,533 | 3,667 | 4,754 | 2,513,819 |
| West Marmara | 523,725 | 2,378,938 | 187,256 | 135,364 | 44,409 | 27,376 | 5,140 | 10,238 | 4,513 | 5,273 | 7,110 | 8,861 | 3,338,203 |
| Aegean | 297,143 | 76,518 | 7,047,801 | 210,522 | 134,073 | 166,785 | 16,606 | 22,252 | 10,354 | 14,936 | 20,388 | 28,224 | 8,045,602 |
| East Marmara | 520,698 | 67,299 | 131,586 | 4,317,877 | 187,043 | 61,782 | 10,715 | 33.371 | 10,701 | 8,074 | 9,775 | 12,286 | 5,371,207 |
| West Anatolia | 272,835 | 35,919 | 259,387 | 127,794 | 3,721,634 | 192,934 | 49,942 | 29,545 | 8,468 | 10,360 | 13,727 | 20,850 | 4,743,395 |
| Mediterranean | 470,673 | 53,295 | 250,529 | 111,393 | 228,398 | 7,329,964 | 100,729 | 32,461 | 16,963 | 21,667 | 46,013 | 181,874 | 8,843,959 |
| Central Anatolia | 1,346,007 | 92,421 | 297,114 | 235,407 | 1,223,857 | 305,343 | 3,466,971 | 70,729 | 16,604 | 20,204 | 32,153 | 36,818 | 7,143,628 |
| West Black Sea | 2,637,016 | 186,103 | 252,628 | 458,730 | 956,151 | 133,053 | 54,578 | 3,982,185 | 42,935 | 18,878 | 21,757 | 27,735 | 8,771,749 |
| East Black Sea | 1,918,805 | 96,494 | 152,843 | 529,110 | 241,801 | 70,823 | 19,104 | 198,869 | 2,382,704 | 33,854 | 11,852 | 13,140 | 5,669,399 |
| Northeast Anatolia | 1,580,876 | 120,086 | 504,588 | 593,882 | 344,929 | 101,600 | 63,029 | 34,656 | 32,761 | 2,009,253 | 39,921 | 20,576 | 5,446,157 |
| Central East Anatolia | 1,293,157 | 86,315 | 359,161 | 299,390 | 167,451 | 393,102 | 31,612 | 22,064 | 11,070 | 31,709 | 3,438,577 | 133,862 | 6,267,470 |
| Southeast Anatolia | 1,197,959 | 65,538 | 445,279 | 174,765 | 156,489 | 1,002,771 | 33,876 | 23,666 | 11,689 | 22,036 | 150,028 | 7,738,941 | 11,023,037 |
| Total population | 14,221,482 | 3,337,935 | 9,960,295 | 7,278,923 | 7,445,037 | 9,824,206 | 3,857,160 | 4,472,012 | 2,557,909 | 2,199,777 | 3,794,968 | 8,227,921 | 77,177,625 |
Ethnicity
Modern Turkey was founded by Mustafa Kemal Atatürk as secular (Laiklik, Turkish adaptation of French Laïcité), i.e. without a state religion, or separate ethnic divisions/ identities. The concept of "minorities" has only been accepted by the Republic of Turkey as defined by the Treaty of Lausanne (1923) and thence strictly limited to Greeks, Jews and Armenians, only based on religious affiliation, excluding from the scope of the concept the ethnic identities of these minorities as of others such as the Kurds who make up 15% of the country; others include Assyrians/Syriacs of various Christian denominations, Alevis and all the others.[29][30][31][32] Provisions of the Lausanne Treaty were extended to Bulgarians in Turkey by the Turkey-Bulgaria Friendship Treaty (Türkiye ve Bulgaristan Arasındaki Dostluk Antlaşması) of 18 October 1925.[31][33][34][35] According to the Ministry of Foreign Affairs (Turkey), as of 2008, there were 89,000 Turkish citizens belonging to one of the three recognized minorities, two thirds of Armenian descent.[36] On 18 June 2013, the Ankara 13th Circuit Administrative Court unanimously ruled that the Assyrians were included as beneficiaries of the Lausanne Treaty,[37] so that Assyrians were allowed to open the first school teaching in their mother tongue.[38][39]
There are many reports from sources such as (Human Rights Watch, European Parliament, European Commission, national parliaments in EU member states, Amnesty International etc.) on persistent yet declining discrimination.
Certain current trends are:
- Turkish imams get salaries from the state, whereas Turkish Alevi as well as non-Orthodox and non-Armenian clerics are not paid.
- Imams can be trained freely at the numerous religious schools and theology departments of universities throughout the country; minority religions cannot re-open schools for training of their local clerics due to legislation and international treaties dating back to the end of Turkish War of Independence. The closing of the Theological School of Halki is a sore bone of contention between Turkey and the Eastern Orthodox world;
- Turkey has recently engaged in promulgating a series of legal enactments aiming at removal of the procedural hurdles before the use of several local languages spoken by Turkish citizens such as Kurdish (Kurmanji), Arabic and Zaza as medium of public communication, together with several other smaller ethnic group languages. A few private Kurdish teaching centers have recently been allowed to open. Kurdish-language TV broadcasts on 24/7 basis at the public frequency denominated in the government-owned TRT 6, while the private national channels show no interest yet. However, there are already several satellite Kurdish TV stations operating from Kurdish Autonomous Region at Northern Iraq and Western Europe, broadcasting in Kurdish, Turkish and Neo-Aramaic languages, Kurdistan TV, KurdSAT, etc.;
- Non-Muslim minority numbers are said to be falling rapidly, mainly as a result of aging, migration (to Israel, Greece, the United States and Western Europe).
- There is concern over the future of the Greek Orthodox Patriarchate, which suffers from a lack of trained clergy due to the closure of the Halki school. The state does not recognise the Ecumenical status of the Patriarch of Constantinople.
Languages
No exact data is available concerning the different ethnic groups in Turkey. The last census data according to language date from 1965 and major changes may have occurred since then. However, it is clear that the Turkish are in the majority, while the largest minority groups are Kurds and Arabs. Smaller minorities are the Armenians, Greeks and others.
| Language | Census 1935[40] | Census 1945[41] | Census 1965[41] | |||
|---|---|---|---|---|---|---|
| Number | % | Number | % | Number | % | |
| Turkish | 13,828,000 | 85.58 | 16,598,037 | 88.3 | 28,175,579 | 90.2 |
| Kurdish | 1,480,246 | 9.16 | 1,476,562 | 7.9 | 2,108,721 | 6.9 |
| Zazaki | 147,707 | 0.5 | ||||
| Arabic | 153,687 | 0.95 | 247,294 | 1.3 | 368,971 | 1.2 |
| Greek | 108,725 | 0.67 | 88,680 | 0.5 | 49,143 | 0.2 |
| Circassian | 91,972 | 0.57 | 66,691 | 0.4 | 57,337 | 0.2 |
| Ladino | 79,000 | 0.49 | 51,019 | 0.3 | 9,124 | 0.0 |
| Armenian | 57,599 | 0.36 | 47,728 | 0.3 | 32,484 | 0.1 |
| Laz | 63,253 | 0.39 | 39,323 | 0.3 | 27,715 | 0.1 |
| Georgian | 57,325 | 0.35 | 40,076 | 0.2 | 32,334 | 0.1 |
| Abaza | 10,099 | 0.06 | 8,602 | 0.0 | 10,643 | 0.0 |
| Total | 16,157,450 | 18,790,174 | 31,391,207 | |||
The word Turk or Turkish also has a wider meaning in a historical context because, at times, especially in the past, it has been used to refer to all Muslim inhabitants of the Ottoman Empire irrespective of their ethnicity.[42]
A possible list of ethnic groups living in Turkey could be as follows:[43]
- Turkic-speaking peoples: Turks, Azerbaijanis, Tatars, Karachays, Uzbeks, Crimean Tatars and Uyghurs
- Indo-European-speaking peoples: Kurds, Zazas,[44] Megleno-Romanians,[45] Bosniaks, Albanians, Pomaks, Ossetians, Armenians, Hamshenis, Goranis and Greeks
- Semitic-speaking peoples: Arabs, Jews and Assyrians/Syriacs
- Caucasian-speaking peoples: Circassians, Georgians, Lazs and Chechens
According to the 2016 edition of the CIA World Factbook, 70–75% of Turkey's population consists of ethnic Turks, with Kurds accounting for 19% and other minorities between 6 and 11%.[46] According to Milliyet, a 2008 report prepared for the National Security Council of Turkey by academics of three Turkish universities in eastern Anatolia suggested that there are approximately 55 million ethnic Turks, 9.6 million Kurds, 3 million Zazas, 2.5 million Circassians, 2 million Bosniaks, 500,000–1.3 million Albanians, 1,000,000 Georgians, 870,000 Arabs, 600,000 Pomaks, 80,000 Laz, 60,000 Armenians, 30,000 British, 25,000 Assyrians/Syriacs, 20,000 Jews, and 15,000 Greeks, 500 Yazidis living in Turkey.[47]
According to a survey published in 2022 by Konda Research, Turks make up 77% of the population, while 19% self-identify as Kurd. Arabs (Syrian refugees excluded) make up 2%, and other ethnic groups are 2% of the population.[48]
Since the immigration to the big cities in the west of Turkey, interethnic marriage has become more common. A recent study estimates that there are 2,708,000 marriages between Turks and Kurds.[49]
According to a survey done in March 2020 by Area Araştırma, 20.4% of the total population of Turkey claim to be Kurdish (either Kurmanji speaking or Zazaki speaking).
Ethnolinguistic estimates in 2014 by Ethnologue and Jacques Leclerc:[50][51][45]
| People | Population | Percentage | Language | Status |
|---|---|---|---|---|
| Anatolian Turks | 53,402,000 | 70.6% | Turkish | 1 (National) |
| Kurmanji Kurds | 8,127,000 | 10.7% | Kurmanji | 3 (Wider communication) |
| Turcophones, Kurds | 5,881,000 | 7.7% | Turkish | 1 (National) |
| Zaza | 1,155,000 | 1.5% | Zaza | 5 (Developing) |
| Lebanese Arabs | 1,133,000 | 1.4% | Levantine Arabic | |
| Kabardians, Circassians | 1,062,000 | 1.4 % | Kabardian | 5 (Developing) |
| Iraqi Arabs | 722,000 | 0.9% | Mesopotamian Arabic | 6a (Vigorous) |
| Azerbaijani | 540,000 | 0.7% | Azerbaijani | 5 (Developing) |
| Romani | 500,000 (1985) | 0.7% | Romani, Domari | |
| Gagauzes | 418,000 | 0.5% | Balkan Gagauz Turkish | 7 (Shifting) |
| Pomaks | 351,000 | 0.4% | Bulgarian | 5 (Dispersed) |
| Pontic Greeks | 321,000 | 0.4% | Pontic Greek | 6a (Vigorous) |
| Adyghe, Circassians | 316,000 | 0.4% | Adyghe | 5 (Developing) |
| Alevi Kurds | 184,000 | 0.2% | Zazaki | |
| Georgians | 151,000 | 0,1 % | Georgian | 6b (Threatened) |
| Bosniaks | 101,000 | 0.1% | Bosnian | |
| Chechens | 101,000 | 0.1% | Chechen | |
| Crimean Tatars | 100,000 | 0.1% | Crimean Tatar | 5 (Developing) |
| Lazi | 93,000 | 0.1% | Laz language | 6b (Threatened) |
| Karakalpaks | 74,000 | Karakalpak | ||
| Albanians | 66,000 | Tosk Albanian | 6b (Threatened) | |
| Armenians | 61,000 | Armenian | 6b (Threatened) | |
| Abkhazians | 44,000 | Abkhazian | 6b (Threatened) | |
| Han Chinese | 38,000 | Chinese | ||
| Ossetians | 37,000 | Ossetian | ||
| British | 35,000 | English | ||
| Bulgarians | 32,000 | Bulgarian | ||
| Jews | 30,000 | Turkish, Ladino | 7 (Shifting) | |
| Tatars | 26,000 | Tatar | ||
| Assyrians | 25,000 | Aramaic | ||
| 22,000 | Urdu | |||
| Assyrians | 15,000 | Turoyo | 6b (Threatened) | |
| Turks other (Hemshin, Meskhetian Turks, Gajal) | 57,000 | Turkish | ||
| Kurds other (Herki and Shikaki) | 62,000 | Kurdish | ||
| Other | 180,000 | |||
| Total | 75,566,800 |
Religion
Religious affiliation
| Year | 1914 | 1927 | 1945 | 1965 | 1990 | 2005 |
|---|---|---|---|---|---|---|
| Muslims | 12,941 | 13,290 | 18,511 | 31,139 | 56,860 | 71,997 |
| Greeks | 1,549 | 110 | 104 | 76 | 8 | 3 |
| Armenians | 1,204 | 77 | 60 | 64 | 67 | 50 |
| Jews | 128 | 82 | 77 | 38 | 29 | 27 |
| Others | 176 | 71 | 38 | 74 | 50 | 45 |
| Total | 15,997 | 13,630 | 18,790 | 31,391 | 57,005 | 72,120 |
| Percentage non-Muslim | 19.1 | 2.5 | 1.5 | 0.8 | 0.3 | 0.2 |
The percentage of non-Muslims in Turkey fell from 19.1% in 1914 to 2.5% percent in 1927.[52] The drop was the result of the late Ottoman genocides, the population exchange between Greece and Turkey[53] and the emigration of Christians.[54] The 1942 Wealth Tax on non-Muslims, the emigration of many of Turkish Jews to Israel after 1948, and the 1955 Istanbul pogrom further contributed to the decline of Turkey's non-Muslim population.
There are no official statistics of people's religious beliefs nor is it asked in the census. According to the government, 99.8% of the Turkish population is Muslim, mostly Sunni, some 8 million are Alevis.[55] The remaining 0.2% is other - mostly Christians and Jews.[11] However, these are based on the existing religion information written on every citizen's national id card, that is automatically passed on from the parents to every newborn, and do not necessarily represent individual choice. Religious records can be changed or even blanked on the request of citizen, by filing an e-government application since May 2020, using a valid electronic signature to sign the electronic application. Any change in religion records additionally results in a new ID card being issued. Any change in religion record also leaves a permanent trail in the census record, however, record of change of religion is not accessible except for the citizen in question, next-of-kins of the citizen in question, the citizenship administration and courts.[56]
In a poll conducted by Sabancı University in 2006, 98.3% of Turks revealed they were Muslim.[57] A Eurobarometer Poll in 2005 reported that in a poll 98% of Turkish citizens answered that "they believe there is a God", while 1% responded that "they do not believe there is any sort of spirit, God, or life force".[58] In a Pew Research Center survey, 53% of Turkey's Muslims said that "religion is very important in their lives".[59] Based on the Gallup Poll 2006–08, Turkey was defined as More religious, in which over 63 percent of people believe religion is important.[60][61] According to the Turkish Economic and Social Studies Foundation, 62% of women wear the headscarf or hijab in Turkey.[62][63][64]
A poll conducted by Eurobarometer and KONDA and some other research institutes in 2013 showed that around 0.5% of the population had no religion. Another poll conducted by the same institutions in 2018 showed that 3% of those interviewed had no religion.[65][66]
According to Ipsos survey,[67] in 2016 Islam was the major religion in Turkey comprising 82% of the total population, followed by religiously unaffiliated people, comprising 13% of the population, and Christians, forming 0.2%.
Religiosity
The vast majority of the present-day Turkish people are Muslim and the most popular sect is the Hanafite school of Sunni Islam, which was officially espoused by the Ottoman Empire; according to the KONDA Research and Consultancy survey carried out throughout Turkey on 2007:[68][55][69]
- 52.8% defined themselves as "a religious person who strives to fulfill religious obligations" (Religious)
- 34.3 % defined themselves as "a believer who does not fulfill religious obligations" (Not religious).
- 9.7% defined themselves as "a fully devout person fulfilling all religious obligations" (Fully devout).
- 2.3% defined themselves as "someone who does not believe in religious obligations" (Non-believer).
- 0.9% defined themselves as "someone with no religious conviction" (Atheist).
In 2018 KONDA released a new study :[70][71]
- 51% defined themselves as "a religious person who strives to fulfill religious obligations" (Religious)
- 34% defined themselves as "a believer who does not fulfill religious obligations" (Not religious).
- 10% defined themselves as "a fully devout person fulfilling all religious obligations" (Fully devout).
- 2% defined themselves as "someone who does not believe in religious obligations" (Non-believer).
- 3% defined themselves as "someone with no religious conviction" (Atheist).
Among those aged between 15 and 29 years old :[72]
- 43% defined themselves as "a religious person who strives to fulfill religious obligations" (Religious)
- 45% defined themselves as "a believer who does not fulfill religious obligations" (Not religious).
- 5% defined themselves as "a fully devout person fulfilling all religious obligations" (Fully devout).
- 4% defined themselves as "someone who does not believe in religious obligations" (Non-believer).
- 4% defined themselves as "someone with no religious conviction" (Atheist).
References
- "TURKSTAT Corporate". data.tuik.gov.tr. Retrieved 15 May 2023.
- "TurkStat".
- "Turkish Statistical Institute". tuik.gov.tr. 4 February 2020. Retrieved 23 February 2020.
- "TÜİK Kurumsal".
- "TÜİK Kurumsal".
- CO2 Emissions from Fuel Combustion Archived 12 October 2009 at the Wayback Machine Population 1971–2008 (pdf Archived 2012-01-06 at the Wayback Machine pages 83–85) IEA (OECD/ World Bank) original population ref e.g. in IEA Key World Energy Statistics 2010, p. 57.
- "Population Statistics And Projections". Turkstat.gov.tr. Retrieved 17 June 2014.
- "Census of Population ; Social and Economic Characteristics of Population, Turkey". Turkstat.gov.tr. Retrieved 15 April 2016.
- "World Population Prospects – Population Division – United Nations". Retrieved 16 July 2017.
- "Türkiye'de yaşlı nüfus arttı". www.hurriyet.com.tr (in Turkish). Retrieved 4 August 2020.
- "CIA World Factbook". CIA. 2018. Archived from the original on 10 January 2021. Retrieved 8 April 2019.
- "Türkiye'nin nüfusu (2020) belli oldu". www.sozcu.com.tr (in Turkish). Retrieved 4 August 2020.
- "World Population Prospects: The 2017 Revision". Esa.un.org. 8 October 2018.
- "::Welcome to Turkish Statistical Institute(TurkStat)'s Web Pages". TurkStat. Retrieved 17 June 2014.
- "Turkish Statistical Institute". Turkstat.gov.tr. Retrieved 17 June 2014.
- Turkish Statistical Institute (TurkStat) (31 August 2012). "Turkish Statistical Institute Birth Statistics 2012". Turkstat.gov.tr. Retrieved 17 June 2014.
- "The DHS Program – Quality information to plan, monitor and improve population, health, and nutrition programs". Dhsprogram.com. Retrieved 8 November 2017.
- "Spatial Distribution of Total Fertility Rate in Turkey" (PDF). Ankara University. 2004. Retrieved 16 May 2016.
- "TurkStat". TurkStat. 2013. Retrieved 22 March 2015.
- "İllerin aldığı, verdiği göç, net göç ve net göç hızı, 1980–2018". Turk.gov.ty. Archived from the original on 16 March 2018. Retrieved 8 November 2017.
- (TurkStat), Turkish Statistical Institute. "Turkish Statistical Institute The Results of Address Based Population Registration System 2015". Turkstat.gov.tr. Retrieved 8 November 2017.
- "İllerin aldığı, verdiği göç, net göç ve net göç hızı, 1980–2016". Turkstat.gov.tr. Retrieved 8 November 2017.
- "Yaş grubu ve cinsiyete göre il/ilçe merkezi ve belde/köy nüfusu, 2007–2016". Turkstat.gov.tr. Retrieved 8 November 2017.
- "TÜİK Kurumsal".
- "Number of Syrians in Turkey July 2023 – Refugees Association". multeciler.org.tr.
- Airport, Turkish Airlines planes are parked at the new Istanbul (24 July 2023). "Russian migration to Turkey spikes by 218% in aftermath of Ukraine war - Al-Monitor: Independent, trusted coverage of the Middle East". www.al-monitor.com.
- "Условия приобретения гражданства Турции". Гражданство Турции. Retrieved 1 June 2022.
- TurkStat
- Kaya, Nurcan (24 November 2015). "Teaching in and Studying Minority Languages in Turkey: A Brief Overview of Current Issues and Minority Schools". European Yearbook of Minority Issues Online. 12 (1): 315–338. doi:10.1163/9789004306134_013. ISSN 2211-6117.
Turkey is a nation–state built on remnants of the Ottoman Empire where non-Muslim minorities were guaranteed the right to set up educational institutions; however, since its establishment, it has officially recognised only Armenians, Greeks and Jews as minorities and guaranteed them the right to manage educational institutions as enshrined in the Treaty of Lausanne. [...] Private language teaching courses teach 'traditionally used languages', elective language courses have been introduced in public schools and universities are allowed to teach minority languages.
- Toktas, Sule (2006). "EU enlargement conditions and minority protection : a reflection on Turkey's non-Muslim minorities". East European quarterly. 40: 489–519. ISSN 0012-8449.
Turkey signed the Covenant on 15 August 2000 and ratified it on 23 September 2003. However, Turkey put a reservation on Article 27 of the Covenant which limited the scope of the right of ethnic, religious or linguistic minorities to enjoy their own culture, to profess and practice their own religion or to use their own language. This reservation provides that this right will be implemented and applied in accordance with the relevant provisions of the Turkish Constitution and the 1923 Treaty of Lausanne. This implies that Turkey grants educational right in minority languages only to the recognized minorities covered by the Lausanne who are the Armenians, Greeks and the Jews.
- Bayır, Derya (2013). Minorities and nationalism in Turkish law. Cultural diversity and law. Farnham: Ashgate. pp. 88–90, 203–204. ISBN 978-1-4094-7254-4.
Oran farther points out that the rights set out for the four categories are stated to be the 'fundamental law' of the land, so that no legislation or official action shall conflict or interfere with these stipulations or prevail over them (article 37). [...] According to the Turkish state, only Greek, Armenian and Jewish non-Muslims were granted minority protection by the Lausanne Treaty. [...] Except for non-Muslim populations - that is, Greeks, Jews and Armenians - none of the other minority groups' language rights have been de jure protected by the legal system in Turkey.
- Phillips, Thomas James (16 December 2020). "The (In-)Validity of Turkey's Reservation to Article 27 of the International Covenant on Civil and Political Rights". International Journal on Minority and Group Rights. 27 (1): 66–93. doi:10.1163/15718115-02701001. ISSN 1385-4879.
The fact that Turkish constitutional law takes an even more restrictive approach to minority rights than required under the Treaty of Lausanne was recognised by the UN Committee on the Elimination of All Forms of Racial Discrimination (CERD) in its concluding observations on the combined fourth to sixth periodic reports of Turkey. The CERD noted that "the treaty of Lausanne does not explicitly prohibit the recognition of other groups as minorities" and that Turkey should consider recognising the minority status of other groups, such as Kurds. 50 In practice, this means that Turkey grants minority rights to "Greek, Armenian and Jewish minority communities while denying their possible impact for unrecognized minority groups (e.g. Kurds, Alevis, Arabs, Syriacs, Protestants, Roma etc.)".
- Toktaş, Şule; Araş, Bulent (2009). "The EU and Minority Rights in Turkey". Political Science Quarterly. 124 (4): 697–720. ISSN 0032-3195.
- Köksal, Yonca (2006). "Minority Policies in Bulgaria and Turkey: The Struggle to Define a Nation". Southeast European and Black Sea Studies. 6 (4): 501–521. doi:10.1080/14683850601016390. ISSN 1468-3857.
- Özlem, Kader (2019). "An Evaluation on Istanbul's Bulgarians as the "Invisible Minority" of Turkey". TURAN-SAM. 11 (43): 387–393. ISSN 1308-8041.
- "Foreign Ministry: 89,000 minorities live in Turkey". Today's Zaman. 15 December 2008. Archived from the original on 1 May 2010. Retrieved 15 December 2008.
- Akbulut, Olgun (19 October 2023). "For Centenary of the Lausanne Treaty: Re-Interpretation and Re-Implementation of Linguistic Minority Rights of Lausanne". International Journal on Minority and Group Rights. -1 (aop): 1–24. doi:10.1163/15718115-bja10134. ISSN 1385-4879.
- Sabah, Daily (26 August 2019). "Last 17 years a golden era for minority communities, witnessing period of increased rights". Daily Sabah. Retrieved 21 October 2023.
- "Cumhurbaşkanı Erdoğan: Nefret suçlarına göz yumanlar, farklı kültürlerin bir arada yaşama iradesini dinamitlemektedir". www.aa.com.tr. Retrieved 21 October 2023.
- Modern Turkey, Bill Park, Taylor & Francis, 2011, page 10
- "UN Demographic Yearbooks". Unstats.un.org. Retrieved 17 June 2014.
- American Heritage Dictionary (2000). "The American Heritage Dictionary of the English Language: Fourth Edition – "Turk"". Houghton Mifflin Company. Archived from the original on 16 January 2007. Retrieved 27 December 2006.
- Andrews, Peter A. Ethnic groups in the Republic of Turkey., Beiheft Nr. B 60, Tübinger Atlas des Vorderen Orients, Wiesbaden: Reichert Publications, 1989, ISBN 3-89500-297-6 ; + 2nd enlarged edition in 2 vols., 2002, ISBN 3-89500-229-1
- "A Quest for Equality: Minorities in Turkey" (PDF). www.avrupa.info.tr. Archived from the original (PDF) on 3 October 2011.
- Kahl, Thede (2006). "The Islamisation of the Meglen Vlachs (Megleno-Romanians): The Village of Nânti (Nótia) and the "Nântinets" in Present-Day Turkey". Nationalities Papers. 34 (1): 71–90. doi:10.1080/00905990500504871. S2CID 161615853.
- Turkey. The World Factbook. CIA
- "Türkiyedeki Kürtlerin Sayısı!". Milliyet (in Turkish). 6 June 2008. Retrieved 7 June 2008.
- "TR100". interaktif.konda.com.tr. Retrieved 16 May 2022.
- Kurdish Life in Contemporary Turkey: Migration, Gender and Ethnic Identity, Anna Grabolle Celiker, page 160, I.B.Tauris, 2013
- "Turkey". Ethnologue.
- "Turquie: situation générale". Axl.cefan.ulaval.ca. Retrieved 8 November 2017.
- İçduygu, Ahmet; Toktaş, Şule; Ali Soner, B (1 February 2008). "The politics of population in a nation-building process: emigration of non-Muslims from Turkey". Ethnic and Racial Studies. 31 (2): 358–389. doi:10.1080/01419870701491937. S2CID 143541451. Archived from the original on 25 March 2020. Retrieved 27 May 2020.
- Chapter The refugees question in Greece (1821–1930) in "Θέματα Νεοελληνικής Ιστορίας", ΟΕΔΒ ("Topics from Modern Greek History"). 8th edition (PDF), Nikolaos Andriotis, 2008
- Quarterly, Middle East (2001). "'Editors' Introduction: Why a Special Issue?: Disappearing Christians of the Middle East" (PDF). Middle East Quarterly. Editors' Introduction. Archived from the original on 11 May 2013. Retrieved 11 June 2013.
- Shankland, David (2003). The Alevis in Turkey: The Emergence of a Secular Islamic Tradition. Routledge (UK). ISBN 0-7007-1606-8.
- "e-Devlet'te yeni hizmet: Din değişikliği yapılabilecek". A3 Haber (in Turkish). 23 May 2020. Retrieved 7 November 2020.
- "Ankette Mezhep Soruları". archive.vn. 2 February 2013. Archived from the original on 2 February 2013. Retrieved 7 November 2020.
- "Eurobarometer on Social Values, Science and technology 2005" (PDF). Eurobarometer. Archived from the original (PDF) on 24 May 2006. Retrieved 18 December 2007.
- Wike, Richard; Juliana Menasce Horowitz (26 July 2006). "Lebanon's Muslims: Relatively Secular and Pro-Christian". Pew Global Attitudes Project.
- "2009 Gallup poll Gallup Poll". Gallup.com. 9 February 2009. Retrieved 17 June 2014.
- Gallup World View Archived October 19, 2013, at the Wayback Machine
- Lamb, Christina (23 April 2007). "Head scarves to topple secular Turkey?". The Times. London.
- Lamb, Christina (6 May 2007). "Headscarf war threatens to split Turkey". Times Online. London.
- Clark-Flory, Tracy (23 April 2007). "Head scarves to topple secular Turkey?". Salon.com. Retrieved 4 August 2008.
- "KONDA Toplumsal Değişim Raporu: Türkiye'de inançsızlık yükselişte". euronews (in Turkish). 3 January 2019. Retrieved 7 November 2020.
- tr:Türkiye demografisi#N.C3.BCfus Piramidi
- "Religion, Ipsos Global Trends". Ipsos. 2017. Retrieved 19 August 2017.
- KONDA Research and Consultancy (8 September 2007). "Religion, Secularism and the Veil in daily life" (PDF). Milliyet. Archived from the original (PDF) on 25 March 2009.
- Religious Freedom Report U.S. Department of State. Retrieved on 2009-09-15.
- "KONDA Toplumsal Değişim Raporu: Türkiye'de inançsızlık yükselişte". euronews (in Turkish). 3 January 2019. Retrieved 4 August 2020.
- "Hayat Tarzı – 10 Yılda Ne Değişti?". interaktif.konda.com.tr. Retrieved 4 August 2020.
- "Hayat Tarzı – 10 Yılda Gençlerde Ne Değişti?". interaktif.konda.com.tr. Retrieved 4 August 2020.
Notes
- All data taken from Turkish Statistical Institute (TurkStat). Data is for xxxx-12-31.
External links
- Build Turkey population graph: from 1960 till now (World Bank data)
- Build Turkey population projection graph till 2100 (United Nation data)
- Build Turkey life expectancy at birth graph: from 1950 till now (United Nation data)