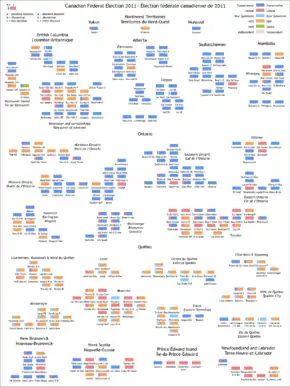
Results of the 2011 Canadian federal election
The 41st Canadian federal election was held on May 2, 2011. It resulted in a Conservative majority government under the leadership of Prime Minister Stephen Harper.[1] It was the third consecutive election win for Harper, and with 166 of 308 seats, giving them a majority government for the first time in their eight-year history. It was also be the first right-of-centre majority government since the Progressive Conservatives won their last majority in 1988.[2] The Conservative Party won 39.62% of the popular vote, an increase of 1.96%,[1] and posted a net gain of 24 seats in the House of Commons.[3]
| ||||||||||||||||||||||||||||||||||||||||
| Turnout | 61.1% | |||||||||||||||||||||||||||||||||||||||
|---|---|---|---|---|---|---|---|---|---|---|---|---|---|---|---|---|---|---|---|---|---|---|---|---|---|---|---|---|---|---|---|---|---|---|---|---|---|---|---|---|
| ||||||||||||||||||||||||||||||||||||||||

The election resulted in significant upheaval within the opposition parties, as the New Democratic Party (NDP) rode an "orange surge" in the polls during the campaign to 103 seats, becoming Her Majesty's Loyal Opposition for the first time in party history.[4] The total eclipsed the party's previous best of 43 seats in 1988.[5] The Liberals however were reduced to third party status nationwide. They returned only 34 MPs, less than half of what they had at dissolution.[6] It was the first time in Canadian history that the Liberals were not one of the top two parties in the house.[7] Green Party leader Elizabeth May won in her riding, becoming the first Green Party candidate elected to a governmental body in Canada, and to a national body in North America.[8]
Following their staggering defeats, including losing their own seats, Bloc Québécois leader Gilles Duceppe and Liberal leader Michael Ignatieff both announced their resignations as party leaders.[6][9]
Vote total

| National Results (Preliminary) | |||||
|---|---|---|---|---|---|
| Party | Seats | Votes | % | +/- | |
| Conservative | 166 | 5,832,560 | 39.62 | +1.97 | |
| New Democratic | 103 | 4,508,474 | 30.63 | +12.44 | |
| Liberal | 34 | 2,783,175 | 18.91 | -7.36 | |
| Bloc Québécois | 4 | 889,788 | 6.04 | -3.93 | |
| Green | 1 | 576,221 | 3.91 | -2.86 | |
| Independent | 0 | 63,340 | 0.43 | -0.22 | |
| Christian Heritage | 0 | 19,218 | 0.131 | -0.061 | |
| Marxist–Leninist | 0 | 10,160 | 0.069 | +0.007 | |
| No affiliation | 0 | 9,391 | 0.064 | +0.024 | |
| Libertarian | 0 | 6,017 | 0.041 | -0.012 | |
| Progressive Canadian | 0 | 5,838 | 0.040 | -0.003 | |
| Rhinoceros | 0 | 3,819 | 0.026 | +0.011 | |
| Pirate | 0 | 3,198 | 0.022 | * | |
| Communist | 0 | 2,925 | 0.020 | -0.006 | |
| Canadian Action | 0 | 2,030 | 0.0138 | -0.0112 | |
| Marijuana | 0 | 1,864 | 0.0127 | -0.0039 | |
| Animal Alliance | 0 | 1,451 | 0.0099 | +0.0060 | |
| Western Block | 0 | 748 | 0.0051 | +0.0037 | |
| United | 0 | 294 | 0.0020 | * | |
| First Peoples National | 0 | 228 | 0.00155 | -0.01010 | |
| Total | 308 | 14,720,580 | 100.00 | ||
| Popular support based on winning and losing candidates (based on certified results - except Nunavut and Skeena-Bulkley Valley) | |||||||||
|---|---|---|---|---|---|---|---|---|---|
| Party | Winners | Votes | Party % | Total % | Losers | Votes | Party % | Total % | |
| Conservative | 166 | 4,380,401 | 74.91% | 58.98% | 141 | 1,467,337 | 25.09% | 20.11% | |
| New Democratic | 103 | 2,378,632 | 52.49% | 32.03% | 205 | 2,153,097 | 47.51% | 29.50% | |
| Liberal | 34 | 571,379 | 20.52% | 7.69% | 274 | 2,213,095 | 79.48% | 30.33% | |
| Bloc Québécois | 4 | 64,620 | 7.25% | 0.87% | 71 | 826,809 | 92.75% | 11.33% | |
| Green | 1 | 31,890 | 5.56% | 0.43% | 303 | 541,318 | 94.44% | 7.42% | |
| Other | 0 | 0 | 0.00% | 0.00% | 285 | 95,790 | 100.00% | 1.31% | |
| Totals | 308 | 7,426,922 | 50.44% | 100.00% | 1,279 | 7,297,446 | 49.56% | 100.00% | |
Synopsis of results
| Prov/ Terr |
Riding | 2006 | Winning party | Turnout [a 2] |
Votes[a 3] | |||||||||||||
|---|---|---|---|---|---|---|---|---|---|---|---|---|---|---|---|---|---|---|
| Party | Party | Votes | Share | Margin # |
Margin % |
Con | NDP | Lib | BQ | Green | Ind | Other | Total[a 4] | |||||
| AB | Calgary Centre-North | Con | Con | 28,443 | 56.53% | 20,395 | 40.53% | 59.71% | 28,443 | 8,048 | 7,046 | – | 6,578 | – | 203 | 50,318 | ||
| AB | Calgary Centre | Con | Con | 28,401 | 57.68% | 19,770 | 40.15% | 55.28% | 28,401 | 7,314 | 8,631 | – | 4,889 | – | – | 49,235 | ||
| AB | Calgary East | Con | Con | 23,372 | 67.43% | 18,478 | 53.31% | 45.94% | 23,372 | 4,894 | 4,102 | – | 2,047 | – | 246 | 34,661 | ||
| AB | Calgary Northeast | Con | Con | 23,550 | 56.80% | 12,063 | 29.10% | 47.80% | 23,550 | 4,262 | 11,487 | – | 1,953 | – | 206 | 41,458 | ||
| AB | Calgary Southeast | Con | Con | 48,173 | 76.26% | 41,691 | 66.00% | 59.47% | 48,173 | 6,482 | 4,020 | – | 4,079 | 225 | 193 | 63,172 | ||
| AB | Calgary Southwest | Con | Con | 42,998 | 75.12% | 36,175 | 63.20% | 60.42% | 42,998 | 6,823 | 4,121 | – | 2,991 | 303 | – | 57,236 | ||
| AB | Calgary West | Con | Con | 39,996 | 62.16% | 28,622 | 44.48% | 62.31% | 39,996 | 6,679 | 11,374 | – | 6,070 | – | 227 | 64,346 | ||
| AB | Calgary—Nose Hill | Con | Con | 40,384 | 70.17% | 33,195 | 57.68% | 56.64% | 40,384 | 7,189 | 6,501 | – | 3,480 | – | – | 57,554 | ||
| AB | Crowfoot | Con | Con | 44,115 | 83.99% | 39,310 | 74.84% | 59.24% | 44,115 | 4,805 | 1,224 | – | 1,711 | 463 | 204 | 52,522 | ||
| AB | Edmonton Centre | Con | Con | 23,625 | 48.03% | 11,145 | 22.66% | 57.16% | 23,625 | 12,480 | 11,037 | – | 1,676 | – | 370 | 49,188 | ||
| AB | Edmonton East | Con | Con | 24,111 | 52.75% | 7,033 | 15.39% | 49.62% | 24,111 | 17,078 | 3,176 | – | 1,345 | – | – | 45,710 | ||
| AB | Edmonton—Leduc | Con | Con | 37,778 | 63.57% | 26,290 | 44.24% | 58.68% | 37,778 | 11,488 | 7,270 | – | 2,896 | – | – | 59,432 | ||
| AB | Edmonton—Mill Woods—Beaumont | Con | Con | 27,857 | 61.04% | 16,982 | 37.21% | 52.96% | 27,857 | 10,875 | 5,066 | – | 1,364 | – | 474 | 45,636 | ||
| AB | Edmonton—Sherwood Park | Con | Con | 24,623 | 44.66% | 8,360 | 15.16% | 58.44% | 24,623 | 7,971 | 4,131 | – | 1,926 | 16,263 | 222 | 55,136 | ||
| AB | Edmonton—Spruce Grove | Con | Con | 41,782 | 71.10% | 32,510 | 55.32% | 55.79% | 41,782 | 9,272 | 5,483 | – | 2,232 | – | – | 58,769 | ||
| AB | Edmonton—St. Albert | Con | Con | 34,468 | 63.46% | 22,824 | 42.02% | 55.86% | 34,468 | 11,644 | 5,796 | – | 2,409 | – | – | 54,317 | ||
| AB | Edmonton—Strathcona | NDP | NDP | 26,093 | 53.55% | 6,331 | 12.99% | 66.52% | 19,762 | 26,093 | 1,372 | – | 1,119 | 293 | 91 | 48,730 | ||
| AB | Fort McMurray—Athabasca | Con | Con | 21,988 | 71.84% | 17,935 | 58.60% | 40.30% | 21,988 | 4,053 | 3,190 | – | 1,374 | – | – | 30,605 | ||
| AB | Lethbridge | Con | Con | 27,173 | 56.51% | 14,101 | 29.32% | 53.75% | 27,173 | 13,072 | 4,030 | – | 2,095 | – | 1,716 | 48,086 | ||
| AB | Macleod | Con | Con | 40,007 | 77.48% | 34,672 | 67.15% | 60.42% | 40,007 | 5,335 | 1,898 | – | 2,389 | – | 2,006 | 51,635 | ||
| AB | Medicine Hat | Con | Con | 30,719 | 71.55% | 25,103 | 58.47% | 52.13% | 30,719 | 5,616 | 4,416 | – | 1,868 | – | 317 | 42,936 | ||
| AB | Peace River | Con | Con | 36,334 | 75.76% | 28,594 | 59.62% | 49.00% | 36,334 | 7,740 | 1,481 | – | 1,702 | 359 | 345 | 47,961 | ||
| AB | Red Deer | Con | Con | 37,959 | 75.93% | 30,393 | 60.79% | 53.47% | 37,959 | 7,566 | 1,918 | – | 2,551 | – | – | 49,994 | ||
| AB | Vegreville—Wainwright | Con | Con | 39,145 | 79.79% | 33,584 | 68.46% | 58.67% | 39,145 | 5,561 | 1,525 | – | 2,499 | – | 327 | 49,057 | ||
| AB | Westlock—St. Paul | Con | Con | 32,652 | 77.82% | 27,549 | 65.66% | 55.21% | 32,652 | 5,103 | 2,569 | – | 1,634 | – | – | 41,958 | ||
| AB | Wetaskiwin | Con | Con | 37,756 | 81.44% | 32,475 | 70.05% | 57.92% | 37,756 | 5,281 | 1,348 | – | 1,978 | – | – | 46,363 | ||
| AB | Wild Rose | Con | Con | 43,669 | 74.74% | 37,074 | 63.46% | 61.23% | 43,669 | 6,595 | 3,908 | – | 4,071 | – | 181 | 58,424 | ||
| AB | Yellowhead | Con | Con | 31,925 | 77.03% | 26,514 | 63.97% | 55.13% | 31,925 | 5,411 | 1,190 | – | 2,132 | – | 788 | 41,446 | ||
| BC | Abbotsford | Con | Con | 32,493 | 65.02% | 22,404 | 44.83% | 58.96% | 32,493 | 10,089 | 4,968 | – | 2,138 | – | 286 | 49,974 | ||
| BC | British Columbia Southern Interior | NDP | NDP | 25,206 | 50.92% | 5,933 | 11.98% | 65.58% | 19,273 | 25,206 | 1,872 | – | 3,153 | – | – | 49,504 | ||
| BC | Burnaby—Douglas | NDP | NDP | 20,943 | 43.00% | 1,011 | 2.08% | 57.63% | 19,932 | 20,943 | 5,451 | – | 1,754 | – | 630 | 48,710 | ||
| BC | Burnaby—New Westminster | NDP | NDP | 22,193 | 49.67% | 6,184 | 13.84% | 53.25% | 16,009 | 22,193 | 4,496 | – | 1,731 | – | 254 | 44,683 | ||
| BC | Cariboo—Prince George | Con | Con | 24,443 | 56.17% | 11,308 | 25.98% | 57.32% | 24,443 | 13,135 | 2,200 | – | 2,702 | 394 | 644 | 43,518 | ||
| BC | Chilliwack—Fraser Canyon | Con | Con | 28,160 | 57.20% | 15,469 | 31.42% | 58.14% | 28,160 | 12,691 | 5,320 | – | 2,706 | – | 353 | 49,230 | ||
| BC | Delta—Richmond East | Con | Con | 26,059 | 54.24% | 14,878 | 30.97% | 59.65% | 26,059 | 11,181 | 8,112 | – | 2,324 | 220 | 147 | 48,043 | ||
| BC | Esquimalt—Juan de Fuca | Con | NDP | 26,198 | 40.87% | 406 | 0.63% | 65.24% | 25,792 | 26,198 | 6,439 | – | 5,341 | 181 | 145 | 64,096 | ||
| BC | Fleetwood—Port Kells | Con | Con | 23,950 | 47.55% | 7,417 | 14.73% | 52.86% | 23,950 | 16,533 | 8,041 | – | 1,476 | – | 370 | 50,370 | ||
| BC | Kamloops—Thompson—Cariboo | Con | Con | 29,682 | 52.24% | 8,699 | 15.31% | 62.71% | 29,682 | 20,983 | 3,026 | – | 2,932 | – | 191 | 56,814 | ||
| BC | Kelowna—Lake Country | Con | Con | 34,566 | 57.40% | 21,244 | 35.28% | 59.84% | 34,566 | 13,322 | 7,069 | – | 5,265 | – | – | 60,222 | ||
| BC | Kootenay—Columbia | Con | Con | 23,910 | 55.88% | 9,711 | 22.70% | 63.45% | 23,910 | 14,199 | 1,496 | – | 2,547 | 636 | – | 42,788 | ||
| BC | Langley | Con | Con | 35,569 | 64.52% | 24,292 | 44.06% | 61.28% | 35,569 | 11,277 | 4,990 | – | 2,943 | – | 353 | 55,132 | ||
| BC | Nanaimo—Alberni | Con | Con | 30,469 | 46.42% | 5,304 | 8.08% | 66.70% | 30,469 | 25,165 | 4,984 | – | 4,482 | – | 538 | 65,638 | ||
| BC | Nanaimo—Cowichan | NDP | NDP | 31,272 | 48.90% | 6,775 | 10.59% | 64.20% | 24,497 | 31,272 | 3,007 | – | 5,005 | – | 170 | 63,951 | ||
| BC | New Westminster—Coquitlam | NDP | NDP | 23,023 | 45.93% | 2,247 | 4.48% | 59.61% | 20,776 | 23,023 | 4,069 | – | 2,160 | – | 95 | 50,123 | ||
| BC | Newton—North Delta | Lib | NDP | 15,413 | 33.42% | 903 | 1.96% | 61.45% | 14,437 | 15,413 | 14,510 | – | 1,520 | 123 | 116 | 46,119 | ||
| BC | North Vancouver | Con | Con | 28,996 | 48.62% | 11,331 | 19.00% | 66.86% | 28,996 | 9,617 | 17,665 | – | 3,004 | 350 | – | 59,632 | ||
| BC | Okanagan—Coquihalla | Con | Con | 28,525 | 53.58% | 15,672 | 29.44% | 61.90% | 28,525 | 12,853 | 5,815 | – | 5,005 | 1,040 | – | 53,238 | ||
| BC | Okanagan—Shuswap | Con | Con | 31,439 | 55.45% | 16,484 | 29.07% | 61.94% | 31,439 | 14,955 | 4,246 | – | 6,058 | – | – | 56,698 | ||
| BC | Pitt Meadows—Maple Ridge—Mission | Con | Con | 28,803 | 54.34% | 9,968 | 18.81% | 59.33% | 28,803 | 18,835 | 2,739 | – | 2,629 | – | – | 53,006 | ||
| BC | Port Moody—Westwood—Port Coquitlam | Con | Con | 27,181 | 56.07% | 12,581 | 25.95% | 56.46% | 27,181 | 14,600 | 4,110 | – | 2,161 | – | 421 | 48,473 | ||
| BC | Prince George—Peace River | Con | Con | 23,946 | 62.12% | 14,070 | 36.50% | 53.28% | 23,946 | 9,876 | 2,008 | – | 2,301 | – | 415 | 38,546 | ||
| BC | Richmond | Con | Con | 25,109 | 58.36% | 17,082 | 39.70% | 50.50% | 25,109 | 7,860 | 8,027 | – | 2,032 | – | – | 43,028 | ||
| BC | Saanich—Gulf Islands | Con | Grn | 31,890 | 46.33% | 7,346 | 10.67% | 73.88% | 24,544 | 8,185 | 4,208 | – | 31,890 | – | – | 68,827 | ||
| BC | Skeena—Bulkley Valley | NDP | NDP | 19,431 | 55.33% | 7,314 | 20.83% | 57.72% | 12,117 | 19,431 | 1,268 | – | 1,102 | – | 1,203 | 35,121 | ||
| BC | South Surrey—White Rock—Cloverdale | Con | Con | 31,990 | 54.55% | 20,109 | 34.29% | 64.27% | 31,990 | 11,881 | 9,775 | – | 3,245 | 1,094 | 657 | 58,642 | ||
| BC | Surrey North | Con | NDP | 14,678 | 39.69% | 1,497 | 4.05% | 51.63% | 13,181 | 14,678 | 6,797 | – | 1,289 | 451 | 587 | 36,983 | ||
| BC | Vancouver Centre | Lib | Lib | 18,260 | 31.03% | 2,935 | 4.99% | 57.71% | 15,323 | 15,325 | 18,260 | – | 9,089 | – | 852 | 58,849 | ||
| BC | Vancouver East | NDP | NDP | 27,794 | 62.83% | 19,433 | 43.93% | 54.42% | 8,361 | 27,794 | 4,382 | – | 3,383 | – | 318 | 44,238 | ||
| BC | Vancouver Island North | Con | Con | 27,206 | 46.11% | 1,827 | 3.10% | 65.49% | 27,206 | 25,379 | 3,039 | – | 3,018 | 304 | 57 | 59,003 | ||
| BC | Vancouver Kingsway | NDP | NDP | 23,452 | 50.08% | 10,295 | 21.98% | 57.06% | 13,157 | 23,452 | 7,796 | – | 1,860 | – | 563 | 46,828 | ||
| BC | Vancouver Quadra | Lib | Lib | 22,903 | 42.17% | 1,919 | 3.53% | 62.43% | 20,984 | 7,499 | 22,903 | – | 2,922 | – | – | 54,308 | ||
| BC | Vancouver South | Lib | Con | 19,504 | 43.31% | 3,900 | 8.66% | 54.92% | 19,504 | 8,552 | 15,604 | – | 1,151 | – | 222 | 45,033 | ||
| BC | Victoria | NDP | NDP | 30,679 | 50.78% | 16,404 | 27.15% | 67.55% | 14,275 | 30,679 | 8,448 | – | 7,015 | – | – | 60,417 | ||
| BC | West Vancouver—Sunshine Coast—Sea to Sky Country | Con | Con | 28,614 | 45.53% | 13,786 | 21.93% | 63.30% | 28,614 | 14,828 | 14,123 | – | 4,436 | – | 850 | 62,851 | ||
| MB | Brandon—Souris | Con | Con | 22,386 | 63.73% | 13,541 | 38.55% | 57.54% | 22,386 | 8,845 | 1,882 | – | 2,012 | – | – | 35,125 | ||
| MB | Charleswood—St. James—Assiniboia | Con | Con | 23,264 | 57.56% | 15,130 | 37.43% | 64.77% | 23,264 | 8,134 | 7,433 | – | 1,587 | – | – | 40,418 | ||
| MB | Churchill | NDP | NDP | 10,262 | 51.12% | 5,006 | 24.94% | 43.81% | 5,256 | 10,262 | 4,087 | – | 471 | – | – | 20,076 | ||
| MB | Dauphin—Swan River—Marquette | Con | Con | 18,543 | 63.09% | 10,886 | 37.04% | 54.90% | 18,543 | 7,657 | 1,947 | – | 1,243 | – | – | 29,390 | ||
| MB | Elmwood—Transcona | NDP | Con | 15,298 | 46.40% | 300 | 0.91% | 55.93% | 15,298 | 14,998 | 1,660 | – | 1,017 | – | – | 32,973 | ||
| MB | Kildonan—St. Paul | Con | Con | 22,670 | 58.16% | 10,943 | 28.07% | 61.27% | 22,670 | 11,727 | 3,199 | – | 1,020 | 363 | – | 38,979 | ||
| MB | Portage—Lisgar | Con | Con | 26,899 | 75.99% | 23,421 | 66.16% | 59.44% | 26,899 | 3,478 | 2,221 | – | 1,996 | – | 805 | 35,399 | ||
| MB | Provencher | Con | Con | 27,820 | 70.60% | 20,769 | 52.71% | 61.73% | 27,820 | 7,051 | 2,645 | – | 1,164 | – | 725 | 39,405 | ||
| MB | Saint Boniface | Con | Con | 21,737 | 50.28% | 8,423 | 19.48% | 66.17% | 21,737 | 6,935 | 13,314 | – | 1,245 | – | – | 43,231 | ||
| MB | Selkirk—Interlake | Con | Con | 26,848 | 65.19% | 15,915 | 38.64% | 62.29% | 26,848 | 10,933 | 1,980 | – | 1,423 | – | – | 41,184 | ||
| MB | Winnipeg Centre | NDP | NDP | 13,928 | 53.66% | 6,755 | 26.03% | 48.20% | 7,173 | 13,928 | 2,872 | – | 1,830 | – | 152 | 25,955 | ||
| MB | Winnipeg North | NDP | Lib | 9,097 | 35.78% | 44 | 0.17% | 49.26% | 6,701 | 9,053 | 9,097 | – | 458 | – | 118 | 25,427 | ||
| MB | Winnipeg South | Con | Con | 22,840 | 52.24% | 8,544 | 19.54% | 68.45% | 22,840 | 5,693 | 14,296 | – | 889 | – | – | 43,718 | ||
| MB | Winnipeg South Centre | Lib | Con | 15,506 | 38.82% | 722 | 1.81% | 69.04% | 15,506 | 7,945 | 14,784 | – | 1,383 | 321 | – | 39,939 | ||
| NB | Acadie—Bathurst | NDP | NDP | 32,067 | 69.69% | 24,611 | 53.49% | 70.30% | 7,456 | 32,067 | 6,491 | – | – | – | – | 46,014 | ||
| NB | Beauséjour | Lib | Lib | 17,399 | 39.08% | 2,588 | 5.81% | 71.21% | 14,811 | 10,397 | 17,399 | – | 1,913 | – | – | 44,520 | ||
| NB | Fredericton | Con | Con | 21,573 | 48.38% | 10,947 | 24.55% | 64.24% | 21,573 | 10,626 | 10,336 | – | 1,790 | 266 | – | 44,591 | ||
| NB | Fundy Royal | Con | Con | 21,206 | 58.14% | 11,361 | 31.15% | 64.64% | 21,206 | 9,845 | 3,668 | – | 1,757 | – | – | 36,476 | ||
| NB | Madawaska—Restigouche | Lib | Con | 14,224 | 40.64% | 1,915 | 5.47% | 69.80% | 14,224 | 6,562 | 12,309 | – | 612 | 1,290 | – | 34,997 | ||
| NB | Miramichi | Con | Con | 16,112 | 52.41% | 9,015 | 29.32% | 71.40% | 16,112 | 7,097 | 6,800 | – | 735 | – | – | 30,744 | ||
| NB | Moncton—Riverview—Dieppe | Lib | Con | 17,408 | 35.73% | 2,161 | 4.44% | 65.17% | 17,408 | 14,053 | 15,247 | – | 2,016 | – | – | 48,724 | ||
| NB | New Brunswick Southwest | Con | Con | 18,066 | 56.64% | 10,653 | 33.40% | 64.71% | 18,066 | 7,413 | 4,320 | – | 1,646 | – | 450 | 31,895 | ||
| NB | Saint John | Con | Con | 18,456 | 49.73% | 7,074 | 19.06% | 58.02% | 18,456 | 11,382 | 5,964 | – | 1,017 | 294 | – | 37,113 | ||
| NB | Tobique—Mactaquac | Con | Con | 21,108 | 62.70% | 14,720 | 43.73% | 63.91% | 21,108 | 6,388 | 5,337 | – | 831 | – | – | 33,664 | ||
| NL | Avalon | Lib | Lib | 16,008 | 43.97% | 1,259 | 3.46% | 56.77% | 14,749 | 5,157 | 16,008 | – | 218 | 276 | – | 36,408 | ||
| NL | Bonavista—Gander—Grand Falls—Windsor | Lib | Lib | 17,977 | 57.70% | 9,382 | 30.11% | 44.77% | 8,595 | 4,306 | 17,977 | – | 279 | – | – | 31,157 | ||
| NL | Humber—St. Barbe—Baie Verte | Lib | Lib | 17,119 | 57.04% | 9,560 | 31.85% | 50.94% | 7,559 | 4,751 | 17,119 | – | 253 | 332 | – | 30,014 | ||
| NL | Labrador | Lib | Con | 4,256 | 39.81% | 79 | 0.74% | 52.91% | 4,256 | 2,120 | 4,177 | – | 139 | – | – | 10,692 | ||
| NL | Random—Burin—St. George's | Lib | Lib | 12,914 | 49.65% | 4,592 | 17.66% | 45.40% | 8,322 | 4,465 | 12,914 | – | 307 | – | – | 26,008 | ||
| NL | St. John's East | NDP | NDP | 31,388 | 71.22% | 22,190 | 50.35% | 57.85% | 9,198 | 31,388 | 3,019 | – | 467 | – | – | 44,072 | ||
| NL | St. John's South—Mount Pearl | Lib | NDP | 18,681 | 47.92% | 7,551 | 19.37% | 58.33% | 8,883 | 18,681 | 11,130 | – | 291 | – | – | 38,985 | ||
| NS | Cape Breton—Canso | Lib | Lib | 16,478 | 46.45% | 5,605 | 15.80% | 62.47% | 10,873 | 6,984 | 16,478 | – | 1,141 | – | – | 35,476 | ||
| NS | Central Nova | Con | Con | 21,593 | 56.79% | 12,181 | 32.03% | 65.99% | 21,593 | 9,412 | 5,614 | – | 1,406 | – | – | 38,025 | ||
| NS | Cumberland—Colchester—Musquodoboit Valley | Ind | Con | 21,041 | 52.46% | 11,719 | 29.22% | 58.34% | 21,041 | 9,322 | 7,264 | – | 2,109 | – | 375 | 40,111 | ||
| NS | Dartmouth—Cole Harbour | Lib | NDP | 15,678 | 36.27% | 497 | 1.15% | 61.45% | 10,702 | 15,678 | 15,181 | – | 1,662 | – | – | 43,223 | ||
| NS | Halifax | NDP | NDP | 23,746 | 51.64% | 11,953 | 25.99% | 63.02% | 8,276 | 23,746 | 11,793 | – | 2,020 | – | 152 | 45,987 | ||
| NS | Halifax West | Lib | Lib | 16,230 | 35.92% | 2,448 | 5.42% | 62.34% | 13,782 | 13,239 | 16,230 | – | 1,931 | – | – | 45,182 | ||
| NS | Kings—Hants | Lib | Lib | 15,887 | 39.56% | 1,173 | 2.92% | 61.76% | 14,714 | 8,043 | 15,887 | – | 1,520 | – | – | 40,164 | ||
| NS | Sackville—Eastern Shore | NDP | NDP | 22,483 | 54.07% | 9,821 | 23.62% | 59.47% | 12,662 | 22,483 | 4,673 | – | 1,762 | – | – | 41,580 | ||
| NS | South Shore—St. Margaret's | Con | Con | 17,948 | 43.15% | 2,915 | 7.01% | 62.23% | 17,948 | 15,033 | 7,037 | – | 1,579 | – | – | 41,597 | ||
| NS | Sydney—Victoria | Lib | Lib | 14,788 | 39.91% | 765 | 2.06% | 61.48% | 14,023 | 7,049 | 14,788 | – | 1,191 | – | – | 37,051 | ||
| NS | West Nova | Con | Con | 20,204 | 47.04% | 4,572 | 10.64% | 63.75% | 20,204 | 5,631 | 15,632 | – | 1,487 | – | – | 42,954 | ||
| ON | Ajax—Pickering | Lib | Con | 24,797 | 44.07% | 3,228 | 5.74% | 60.34% | 24,797 | 8,270 | 21,569 | – | 1,561 | – | 71 | 56,268 | ||
| ON | Algoma—Manitoulin—Kapuskasing | NDP | NDP | 18,747 | 51.73% | 7,756 | 21.40% | 61.88% | 10,991 | 18,747 | 5,374 | – | 1,130 | – | – | 36,242 | ||
| ON | Ancaster—Dundas—Flamborough—Westdale | Con | Con | 30,240 | 51.25% | 15,646 | 26.52% | 68.52% | 30,240 | 10,956 | 14,594 | – | 2,963 | – | 247 | 59,000 | ||
| ON | Barrie | Con | Con | 32,121 | 56.70% | 20,279 | 35.80% | 59.85% | 32,121 | 11,842 | 9,113 | – | 3,266 | – | 309 | 56,651 | ||
| ON | Beaches—East York | Lib | NDP | 20,265 | 41.64% | 5,298 | 10.89% | 66.66% | 11,067 | 20,265 | 14,967 | – | 2,240 | – | 130 | 48,669 | ||
| ON | Bramalea—Gore—Malton | Lib | Con | 19,907 | 34.44% | 539 | 0.93% | 53.56% | 19,907 | 19,368 | 16,402 | – | 1,748 | – | 371 | 57,796 | ||
| ON | Brampton West | Lib | Con | 28,320 | 44.75% | 6,192 | 9.78% | 54.00% | 28,320 | 11,225 | 22,128 | – | 1,224 | 387 | – | 63,284 | ||
| ON | Brampton—Springdale | Lib | Con | 24,618 | 48.26% | 10,397 | 20.38% | 57.71% | 24,618 | 10,022 | 14,221 | – | 1,926 | – | 219 | 51,006 | ||
| ON | Brant | Con | Con | 28,045 | 48.90% | 11,694 | 20.39% | 60.30% | 28,045 | 16,351 | 10,780 | – | 1,858 | 312 | – | 57,346 | ||
| ON | Bruce—Grey—Owen Sound | Con | Con | 28,744 | 56.30% | 19,736 | 38.66% | 64.12% | 28,744 | 9,008 | 8,203 | – | 5,099 | – | – | 51,054 | ||
| ON | Burlington | Con | Con | 32,958 | 54.16% | 18,804 | 30.90% | 66.54% | 32,958 | 11,449 | 14,154 | – | 2,151 | – | 140 | 60,852 | ||
| ON | Cambridge | Con | Con | 29,394 | 53.40% | 14,156 | 25.72% | 58.47% | 29,394 | 15,238 | 8,285 | – | 1,978 | – | 153 | 55,048 | ||
| ON | Carleton—Mississippi Mills | Con | Con | 43,723 | 56.95% | 25,330 | 32.99% | 71.66% | 43,723 | 11,223 | 18,393 | – | 3,434 | – | – | 76,773 | ||
| ON | Chatham-Kent—Essex | Con | Con | 23,360 | 53.76% | 11,911 | 27.41% | 58.83% | 23,360 | 11,449 | 7,172 | – | 1,470 | – | – | 43,451 | ||
| ON | Davenport | Lib | NDP | 21,096 | 53.74% | 10,150 | 25.86% | 59.18% | 5,573 | 21,096 | 10,946 | – | 1,344 | – | 295 | 39,254 | ||
| ON | Don Valley East | Lib | Con | 14,422 | 36.78% | 870 | 2.22% | 56.58% | 14,422 | 9,878 | 13,552 | – | 1,114 | – | 246 | 39,212 | ||
| ON | Don Valley West | Lib | Con | 22,962 | 42.93% | 611 | 1.14% | 65.35% | 22,962 | 6,280 | 22,351 | – | 1,703 | – | 186 | 53,482 | ||
| ON | Dufferin—Caledon | Con | Con | 28,647 | 59.01% | 21,515 | 44.32% | 60.05% | 28,647 | 6,409 | 6,361 | – | 7,132 | – | – | 48,549 | ||
| ON | Durham | Con | Con | 31,737 | 54.55% | 19,460 | 33.45% | 63.21% | 31,737 | 12,277 | 10,387 | – | 3,134 | – | 649 | 58,184 | ||
| ON | Eglinton—Lawrence | Lib | Con | 22,652 | 46.81% | 4,062 | 8.39% | 66.23% | 22,652 | 5,613 | 18,590 | – | 1,534 | – | – | 48,389 | ||
| ON | Elgin—Middlesex—London | Con | Con | 29,147 | 57.55% | 16,708 | 32.99% | 62.23% | 29,147 | 12,439 | 6,812 | – | 1,529 | – | 722 | 50,649 | ||
| ON | Essex | Con | Con | 25,327 | 48.06% | 6,789 | 12.88% | 58.54% | 25,327 | 18,538 | 7,465 | – | 1,290 | – | 77 | 52,697 | ||
| ON | Etobicoke Centre | Lib | Con | 21,644 | 41.21% | 26 | 0.05% | 64.57% | 21,644 | 7,735 | 21,618 | – | 1,377 | – | 149 | 52,523 | ||
| ON | Etobicoke North | Lib | Lib | 13,665 | 42.39% | 3,308 | 10.26% | 51.60% | 10,357 | 7,630 | 13,665 | – | – | – | 583 | 32,235 | ||
| ON | Etobicoke—Lakeshore | Lib | Con | 21,997 | 40.35% | 2,869 | 5.26% | 62.81% | 21,997 | 11,046 | 19,128 | – | 2,159 | – | 190 | 54,520 | ||
| ON | Glengarry—Prescott—Russell | Con | Con | 28,174 | 48.80% | 10,469 | 18.13% | 67.95% | 28,174 | 9,608 | 17,705 | – | 2,049 | – | 194 | 57,730 | ||
| ON | Guelph | Lib | Lib | 25,588 | 43.35% | 6,236 | 10.57% | 64.92% | 19,352 | 9,880 | 25,588 | – | 3,619 | – | 582 | 59,021 | ||
| ON | Haldimand—Norfolk | Con | Con | 25,655 | 50.94% | 13,106 | 26.02% | 62.78% | 25,655 | 10,062 | 12,549 | – | 1,665 | – | 435 | 50,366 | ||
| ON | Haliburton—Kawartha Lakes—Brock | Con | Con | 35,192 | 60.03% | 22,258 | 37.96% | 63.05% | 35,192 | 12,934 | 7,539 | – | 2,963 | – | – | 58,628 | ||
| ON | Halton | Con | Con | 44,214 | 54.52% | 23,311 | 28.74% | 61.70% | 44,214 | 12,960 | 20,903 | – | 2,778 | – | 249 | 81,104 | ||
| ON | Hamilton Centre | NDP | NDP | 23,849 | 57.04% | 12,829 | 30.68% | 53.63% | 11,020 | 23,849 | 5,912 | – | – | – | 1,032 | 41,813 | ||
| ON | Hamilton East—Stoney Creek | NDP | NDP | 21,931 | 45.18% | 4,364 | 8.99% | 57.06% | 17,567 | 21,931 | 6,411 | – | 1,450 | – | 1,178 | 48,537 | ||
| ON | Hamilton Mountain | NDP | NDP | 25,595 | 47.17% | 7,659 | 14.11% | 61.05% | 17,936 | 25,595 | 8,787 | – | 1,505 | 171 | 270 | 54,264 | ||
| ON | Huron—Bruce | Con | Con | 29,255 | 54.95% | 15,762 | 29.61% | 67.97% | 29,255 | 13,493 | 8,784 | – | 1,455 | 254 | – | 53,241 | ||
| ON | Kenora | Con | Con | 11,567 | 47.05% | 4,712 | 19.17% | 58.77% | 11,567 | 6,855 | 5,381 | – | 636 | 147 | – | 24,586 | ||
| ON | Kingston and the Islands | Lib | Lib | 23,842 | 39.31% | 2,653 | 4.37% | 63.38% | 21,189 | 13,065 | 23,842 | – | 2,561 | – | – | 60,657 | ||
| ON | Kitchener Centre | Con | Con | 21,119 | 42.40% | 5,527 | 11.10% | 62.15% | 21,119 | 10,742 | 15,592 | – | 1,972 | 199 | 185 | 49,809 | ||
| ON | Kitchener—Conestoga | Con | Con | 28,902 | 54.12% | 17,237 | 32.28% | 60.36% | 28,902 | 11,665 | 10,653 | – | 2,184 | – | – | 53,404 | ||
| ON | Kitchener—Waterloo | Con | Con | 27,039 | 40.85% | 2,144 | 3.24% | 69.19% | 27,039 | 10,606 | 24,895 | – | 3,158 | 174 | 311 | 66,183 | ||
| ON | Lambton—Kent—Middlesex | Con | Con | 29,546 | 57.68% | 17,247 | 33.67% | 64.51% | 29,546 | 12,299 | 7,264 | – | 1,701 | – | 413 | 51,223 | ||
| ON | Lanark—Frontenac—Lennox and Addington | Con | Con | 33,754 | 57.27% | 21,580 | 36.61% | 64.63% | 33,754 | 12,174 | 9,940 | – | 2,702 | 370 | – | 58,940 | ||
| ON | Leeds—Grenville | Con | Con | 29,991 | 60.81% | 20,958 | 42.49% | 64.42% | 29,991 | 9,033 | 7,839 | – | 2,460 | – | – | 49,323 | ||
| ON | London North Centre | Lib | Con | 19,468 | 36.96% | 1,665 | 3.16% | 59.79% | 19,468 | 12,996 | 17,803 | – | 2,177 | – | 229 | 52,673 | ||
| ON | London West | Con | Con | 27,675 | 44.49% | 11,023 | 17.72% | 66.53% | 27,675 | 16,109 | 16,652 | – | 1,703 | – | 65 | 62,204 | ||
| ON | London—Fanshawe | NDP | NDP | 21,689 | 50.90% | 7,395 | 17.35% | 57.03% | 14,294 | 21,689 | 4,893 | – | 1,202 | – | 535 | 42,613 | ||
| ON | Markham—Unionville | Lib | Lib | 19,429 | 38.95% | 1,695 | 3.40% | 54.17% | 17,734 | 10,897 | 19,429 | – | 1,597 | – | 231 | 49,888 | ||
| ON | Mississauga East—Cooksville | Lib | Con | 18,796 | 39.97% | 676 | 1.44% | 55.65% | 18,796 | 8,836 | 18,120 | – | 1,032 | – | 241 | 47,025 | ||
| ON | Mississauga South | Lib | Con | 22,991 | 46.48% | 4,598 | 9.30% | 63.21% | 22,991 | 6,354 | 18,393 | – | 1,532 | 194 | – | 49,464 | ||
| ON | Mississauga—Brampton South | Lib | Con | 23,632 | 44.72% | 5,053 | 9.56% | 56.28% | 23,632 | 9,465 | 18,579 | – | 1,044 | – | 127 | 52,847 | ||
| ON | Mississauga—Erindale | Con | Con | 29,793 | 46.95% | 8,252 | 13.00% | 60.39% | 29,793 | 10,327 | 21,541 | – | 1,694 | – | 99 | 63,454 | ||
| ON | Mississauga—Streetsville | Lib | Con | 22,104 | 43.86% | 3,453 | 6.85% | 57.85% | 22,104 | 7,834 | 18,651 | – | 1,802 | – | – | 50,391 | ||
| ON | Nepean—Carleton | Con | Con | 43,477 | 54.45% | 23,331 | 29.22% | 71.19% | 43,477 | 12,962 | 20,146 | – | 3,260 | – | – | 79,845 | ||
| ON | Newmarket—Aurora | Con | Con | 31,600 | 54.29% | 17,692 | 30.40% | 63.00% | 31,600 | 8,886 | 13,908 | – | 2,628 | – | 1,180 | 58,202 | ||
| ON | Niagara Falls | Con | Con | 28,748 | 53.26% | 16,067 | 29.76% | 56.40% | 28,748 | 12,681 | 10,206 | – | 2,086 | – | 259 | 53,980 | ||
| ON | Niagara West—Glanbrook | Con | Con | 33,701 | 57.25% | 20,967 | 35.62% | 65.79% | 33,701 | 12,734 | 8,699 | – | 2,530 | – | 1,199 | 58,863 | ||
| ON | Nickel Belt | NDP | NDP | 24,566 | 54.97% | 12,063 | 26.99% | 62.06% | 12,503 | 24,566 | 6,308 | – | 1,252 | – | 59 | 44,688 | ||
| ON | Nipissing—Timiskaming | Lib | Con | 15,495 | 36.66% | 18 | 0.04% | 60.06% | 15,495 | 8,781 | 15,477 | – | 2,518 | – | – | 42,271 | ||
| ON | Northumberland—Quinte West | Con | Con | 32,853 | 53.83% | 20,031 | 32.82% | 63.67% | 32,853 | 12,626 | 12,822 | – | 2,733 | – | – | 61,034 | ||
| ON | Oak Ridges—Markham | Con | Con | 46,241 | 51.12% | 20,680 | 22.86% | 59.03% | 46,241 | 15,229 | 25,561 | – | 2,349 | – | 1,080 | 90,460 | ||
| ON | Oakville | Con | Con | 30,068 | 51.65% | 12,178 | 20.92% | 67.98% | 30,068 | 8,117 | 17,890 | – | 2,140 | – | – | 58,215 | ||
| ON | Oshawa | Con | Con | 26,034 | 51.31% | 6,822 | 13.45% | 56.82% | 26,034 | 19,212 | 3,536 | – | 1,631 | – | 321 | 50,734 | ||
| ON | Ottawa Centre | NDP | NDP | 33,805 | 52.11% | 19,742 | 30.43% | 72.37% | 14,063 | 33,805 | 13,049 | – | 3,262 | 210 | 479 | 64,868 | ||
| ON | Ottawa South | Lib | Lib | 25,963 | 44.01% | 6,329 | 10.73% | 67.82% | 19,634 | 10,712 | 25,963 | – | 1,787 | – | 895 | 58,991 | ||
| ON | Ottawa West—Nepean | Con | Con | 25,226 | 44.71% | 7,436 | 13.18% | 68.44% | 25,226 | 11,128 | 17,790 | – | 2,279 | – | – | 56,423 | ||
| ON | Ottawa—Vanier | Lib | Lib | 20,009 | 38.17% | 4,618 | 8.81% | 71.71% | 14,184 | 15,391 | 20,009 | – | 2,716 | – | 122 | 52,422 | ||
| ON | Ottawa—Orléans | Con | Con | 28,584 | 44.55% | 3,935 | 6.13% | 66.50% | 28,584 | 9,086 | 24,649 | – | 1,839 | – | – | 64,158 | ||
| ON | Oxford | Con | Con | 27,973 | 58.90% | 15,809 | 33.29% | 61.88% | 27,973 | 12,164 | 4,521 | – | 2,058 | – | 776 | 47,492 | ||
| ON | Parkdale—High Park | Lib | NDP | 24,046 | 47.20% | 7,289 | 14.31% | 68.71% | 7,924 | 24,046 | 16,757 | – | 1,666 | – | 552 | 50,945 | ||
| ON | Parry Sound—Muskoka | Con | Con | 25,864 | 55.73% | 14,647 | 31.56% | 65.11% | 25,864 | 11,217 | 5,330 | – | 3,776 | 168 | 54 | 46,409 | ||
| ON | Perth—Wellington | Con | Con | 25,281 | 54.48% | 15,420 | 33.23% | 63.47% | 25,281 | 9,861 | 8,341 | – | 2,112 | – | 806 | 46,401 | ||
| ON | Peterborough | Con | Con | 29,393 | 49.67% | 14,670 | 24.79% | 64.71% | 29,393 | 14,723 | 12,664 | – | 2,105 | 189 | 104 | 59,178 | ||
| ON | Pickering—Scarborough East | Lib | Con | 19,220 | 40.11% | 1,207 | 2.52% | 61.24% | 19,220 | 8,932 | 18,013 | – | 1,751 | – | – | 47,916 | ||
| ON | Prince Edward—Hastings | Con | Con | 29,062 | 53.25% | 16,122 | 29.54% | 61.40% | 29,062 | 12,940 | 10,230 | – | 1,887 | 283 | 171 | 54,573 | ||
| ON | Renfrew—Nipissing—Pembroke | Con | Con | 27,462 | 53.43% | 17,851 | 34.73% | 65.85% | 27,462 | 6,903 | 6,545 | – | 877 | 9,611 | – | 51,398 | ||
| ON | Richmond Hill | Lib | Con | 22,078 | 44.14% | 4,407 | 8.81% | 55.25% | 22,078 | 8,433 | 17,671 | – | 1,832 | – | – | 50,014 | ||
| ON | Sarnia—Lambton | Con | Con | 26,112 | 52.58% | 11,256 | 22.66% | 62.58% | 26,112 | 14,856 | 6,931 | – | 1,252 | – | 514 | 49,665 | ||
| ON | Sault Ste. Marie | NDP | Con | 18,328 | 41.44% | 1,861 | 4.21% | 64.19% | 18,328 | 16,467 | 8,343 | – | 945 | – | 149 | 44,232 | ||
| ON | Scarborough Centre | Lib | Con | 13,498 | 35.55% | 1,470 | 3.87% | 54.34% | 13,498 | 11,443 | 12,028 | – | 998 | – | – | 37,967 | ||
| ON | Scarborough Southwest | Lib | NDP | 14,119 | 35.05% | 1,289 | 3.20% | 58.37% | 12,830 | 14,119 | 11,699 | – | 1,635 | – | – | 40,283 | ||
| ON | Scarborough—Agincourt | Lib | Lib | 18,498 | 45.39% | 4,568 | 11.21% | 56.03% | 13,930 | 7,376 | 18,498 | – | 946 | – | – | 40,750 | ||
| ON | Scarborough—Guildwood | Lib | Lib | 13,849 | 36.20% | 691 | 1.81% | 56.76% | 13,158 | 10,145 | 13,849 | – | 848 | 259 | – | 38,259 | ||
| ON | Scarborough—Rouge River | Lib | NDP | 18,935 | 40.62% | 5,000 | 10.73% | 54.98% | 13,935 | 18,935 | 12,699 | – | 684 | 357 | – | 46,610 | ||
| ON | Simcoe North | Con | Con | 31,581 | 54.45% | 20,066 | 34.60% | 64.07% | 31,581 | 11,515 | 11,090 | – | 3,489 | – | 322 | 57,997 | ||
| ON | Simcoe—Grey | Con | Con | 31,784 | 49.37% | 20,599 | 32.00% | 65.06% | 31,784 | 11,185 | 8,207 | – | 3,482 | 8,714 | 1,001 | 64,373 | ||
| ON | St. Catharines | Con | Con | 25,571 | 50.86% | 13,598 | 27.05% | 60.50% | 25,571 | 11,973 | 10,358 | – | 1,924 | – | 448 | 50,274 | ||
| ON | St. Paul's | Lib | Lib | 22,409 | 40.60% | 4,545 | 8.23% | 66.54% | 17,864 | 12,124 | 22,409 | – | 2,495 | – | 303 | 55,195 | ||
| ON | Stormont—Dundas—South Glengarry | Con | Con | 29,538 | 62.12% | 21,028 | 44.22% | 62.09% | 29,538 | 8,313 | 8,510 | – | 1,038 | – | 151 | 47,550 | ||
| ON | Sudbury | NDP | NDP | 22,684 | 49.92% | 9,803 | 21.57% | 63.35% | 12,881 | 22,684 | 8,172 | – | 1,359 | 116 | 229 | 45,441 | ||
| ON | Thornhill | Con | Con | 36,629 | 61.38% | 22,504 | 37.71% | 60.03% | 36,629 | 7,141 | 14,125 | – | 1,562 | – | 215 | 59,672 | ||
| ON | Thunder Bay—Rainy River | NDP | NDP | 18,085 | 48.67% | 7,988 | 21.50% | 59.41% | 10,097 | 18,085 | 8,067 | – | 909 | – | – | 37,158 | ||
| ON | Thunder Bay—Superior North | NDP | NDP | 18,334 | 49.92% | 7,440 | 20.26% | 59.92% | 10,894 | 18,334 | 6,117 | – | 1,115 | – | 265 | 36,725 | ||
| ON | Timmins—James Bay | NDP | NDP | 16,738 | 50.39% | 6,212 | 18.70% | 55.58% | 10,526 | 16,738 | 5,230 | – | 724 | – | – | 33,218 | ||
| ON | Toronto Centre | Lib | Lib | 22,832 | 41.01% | 6,014 | 10.80% | 62.93% | 12,604 | 16,818 | 22,832 | – | 2,796 | 108 | 512 | 55,670 | ||
| ON | Toronto—Danforth | NDP | NDP | 29,235 | 60.80% | 20,763 | 43.18% | 65.01% | 6,885 | 29,235 | 8,472 | – | 3,107 | – | 387 | 48,086 | ||
| ON | Trinity—Spadina | NDP | NDP | 35,601 | 54.51% | 20,325 | 31.12% | 64.95% | 10,976 | 35,601 | 15,276 | – | 2,861 | – | 596 | 65,310 | ||
| ON | Vaughan | Lib | Con | 38,533 | 56.32% | 18,098 | 26.45% | 55.10% | 38,533 | 7,940 | 20,435 | – | 1,515 | – | – | 68,423 | ||
| ON | Welland | NDP | NDP | 21,917 | 42.21% | 1,022 | 1.97% | 61.43% | 20,895 | 21,917 | 7,276 | – | 1,297 | 169 | 370 | 51,924 | ||
| ON | Wellington—Halton Hills | Con | Con | 35,132 | 63.70% | 26,098 | 47.32% | 66.24% | 35,132 | 7,146 | 9,034 | – | 3,527 | – | 316 | 55,155 | ||
| ON | Whitby—Oshawa | Con | Con | 37,525 | 58.42% | 23,220 | 36.15% | 62.53% | 37,525 | 14,305 | 9,066 | – | 3,143 | – | 198 | 64,237 | ||
| ON | Willowdale | Lib | Con | 22,207 | 41.70% | 932 | 1.75% | 57.23% | 22,207 | 9,777 | 21,275 | – | – | – | – | 53,259 | ||
| ON | Windsor West | NDP | NDP | 21,592 | 54.33% | 9,015 | 22.68% | 48.79% | 12,577 | 21,592 | 4,327 | – | 1,096 | – | 153 | 39,745 | ||
| ON | Windsor—Tecumseh | NDP | NDP | 22,235 | 49.92% | 7,290 | 16.37% | 53.01% | 14,945 | 22,235 | 5,764 | – | 1,354 | – | 242 | 44,540 | ||
| ON | York Centre | Lib | Con | 20,356 | 48.50% | 6,377 | 15.19% | 58.98% | 20,356 | 6,656 | 13,979 | – | 979 | – | – | 41,970 | ||
| ON | York South—Weston | Lib | NDP | 14,122 | 40.12% | 2,580 | 7.33% | 51.91% | 8,559 | 14,122 | 11,542 | – | 975 | – | – | 35,198 | ||
| ON | York West | Lib | Lib | 13,030 | 47.00% | 5,309 | 19.15% | 48.19% | 6,122 | 7,721 | 13,030 | – | 450 | – | 401 | 27,724 | ||
| ON | York—Simcoe | Con | Con | 33,614 | 63.58% | 23,424 | 44.31% | 57.89% | 33,614 | 10,190 | 5,702 | – | 2,851 | – | 509 | 52,866 | ||
| PE | Cardigan | Lib | Lib | 10,486 | 49.63% | 2,379 | 11.26% | 77.00% | 8,107 | 2,164 | 10,486 | – | 373 | – | – | 21,130 | ||
| PE | Charlottetown | Lib | Lib | 7,292 | 39.48% | 1,252 | 6.78% | 69.44% | 6,040 | 4,632 | 7,292 | – | 417 | – | 87 | 18,468 | ||
| PE | Egmont | Con | Con | 10,467 | 54.65% | 4,470 | 23.34% | 70.99% | 10,467 | 2,369 | 5,997 | – | 320 | – | – | 19,153 | ||
| PE | Malpeque | Lib | Lib | 8,605 | 42.40% | 671 | 3.31% | 75.73% | 7,934 | 2,970 | 8,605 | – | 785 | – | – | 20,294 | ||
| QC | Abitibi—Baie-James—Nunavik—Eeyou | BQ | NDP | 13,961 | 44.79% | 6,872 | 22.05% | 53.35% | 7,089 | 13,961 | 3,282 | 5,615 | 1,221 | – | – | 31,168 | ||
| QC | Abitibi—Témiscamingue | BQ | NDP | 24,763 | 51.22% | 9,505 | 19.66% | 59.70% | 4,777 | 24,763 | 2,859 | 15,258 | 694 | – | – | 48,351 | ||
| QC | Ahuntsic | BQ | BQ | 14,908 | 31.80% | 708 | 1.51% | 64.71% | 3,770 | 14,200 | 13,087 | 14,908 | 620 | – | 299 | 46,884 | ||
| QC | Alfred-Pellan | BQ | NDP | 23,098 | 42.09% | 10,594 | 19.31% | 65.72% | 6,157 | 23,098 | 12,070 | 12,504 | 798 | 245 | – | 54,872 | ||
| QC | Argenteuil—Papineau—Mirabel | BQ | NDP | 25,802 | 44.27% | 8,922 | 15.31% | 61.06% | 6,497 | 25,802 | 7,135 | 16,880 | 1,506 | 342 | 117 | 58,279 | ||
| QC | Bas-Richelieu—Nicolet—Bécancour | BQ | BQ | 19,046 | 38.30% | 1,341 | 2.70% | 65.71% | 6,478 | 17,705 | 5,024 | 19,046 | 1,479 | – | – | 49,732 | ||
| QC | Beauce | Con | Con | 26,799 | 50.71% | 10,968 | 20.75% | 63.02% | 26,799 | 15,831 | 5,833 | 3,535 | 852 | – | – | 52,850 | ||
| QC | Beauharnois—Salaberry | BQ | NDP | 23,998 | 43.80% | 5,816 | 10.61% | 62.12% | 7,049 | 23,998 | 4,559 | 18,182 | 1,003 | – | – | 54,791 | ||
| QC | Beauport—Limoilou | Con | NDP | 24,306 | 46.07% | 10,461 | 19.83% | 63.17% | 13,845 | 24,306 | 3,162 | 10,250 | 950 | – | 246 | 52,759 | ||
| QC | Berthier—Maskinongé | BQ | NDP | 22,403 | 39.58% | 5,735 | 10.13% | 63.57% | 7,904 | 22,403 | 8,060 | 16,668 | 1,196 | – | 373 | 56,604 | ||
| QC | Bourassa | Lib | Lib | 15,550 | 40.91% | 3,280 | 8.63% | 55.12% | 3,354 | 12,270 | 15,550 | 6,105 | 613 | – | 121 | 38,013 | ||
| QC | Brome—Missisquoi | BQ | NDP | 22,407 | 42.64% | 10,818 | 20.59% | 66.11% | 6,256 | 22,407 | 11,589 | 11,173 | 1,120 | – | – | 52,545 | ||
| QC | Brossard—La Prairie | Lib | NDP | 25,512 | 41.02% | 8,536 | 13.72% | 64.84% | 7,806 | 25,512 | 16,976 | 10,890 | 900 | – | 110 | 62,194 | ||
| QC | Chambly—Borduas | BQ | NDP | 29,591 | 42.74% | 10,444 | 15.08% | 70.42% | 5,425 | 29,591 | 6,165 | 19,147 | 1,072 | 7,843 | – | 69,243 | ||
| QC | Charlesbourg—Haute-Saint-Charles | Con | NDP | 24,131 | 45.01% | 7,911 | 14.76% | 66.08% | 16,220 | 24,131 | 3,505 | 8,732 | 832 | – | 189 | 53,609 | ||
| QC | Châteauguay—Saint-Constant | BQ | NDP | 29,156 | 52.04% | 14,199 | 25.34% | 65.06% | 5,756 | 29,156 | 5,069 | 14,957 | 923 | – | 162 | 56,023 | ||
| QC | Chicoutimi—Le Fjord | BQ | NDP | 19,430 | 38.13% | 4,755 | 9.33% | 63.90% | 12,881 | 19,430 | 2,852 | 14,675 | 780 | – | 340 | 50,958 | ||
| QC | Compton—Stanstead | BQ | NDP | 24,097 | 47.59% | 10,918 | 21.56% | 63.64% | 5,982 | 24,097 | 6,132 | 13,179 | 1,241 | – | – | 50,631 | ||
| QC | Drummond | BQ | NDP | 24,489 | 51.64% | 14,079 | 29.69% | 62.50% | 7,555 | 24,489 | 3,979 | 10,410 | 987 | – | – | 47,420 | ||
| QC | Gaspésie—Îles-de-la-Madeleine | BQ | NDP | 12,427 | 33.76% | 777 | 2.11% | 53.85% | 6,292 | 12,427 | 5,533 | 11,650 | 913 | – | – | 36,815 | ||
| QC | Gatineau | BQ | NDP | 35,262 | 61.83% | 26,643 | 46.72% | 64.10% | 4,532 | 35,262 | 7,975 | 8,619 | 639 | – | – | 57,027 | ||
| QC | Haute-Gaspésie—La Mitis—Matane—Matapédia | BQ | BQ | 12,633 | 36.05% | 3,669 | 10.47% | 59.66% | 5,253 | 7,484 | 8,964 | 12,633 | 707 | – | – | 35,041 | ||
| QC | Hochelaga | BQ | NDP | 22,314 | 48.17% | 7,863 | 16.97% | 58.43% | 3,126 | 22,314 | 5,064 | 14,451 | 798 | – | 569 | 46,322 | ||
| QC | Honoré-Mercier | Lib | NDP | 17,545 | 36.37% | 2,904 | 6.02% | 59.77% | 5,992 | 17,545 | 14,641 | 8,935 | 770 | – | 351 | 48,234 | ||
| QC | Hull—Aylmer | Lib | NDP | 35,194 | 59.20% | 23,143 | 38.93% | 65.03% | 6,058 | 35,194 | 12,051 | 5,019 | 1,125 | – | – | 59,447 | ||
| QC | Jeanne-Le Ber | BQ | NDP | 23,293 | 44.66% | 10,658 | 20.43% | 59.08% | 4,678 | 23,293 | 10,054 | 12,635 | 1,377 | – | 121 | 52,158 | ||
| QC | Joliette | BQ | NDP | 27,050 | 47.33% | 8,246 | 14.43% | 63.31% | 5,525 | 27,050 | 3,545 | 18,804 | 2,227 | – | – | 57,151 | ||
| QC | Jonquière—Alma | Con | NDP | 22,900 | 43.44% | 4,331 | 8.22% | 65.77% | 18,569 | 22,900 | 1,043 | 9,554 | 652 | – | – | 52,718 | ||
| QC | La Pointe-de-l'Île | BQ | NDP | 23,033 | 48.34% | 7,558 | 15.86% | 60.43% | 3,664 | 23,033 | 4,369 | 15,475 | 898 | – | 213 | 47,652 | ||
| QC | Lac-Saint-Louis | Lib | Lib | 18,457 | 34.11% | 2,204 | 4.07% | 65.90% | 15,394 | 16,253 | 18,457 | 1,689 | 2,315 | – | – | 54,108 | ||
| QC | LaSalle—Émard | Lib | NDP | 17,691 | 42.15% | 6,519 | 15.53% | 56.92% | 5,516 | 17,691 | 11,172 | 6,151 | 946 | – | 496 | 41,972 | ||
| QC | Laurentides—Labelle | BQ | NDP | 24,800 | 43.83% | 7,001 | 12.37% | 62.25% | 5,246 | 24,800 | 7,169 | 17,799 | 1,423 | – | 149 | 56,586 | ||
| QC | Laurier—Sainte-Marie | BQ | NDP | 23,373 | 46.64% | 5,382 | 10.74% | 63.41% | 1,764 | 23,373 | 4,976 | 17,991 | 1,324 | 73 | 612 | 50,113 | ||
| QC | Laval | BQ | NDP | 22,050 | 43.33% | 10,483 | 20.60% | 60.59% | 6,366 | 22,050 | 9,422 | 11,567 | 1,260 | – | 224 | 50,889 | ||
| QC | Laval—Les Îles | Lib | NDP | 25,703 | 47.64% | 14,595 | 27.05% | 58.92% | 8,587 | 25,703 | 11,108 | 7,022 | 966 | – | 563 | 53,949 | ||
| QC | Lévis—Bellechasse | Con | Con | 25,850 | 43.95% | 5,960 | 10.13% | 67.10% | 25,850 | 19,890 | 3,421 | 8,757 | 903 | – | – | 58,821 | ||
| QC | Longueuil—Pierre-Boucher | BQ | NDP | 27,119 | 51.93% | 12,938 | 24.78% | 69.21% | 4,339 | 27,119 | 5,321 | 14,181 | 1,032 | – | 228 | 52,220 | ||
| QC | Lotbinière—Chutes-de-la-Chaudière | Con | Con | 22,460 | 39.88% | 777 | 1.38% | 73.83% | 22,460 | 21,683 | 2,866 | 8,381 | 936 | – | – | 56,326 | ||
| QC | Louis-Hébert | BQ | NDP | 23,373 | 38.65% | 8,733 | 14.44% | 66.20% | 13,207 | 23,373 | 8,110 | 14,640 | 996 | – | 143 | 60,469 | ||
| QC | Louis-Saint-Laurent | Con | NDP | 22,629 | 39.87% | 1,295 | 2.28% | 65.88% | 21,334 | 22,629 | 3,612 | 8,148 | 857 | – | 175 | 56,755 | ||
| QC | Manicouagan | BQ | NDP | 16,437 | 48.93% | 5,942 | 17.69% | 51.97% | 3,878 | 16,437 | 1,882 | 10,495 | 898 | – | – | 33,590 | ||
| QC | Marc-Aurèle-Fortin | BQ | NDP | 29,107 | 49.68% | 13,637 | 23.28% | 67.49% | 5,768 | 29,107 | 7,035 | 15,470 | 1,208 | – | – | 58,588 | ||
| QC | Mégantic—L'Érable | Con | Con | 21,931 | 49.14% | 10,215 | 22.89% | 61.47% | 21,931 | 11,716 | 2,601 | 7,481 | 655 | – | 250 | 44,634 | ||
| QC | Montcalm | BQ | NDP | 34,434 | 52.97% | 14,825 | 22.80% | 61.06% | 5,118 | 34,434 | 3,501 | 19,609 | 2,347 | – | – | 65,009 | ||
| QC | Montmagny—L'Islet—Kamouraska—Rivière-du-Loup | BQ | NDP | 17,285 | 36.36% | 9 | 0.02% | 62.29% | 17,276 | 17,285 | 2,743 | 9,550 | 691 | – | – | 47,545 | ||
| QC | Montmorency—Charlevoix—Haute-Côte-Nord | BQ | NDP | 17,601 | 37.35% | 1,176 | 2.50% | 57.35% | 9,660 | 17,601 | 2,628 | 16,425 | 814 | – | – | 47,128 | ||
| QC | Mount Royal | Lib | Lib | 16,151 | 41.41% | 2,260 | 5.79% | 64.59% | 13,891 | 6,963 | 16,151 | 1,136 | 683 | 74 | 109 | 39,007 | ||
| QC | Notre-Dame-de-Grâce—Lachine | Lib | NDP | 17,943 | 39.73% | 3,536 | 7.83% | 58.51% | 6,574 | 17,943 | 14,407 | 3,983 | 1,914 | 207 | 131 | 45,159 | ||
| QC | Outremont | NDP | NDP | 21,906 | 56.37% | 12,702 | 32.69% | 59.70% | 3,408 | 21,906 | 9,204 | 3,199 | 838 | – | 303 | 38,858 | ||
| QC | Papineau | Lib | Lib | 16,429 | 38.41% | 4,327 | 10.12% | 61.05% | 2,021 | 12,102 | 16,429 | 11,091 | 806 | 95 | 228 | 42,772 | ||
| QC | Pierrefonds—Dollard | Lib | NDP | 16,390 | 34.13% | 1,758 | 3.66% | 59.15% | 12,901 | 16,390 | 14,632 | 2,392 | 1,710 | – | – | 48,025 | ||
| QC | Pontiac | Con | NDP | 22,376 | 45.71% | 7,935 | 16.21% | 59.71% | 14,441 | 22,376 | 6,242 | 4,917 | 849 | – | 124 | 48,949 | ||
| QC | Portneuf—Jacques-Cartier | Ind | NDP | 22,387 | 42.67% | 7,793 | 14.85% | 65.87% | – | 22,387 | 3,463 | 10,745 | 1,279 | 14,594 | – | 52,468 | ||
| QC | Québec | BQ | NDP | 22,393 | 42.64% | 7,709 | 14.68% | 66.14% | 9,330 | 22,393 | 4,735 | 14,684 | 1,144 | – | 228 | 52,514 | ||
| QC | Repentigny | BQ | NDP | 32,131 | 51.92% | 12,889 | 20.83% | 66.80% | 4,606 | 32,131 | 4,830 | 19,242 | 1,078 | – | – | 61,887 | ||
| QC | Richmond—Arthabaska | BQ | BQ | 18,033 | 33.83% | 717 | 1.35% | 65.56% | 13,145 | 17,316 | 3,711 | 18,033 | 1,098 | – | – | 53,303 | ||
| QC | Rimouski-Neigette—Témiscouata—Les Basques | BQ | NDP | 18,360 | 42.98% | 5,190 | 12.15% | 62.90% | 6,218 | 18,360 | 4,101 | 13,170 | 867 | – | – | 42,716 | ||
| QC | Rivière-des-Mille-Îles | BQ | NDP | 25,639 | 49.21% | 10,766 | 20.66% | 66.60% | 5,057 | 25,639 | 5,300 | 14,873 | 1,229 | – | – | 52,098 | ||
| QC | Rivière-du-Nord | BQ | NDP | 29,603 | 55.28% | 14,498 | 27.07% | 60.05% | 4,469 | 29,603 | 3,400 | 15,105 | 972 | – | – | 53,549 | ||
| QC | Roberval—Lac-Saint-Jean | Con | Con | 18,438 | 45.68% | 7,256 | 17.98% | 64.20% | 18,438 | 11,182 | 1,615 | 8,577 | 553 | – | – | 40,365 | ||
| QC | Rosemont—La Petite-Patrie | BQ | NDP | 27,484 | 51.00% | 9,782 | 18.15% | 66.47% | 2,328 | 27,484 | 4,920 | 17,702 | 899 | – | 557 | 53,890 | ||
| QC | Saint-Bruno—Saint-Hubert | BQ | NDP | 24,361 | 44.64% | 8,977 | 16.45% | 67.20% | 5,887 | 24,361 | 7,423 | 15,384 | 1,523 | – | – | 54,578 | ||
| QC | Saint-Hyacinthe—Bagot | BQ | NDP | 26,963 | 52.36% | 14,312 | 27.79% | 66.04% | 8,108 | 26,963 | 2,784 | 12,651 | 994 | – | – | 51,500 | ||
| QC | Saint-Jean | BQ | NDP | 24,943 | 47.48% | 8,920 | 16.98% | 62.26% | 5,603 | 24,943 | 4,644 | 16,023 | 1,326 | – | – | 52,539 | ||
| QC | Saint-Lambert | BQ | NDP | 18,705 | 42.65% | 7,352 | 16.76% | 60.45% | 4,396 | 18,705 | 8,463 | 11,353 | 944 | – | – | 43,861 | ||
| QC | Saint-Laurent—Cartierville | Lib | Lib | 17,726 | 43.43% | 5,778 | 14.16% | 52.18% | 7,124 | 11,948 | 17,726 | 2,981 | 857 | – | 176 | 40,812 | ||
| QC | Saint-Léonard—Saint-Michel | Lib | Lib | 15,340 | 42.30% | 3,620 | 9.98% | 51.31% | 4,991 | 11,720 | 15,340 | 3,396 | 657 | – | 162 | 36,266 | ||
| QC | Saint-Maurice—Champlain | BQ | NDP | 18,628 | 39.07% | 4,667 | 9.79% | 60.68% | 8,447 | 18,628 | 5,670 | 13,961 | 972 | – | – | 47,678 | ||
| QC | Shefford | BQ | NDP | 27,575 | 51.09% | 14,960 | 27.72% | 64.79% | 7,908 | 27,575 | 4,855 | 12,615 | 1,022 | – | – | 53,975 | ||
| QC | Sherbrooke | BQ | NDP | 22,415 | 43.10% | 3,750 | 7.21% | 63.41% | 4,784 | 22,415 | 5,020 | 18,665 | 894 | – | 233 | 52,011 | ||
| QC | Terrebonne—Blainville | BQ | NDP | 28,260 | 49.34% | 10,597 | 18.50% | 65.70% | 5,236 | 28,260 | 4,893 | 17,663 | 1,219 | – | – | 57,271 | ||
| QC | Trois-Rivières | BQ | NDP | 26,981 | 53.57% | 14,994 | 29.77% | 64.45% | 6,205 | 26,981 | 3,617 | 11,987 | 972 | 346 | 256 | 50,364 | ||
| QC | Vaudreuil-Soulanges | BQ | NDP | 30,177 | 43.61% | 12,396 | 17.91% | 67.07% | 11,360 | 30,177 | 8,023 | 17,781 | 1,864 | – | – | 69,205 | ||
| QC | Verchères—Les Patriotes | BQ | NDP | 24,514 | 43.31% | 3,921 | 6.93% | 71.42% | 4,884 | 24,514 | 5,352 | 20,593 | 1,259 | – | – | 56,602 | ||
| QC | Westmount—Ville-Marie | Lib | Lib | 15,346 | 37.18% | 642 | 1.56% | 53.36% | 7,218 | 14,704 | 15,346 | 2,278 | 1,516 | – | 213 | 41,275 | ||
| SK | Battlefords—Lloydminster | Con | Con | 19,203 | 66.90% | 11,436 | 39.84% | 56.88% | 19,203 | 7,767 | 950 | – | 785 | – | – | 28,705 | ||
| SK | Blackstrap | Con | Con | 23,280 | 54.40% | 7,511 | 17.55% | 69.26% | 23,280 | 15,769 | 2,713 | – | 1,033 | – | – | 42,795 | ||
| SK | Cypress Hills—Grasslands | Con | Con | 20,555 | 69.85% | 14,307 | 48.62% | 66.25% | 20,555 | 6,248 | 1,838 | – | 788 | – | – | 29,429 | ||
| SK | Desnethé—Missinippi—Churchill River | Con | Con | 10,509 | 47.93% | 794 | 3.62% | 50.35% | 10,509 | 9,715 | 1,144 | – | 560 | – | – | 21,928 | ||
| SK | Palliser | Con | Con | 15,850 | 47.00% | 766 | 2.27% | 67.40% | 15,850 | 15,084 | 1,797 | – | 995 | – | – | 33,726 | ||
| SK | Prince Albert | Con | Con | 19,214 | 62.17% | 9,373 | 30.33% | 60.00% | 19,214 | 9,841 | 1,070 | – | 666 | – | 116 | 30,907 | ||
| SK | Regina—Lumsden—Lake Centre | Con | Con | 18,076 | 53.21% | 5,558 | 16.36% | 66.29% | 18,076 | 12,518 | 2,467 | – | 911 | – | – | 33,972 | ||
| SK | Regina—Qu'Appelle | Con | Con | 15,896 | 53.48% | 4,477 | 15.06% | 60.38% | 15,896 | 11,419 | 1,400 | – | 879 | 127 | – | 29,721 | ||
| SK | Saskatoon—Humboldt | Con | Con | 19,954 | 52.72% | 6,683 | 17.66% | 66.52% | 19,954 | 13,271 | 3,013 | – | 926 | 682 | – | 37,846 | ||
| SK | Saskatoon—Rosetown—Biggar | Con | Con | 14,652 | 48.70% | 538 | 1.79% | 60.50% | 14,652 | 14,114 | 697 | – | 626 | – | – | 30,089 | ||
| SK | Saskatoon—Wanuskewin | Con | Con | 21,183 | 58.43% | 9,788 | 27.00% | 63.12% | 21,183 | 11,395 | 2,428 | – | 1,250 | – | – | 36,256 | ||
| SK | Souris—Moose Mountain | Con | Con | 21,598 | 73.98% | 16,137 | 55.28% | 62.20% | 21,598 | 5,461 | 1,236 | – | 898 | – | – | 29,193 | ||
| SK | Wascana | Lib | Lib | 15,823 | 40.83% | 1,532 | 3.95% | 67.21% | 14,291 | 7,681 | 15,823 | – | 954 | – | – | 38,749 | ||
| SK | Yorkton—Melville | Con | Con | 21,906 | 68.93% | 14,975 | 47.12% | 62.74% | 21,906 | 6,931 | 2,167 | – | 774 | – | – | 31,778 | ||
| Terr | Nunavut | Con | Con | 3,930 | 49.90% | 1,670 | 21.21% | 45.71% | 3,930 | 1,525 | 2,260 | – | 160 | – | – | 7,875 | ||
| Terr | Western Arctic | NDP | NDP | 7,140 | 45.84% | 2,139 | 13.73% | 53.95% | 5,001 | 7,140 | 2,872 | – | 477 | – | 87 | 15,577 | ||
| Terr | Yukon | Lib | Con | 5,422 | 33.77% | 132 | 0.82% | 66.24% | 5,422 | 2,308 | 5,290 | – | 3,037 | – | – | 16,057 | ||
- "Forty-First General Election 2011: Official Voting Results (raw data)". elections.ca. Retrieved July 6, 2023.
- including spoilt ballots
- minor political parties receiving less than 1% of the national popular vote are aggregated under "Other"; independent candidates are aggregated separately
- valid ballots
- = results as certified in a judicial recount
- = open seat
- = turnout is above national average
- = incumbency arose from byelection gain
- = incumbent switched allegiance after 2008 election
- = other incumbents defeated
Party summaries
Conservatives
The Conservatives, who had been leading in the polls since the writs were dropped, won 166 seats - enough for the first Conservative majority government since the Progressive Conservative-Canadian Alliance merger that formed the party in 2003. Notably, the Tories made significant inroads in Toronto, taking eight seats there. While the Tories had won a few seats in the Toronto suburbs since the PC-Canadian Alliance merger, this was the first time a right-of-centre party had won seats in the former Metro Toronto itself since the PC meltdown of 1993. Combined with their traditionally heavy support in the west, this was enough to win a 14-seat majority with 39.62 percent of the national popular vote - a result also notable for being the first time the modern Conservative party successfully polled a larger share of the vote than the combined tally of the PC and CA parties in the election preceding their merger.
Despite winning a majority government, the Conservatives lost over half their seats in Quebec to the NDP, retaining only five seats in that province.
New Democrats
The NDP had a major windfall, emerging as a truly national party for the first time in its 50-year history. They won 103 seats—more than double their previous high (when they won 43 seats in 1988). Much of this was due to a breakthrough in Quebec, a province where they had been more or less nonexistent for the better part of their history. From only one seat at dissolution, the NDP took 59 of 75 seats there, dominating Montreal and sweeping Quebec City and the Outaouais. By comparison, the NDP had only won one other seat in Quebec in its entire history prior to 2011 (and had held only one other seat, via a floor-crossing). It had not even been fully organized in the province since 1990, when its Quebec wing seceded to preach sovereigntism. The 59 seats won by the NDP in Quebec is the most won by any party in that province since the Progressive Conservatives won 63 seats there in 1988. In several cases, NDP candidates in Quebec won handily even though they didn't even actively campaign.
Among the new NDP MPs were several university students. Five members of the McGill University NDP club—Charmaine Borg, Matthew Dubé, Mylène Freeman, Laurin Liu, and Jamie Nicholls—were elected from Montreal-area ridings. Liu is the youngest woman ever elected to Parliament. Also elected was Pierre-Luc Dusseault, a freshman at the Université de Sherbrooke; his victory in Sherbrooke, Quebec makes him the youngest MP in Canadian history (he only turned 20 two days before he was sworn in).
However, they were unable to make much of an impact in their former western heartland. They actually lost Elmwood—Transcona, the former seat of longtime MP and former deputy leader Bill Blaikie, by only 300 votes.
Liberals
Winning only 34 seats, the Liberals suffered the worst result in their history. They sat as the third party in the 41st Parliament, the first since Confederation where the Liberals did not form either the Government or the Official Opposition in the House of Commons. This was the worst showing for an incumbent Official Opposition party in terms of seats, and the lowest percentage for a national Official Opposition party (the Bloc Québécois in 1997 won more seats with a smaller vote share on account of its being a regional party).
The Liberals' poor showing was largely due to a collapse of their support in Montreal and Toronto, which had been the backbones of Liberal support for almost two decades. With few exceptions, their support in Toronto flowed to the Tories, while most of their base in Montreal switched to the NDP.
In 2008, they won 20 out of the 23 ridings fully or partially within Toronto. However, in 2011, they only won six, losing 6 to the NDP and 9 to the Conservatives. Additionally, after going into the election holding 30 of the 44 seats in the Greater Toronto Area, they only won seven in 2011.
In Montreal, the Liberals lost five of their 12 seats, and came close to losing several more. Most notably, they came within 2,500 votes of losing Mount Royal, long reckoned as the safest Liberal riding in the nation.
Liberal leader Michael Ignatieff lost his seat of Etobicoke—Lakeshore to first time challenger Bernard Trottier by a margin of 5.27% of the total votes. Other famous MP's who also lost their seats are Ken Dryden (York Centre), Dan McTeague (Pickering—Scarborough East), Gerard Kennedy (Parkdale—High Park), Ujjal Dosanjh (Vancouver South) and Joe Volpe (Eglinton—Lawrence).
All told, the Liberals only won 11 seats in Ontario (all but four in Toronto) and seven in Quebec (all in Montreal)—the fewest the party has ever won in either province. They went into the next Parliament holding only four seats west of Ontario (Winnipeg North, Wascana, Vancouver Centre and Vancouver Quadra).
Bloc Québécois
The Bloc was practically eliminated from the scene, losing 43 seats. This reduced them to a rump of four seats, only a third of the number required for official party status. In many cases, they lost seats they held since their debut performance in 1993. With few exceptions, their support bled over to the NDP. Notably, the Bloc lost all but one seat in the Montreal area. This included all of their seats in the eastern part of the city, the birthplace of the sovereigntist movement. The Bloc went into the election holding all but one seat in eastern Montreal, but lost all of them to the NDP. They also lost all or most of their seats in their longstanding strongholds in the rest of the province, such as Quebec City and central Quebec. Several Bloc MPs who had never had serious difficulty being reelected ended up losing their seats in landslides. Bloc leader Gilles Duceppe, at the time the longest-tenured party leader in Canada, lost his seat in Laurier—Sainte-Marie to NDP challenger Hélène Laverdière.
Greens
Despite losing a significant share of the national vote compared to the 2008 election, Green Party leader Elizabeth May became the first Green Party member elected to the Canadian Parliament.
Vote and seat summaries
Gains, holds and losses
| Party | 2008 | Gain from (loss to) | 2011 | |||||||||
|---|---|---|---|---|---|---|---|---|---|---|---|---|
| Con | NDP | Lib | BQ | Grn | Ind | |||||||
| Conservative | 143 | 2 | (6) | 27 | (1) | 1 | 166 | |||||
| New Democratic | 37 | 6 | (2) | 17 | (1) | 45 | 1 | 103 | ||||
| Liberal | 77 | (27) | 1 | (17) | 34 | |||||||
| Bloc Québécois | 49 | (45) | 4 | |||||||||
| Green | – | 1 | 1 | |||||||||
| Independent | 2 | (1) | (1) | – | ||||||||
| Total | 308 | 7 | (30) | 3 | (69) | 44 | (1) | 45 | (1) | 2 | 308 | |
Incumbents defeated
Liberal Party leader Michael Ignatieff lost his riding of Etobicoke—Lakeshore to Bernard Trottier, a Conservative,[10] and the following day he announced he would resign as Liberal leader. Gilles Duceppe, leader of the Bloc Québécois and incumbent in Laurier—Sainte-Marie was defeated by Hélène Laverdière of the NDP and announced his intention to resign as leader of the Bloc.[11]
Four Cabinet ministers, Lawrence Cannon (Foreign Affairs), Gary Lunn (Sport), Jean-Pierre Blackburn (Veterans Affairs and Agriculture), and Josée Verner (Intergovernmental Affairs and Francophonie) lost their seats. Lunn lost to Green Party leader Elizabeth May, and the NDP won the other three seats.[12]
Open seats
The Bloc gained Haute-Gaspésie—La Mitis—Matane—Matapédia by the largest margin of victory of their four seats won and vacated by a long-standing member of the Bloc Québécois.
The Conservatives gained Calgary Centre-North and Prince George—Peace River, both vacated by long-standing Conservatives.
Seats that changed hands through vacancies at dissolution or retirements
| ||||||||||||||||||||||||||||||||||||||||||||||||||||||||||||||||||||||||||||||||||||||||||||||||||||||||||||||||||||||||||||||||||||||||||||||||||||||||||||||||||||||||||||||||||||||||||||||||||||||||||||||||||||||||||||||||
Results by province
| Party name | BC | AB | SK | MB | ON | QC | NB | NS | PE | NL | YT | NT | NU | Total | ||
|---|---|---|---|---|---|---|---|---|---|---|---|---|---|---|---|---|
| Conservative | Seats: | 21 | 27 | 13 | 11 | 73 | 5 | 8 | 4 | 1 | 1 | 1 | 0 | 1 | 166 | |
| Vote: | 45.5 | 66.8 | 56.3 | 53.5 | 44.4 | 16.5 | 43.9 | 36.7 | 41.2 | 28.4 | 33.8 | 32.1 | 49.9 | 39.6 | ||
| New Democrats | Seats: | 12 | 1 | 0 | 2 | 22 | 59 | 1 | 3 | 0 | 2 | 0 | 1 | 0 | 103 | |
| Vote: | 32.5 | 16.8 | 32.3 | 25.8 | 25.6 | 42.9 | 29.8 | 30.3 | 15.4 | 32.6 | 14.4 | 45.8 | 19.4 | 30.6 | ||
| Liberal | Seats: | 2 | 0 | 1 | 1 | 11 | 7 | 1 | 4 | 3 | 4 | 0 | 0 | 0 | 34 | |
| Vote: | 13.4 | 9.3 | 8.6 | 16.6 | 25.3 | 14.2 | 22.6 | 28.9 | 41.0 | 37.9 | 33.0 | 18.4 | 28.7 | 18.9 | ||
| Bloc Québécois | Seats: | 4 | 4 | |||||||||||||
| Vote: | 23.4 | 6.0 | ||||||||||||||
| Green | Seats: | 1 | 0 | 0 | 0 | 0 | 0 | 0 | 0 | 0 | 0 | 0 | 0 | 0 | 1 | |
| Vote: | 7.7 | 5.3 | 2.7 | 3.6 | 3.8 | 2.1 | 3.2 | 4.0 | 2.4 | 0.9 | 18.9 | 3.1 | 2.0 | 3.9 | ||
| Independent and no affiliation | Vote: | 0.2 | 1.3 | 0.2 | 0.1 | 0.2 | 0.6 | 0.5 | 0.3 | 0.4 | ||||||
| Total seats | 36 | 28 | 14 | 14 | 106 | 75 | 10 | 11 | 4 | 7 | 1 | 1 | 1 | 308 | ||
British Columbia
| Results in British Columbia | ||||||||||
|---|---|---|---|---|---|---|---|---|---|---|
| Party | Seats | Second | Third | Fourth | Fifth | Sixth | Votes | % | +/- | |
| Conservative | 21 | 13 | 2 | -1 | ||||||
| New Democrats | 12 | 19 | 5 | +3 | ||||||
| Liberal | 2 | 4 | 23 | 7 | -3 | |||||
| Green | 1 | 6 | 29 | +1 | ||||||
| Christian Heritage | 3 | 3 | ||||||||
| Independent and no Affiliation |
9 | 2 | ||||||||
| Libertarian | 6 | 2 | ||||||||
| Marxist–Leninist | 5 | 3 | ||||||||
| Communist | 3 | |||||||||
| Canadian Action | 2 | |||||||||
| Progressive Canadian | 1 | 1 | ||||||||
| Western Block | 1 | |||||||||
| Pirate | 3 | |||||||||
| Rhinoceros | ||||||||||
| Total | 36 | 100.0 | ||||||||
Alberta
| Results in Alberta | |||||||||||
|---|---|---|---|---|---|---|---|---|---|---|---|
| Party | Seats | Second | Third | Fourth | Fifth | Sixth | Votes | % | +/- | ||
| Conservative | 27 | 1 | 932,765 | 66.8 | +2.2 | ||||||
| New Democrats | 1 | 23 | 4 | 234,730 | 16.8 | +4.1 | |||||
| Liberal | 0 | 3 | 15 | 10 | 129,310 | 9.3 | -2.1 | ||||
| Green | 0 | 0 | 9 | 18 | 1 | 73,058 | 5.2 | -3.6 | |||
| Independent | 0 | 1 | 5 | 17,906 | 1.3 | -0.7 | |||||
| Christian Heritage | 0 | 0 | 5 | 2 | 3,401 | 0.2 | -0.1 | ||||
| Canadian Action | 0 | 0 | 1 | 384 | 0.0 | -0.1 | |||||
| Marxist–Leninist | 0 | 0 | 3 | 2 | 808 | 0.1 | 0 | ||||
| Communist | 0 | 0 | 1 | 1 | 346 | 0.0 | 0 | ||||
| Pirate | 0 | 0 | 2 | 663 | 0.0 | 0 | |||||
| Western Block | 0 | 0 | 2 | 415 | 0.0 | 0 | |||||
| Rhinoceros | 0 | 0 | 1 | 345 | 0.0 | 0 | |||||
| Progressive Canadian | 0 | 0 | 1 | 1,754 | 0.1 | +0.1 | |||||
| Total | 28 | 1,395,885 | 100.0 | ||||||||
Saskatchewan
| Results in Saskatchewan | |||||||||||
|---|---|---|---|---|---|---|---|---|---|---|---|
| Party | Seats | Second | Third | Fourth | Fifth | Votes | % | +/- | |||
| Conservative | 13 | 1 | 0 | 0 | 0 | - | |||||
| Liberal | 1 | 0 | 13 | 0 | 0 | - | |||||
| New Democrats | 0 | 13 | 1 | 0 | 0 | ||||||
| Green | 0 | 0 | 0 | 14 | 0 | ||||||
| Canadian Action | 0 | 0 | 0 | 0 | 1 | ||||||
| Independent | 0 | 0 | 0 | 0 | 2 | ||||||
| Total | 14 | 100.0 | |||||||||
Manitoba
| Results in Manitoba | ||||||||||||
|---|---|---|---|---|---|---|---|---|---|---|---|---|
| Party | Seats | Second | Third | Fourth | Fifth | Sixth | Votes | % | +/- | |||
| Conservative | 11 | 2 | 1 | 0 | 0 | 0 | +2 | |||||
| New Democrats | 2 | 9 | 3 | 0 | 0 | 0 | -2 | |||||
| Liberal | 1 | 3 | 9 | 1 | 0 | 0 | - | |||||
| Green | 0 | 0 | 1 | 13 | 0 | 0 | ||||||
| Christian Heritage | 0 | 0 | 0 | 0 | 2 | 0 | ||||||
| Independent | 0 | 0 | 0 | 0 | 2 | 2 | ||||||
| Communist | 0 | 0 | 0 | 0 | 2 | 0 | ||||||
| Pirate | 0 | 0 | 0 | 0 | 0 | 1 | ||||||
| Total | 14 | 100.0 | ||||||||||
Ontario
| Results in Ontario | ||||||||||
|---|---|---|---|---|---|---|---|---|---|---|
| Party | Seats | Second | Third | Fourth | Fifth | Sixth | Votes | % | +/- | |
| Conservative | 73 | 24 | 9 | 0 | 0 | 0 | +22 | |||
| New Democrats | 22 | 34 | 50 | 0 | 0 | 0 | +5 | |||
| Liberal | 11 | 46 | 46 | 3 | 0 | 0 | -27 | |||
| Green | 0 | 1 | 0 | 100 | 2 | 0 | ||||
| Independent and no Affiliation |
0 | 1 | 1 | |||||||
| Christian Heritage | 0 | 0 | 0 | 0 | 21 | 2 | ||||
| Progressive Canadian | 0 | 0 | 0 | 0 | 6 | 2 | ||||
| Marxist–Leninist | 0 | 0 | 0 | 0 | 17 | 6 | ||||
| Libertarian | 0 | 0 | 0 | 1 | 11 | 2 | ||||
| Communist | 0 | 0 | 0 | 0 | 3 | 3 | ||||
| Marijuana | 1 | |||||||||
| Canadian Action | ||||||||||
| First Peoples National | 0 | 0 | 0 | 0 | 1 | 0 | ||||
| Animal Alliance | 0 | 0 | 0 | 0 | 3 | 2 | ||||
| Pirate | 0 | 0 | 0 | 0 | 1 | 1 | ||||
| United | 0 | 0 | 0 | 0 | 2 | 1 | ||||
| Total | 106 | 100.0 | ||||||||
Quebec
| Results in Quebec | ||||||||||
|---|---|---|---|---|---|---|---|---|---|---|
| Party | Seats | Second | Third | Fourth | Fifth | Sixth | Votes | % | +/- | |
| New Democrats | 59 | 14 | 2 | 0 | 0 | 0 | +58 | |||
| Liberal | 7 | 10 | 23 | 35 | 0 | 0 | -7 | |||
| Conservative | 5 | 8 | 32 | 28 | 1 | 0 | -5 | |||
| Bloc Québécois | 4 | 42 | 17 | 11 | 1 | 0 | -45 | |||
| Green | 0 | 0 | 0 | 1 | 73 | 1 | ||||
| Independent and no affiliation |
0 | 1 | 1 | 0 | 0 | 4 | ||||
| Marxist–Leninist | 0 | 0 | 0 | 0 | 0 | 14 | ||||
| Rhinoceros | 0 | 0 | 0 | 0 | 0 | 10 | ||||
| Christian Heritage | 0 | 0 | 0 | 0 | 0 | 5 | ||||
| Communist | 0 | 0 | 0 | 0 | 0 | 0 | ||||
| Pirate | 0 | 0 | 0 | 0 | 0 | 1 | 369 | |||
| Canadian Action | 0 | 0 | 0 | 0 | 0 | 1 | 250 | |||
| Total | 75 | 100.0 | ||||||||
New Brunswick
| Results in New Brunswick | |||||||||
|---|---|---|---|---|---|---|---|---|---|
| Party | Seats | Second | Third | Fourth | Fifth | Votes | % | +/- | |
| Conservative | 8 | 2 | 0 | 0 | 0 | +2 | |||
| Liberal | 1 | 2 | 7 | 0 | 0 | -2 | |||
| New Democrats | 1 | 6 | 3 | 0 | 0 | - | |||
| Green | 0 | 0 | 0 | 8 | 1 | ||||
| Marxist–Leninist | |||||||||
| Christian Heritage | 0 | 0 | 0 | 0 | 1 | ||||
| Total | 10 | 100.0 | |||||||
Nova Scotia
| Results in Nova Scotia | |||||||||
|---|---|---|---|---|---|---|---|---|---|
| Party | Seats | Second | Third | Fourth | Fifth | Votes | % | +/- | |
| Conservative | 4 | 5 | 2 | 0 | 0 | +1 | |||
| Liberal | 4 | 3 | 4 | 0 | 0 | -1 | |||
| New Democrats | 3 | 3 | 5 | 0 | 0 | +1 | |||
| Green | 0 | 0 | 0 | 11 | 0 | ||||
| Christian Heritage | 0 | 0 | 0 | 0 | 1 | ||||
| Marxist–Leninist | 0 | 0 | 0 | 0 | 1 | ||||
| Total | 11 | 100.0 | |||||||
Prince Edward Island
| Results in Prince Edward Island | |||||||||
|---|---|---|---|---|---|---|---|---|---|
| Party | Seats | Second | Third | Fourth | Votes | % | +/- | ||
| Liberal | 3 | 1 | 0 | 0 | - | ||||
| Conservative | 1 | 3 | 0 | 0 | - | ||||
| New Democrats | 0 | 0 | 4 | 0 | - | ||||
| Green | 0 | 0 | 0 | 4 | |||||
| Christian Heritage | 0 | 0 | 0 | 0 | |||||
| Total | 4 | 100.0 | |||||||
Newfoundland and Labrador
| Results in Newfoundland and Labrador (Preliminary) | ||||||||||
|---|---|---|---|---|---|---|---|---|---|---|
| Party | Seats | Second | Third | Fourth | Votes | % | +/- | |||
| Liberal | 4 | 2 | 1 | 0 | -2 | |||||
| New Democrats | 2 | 0 | 5 | 0 | +1 | |||||
| Conservative | 1 | 5 | 1 | 0 | +1 | |||||
| Green | 0 | 0 | 0 | 5 | ||||||
| Independent | 0 | 0 | 0 | 2 | ||||||
| Total | 7 | 100.0 | ||||||||
Results by territory
| Results in the Yukon | |||||||
|---|---|---|---|---|---|---|---|
| Party | Seats | Second | Third | Votes | % | +/- | |
| Conservative | 1 | 5,422 | 33.8 | +1.1 | |||
| Liberal | 1 | 5,290 | 32.9 | -12.9 | |||
| Green | 1 | 3,037 | 18.9 | +6.1 | |||
| New Democrats | 2,308 | 14.4 | +5.7 | ||||
| Total | 1 | 16,057 | 100.0 | ||||
| Results in the Northwest Territories | ||||||||
|---|---|---|---|---|---|---|---|---|
| Party | Seats | Second | Third | Fourth | Votes | % | +/- | |
| New Democrats | 1 | 7,140 | 45.8 | +4.3 | ||||
| Conservative | 1 | 5,001 | 32.1 | -5.5 | ||||
| Liberal | 1 | 2,872 | 18.4 | +4.8 | ||||
| Green | 1 | 477 | 3.1 | -2.4 | ||||
| Animal Alliance | 87 | 0.6 | +0.6 | |||||
| Total | 1 | 15,577 | 100.0 | |||||
| Results in Nunavut | |||||||
|---|---|---|---|---|---|---|---|
| Party | Seats | Second | Third | Votes | % | +/- | |
| Conservative | 1 | 3,930 | 49.9 | +15.0 | |||
| Liberal | 1 | 2,260 | 28.7 | -0.4 | |||
| New Democrats | 1 | 1,525 | 19.4 | -8.2 | |||
| Green | 160 | 2.0 | -6.3 | ||||
| Total | 1 | 7,875 | 100.0 | ||||
References
- "PM returns to Ottawa after majority win". Canadian Broadcasting Corporation. May 3, 2011. Retrieved May 3, 2011.
- Maher, Stephen (May 3, 2011). "Harper delivers Conservatives' first majority since 1988". Halifax Chronicle-Herald. Archived from the original on May 6, 2011. Retrieved May 3, 2011.
- Cheadle, Bruce (May 3, 2011). "Harper finally wins Conservative majority, NDP makes huge gain". 660news.com. Archived from the original on September 28, 2011. Retrieved May 3, 2011.
- Clark, Campbell (May 3, 2011). "Layton gears up for new gig as prime minister in waiting". Globe and Mail. Toronto. Retrieved May 3, 2011.
- Young, Leslie (May 3, 2011). "NDP wins record number of seats". Global TV Toronto. Archived from the original on July 23, 2011. Retrieved May 3, 2011.
- Taber, Jane (May 3, 2011). "Ignatieff resigns after Liberal defeat". Globe and Mail. Toronto. Retrieved May 3, 2011.
- De Souza, Mike (May 3, 2011). "Liberal insiders say party must take long look in mirror". Canada.com. Retrieved May 3, 2011.
- Hartnett, Cindy (May 3, 2011). "May breaks through as first Green MP". Montreal Gazette. Retrieved May 3, 2011.
- Leblanc, Daniel (May 2, 2011). "Duceppe resigns as Bloc leader after losing riding". Globe and Mail. Toronto. Retrieved May 3, 2011.
- "Ignatieff's Liberals lose Official Opposition stats". CBC News. May 2, 2011. Retrieved May 3, 2011.
- "Duceppe quits after BQ crushed in Quebec". CBC News. May 2, 2011. Retrieved May 3, 2011.
- "Major players fall like bowling pins before Tory, NDP surges". Canadian Press. May 3, 2011. Retrieved May 3, 2011.