A comprehensive guide to plotting a function in MATLAB
X
wikiHow is a “wiki,” similar to Wikipedia, which means that many of our articles are co-written by multiple authors. To create this article, 13 people, some anonymous, worked to edit and improve it over time.
This article has been viewed 56,424 times.
Learn more...
This article is meant to inform new MATLAB users how to plot an anonymous function. This method requires little experience in programming, so dive in with step one to get started.
Steps
-
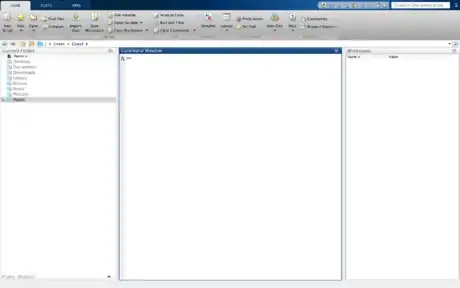
1Open MATLAB on your computer.
-
2Know what function you want to graph. Anonymous functions are not stored to any program file. They can accept multiple inputs and return outputs. You must know what function you want to graph because you need to let MATLAB know what independent variables your function has before you write the function. Some examples of anonymous functions include:
- Trigonometric functions
- Rational functions
- Polynomials
- Logarithmic functions
Advertisement -
3Know what interval you want your function to be graphed on. You will want to know what interval you want your function to be graphed on because it is entered before you graph the function. It is a good idea to know your interval before you begin typing. Intervals always have lower and upper bounds. Entering the interval will be explained later.
-
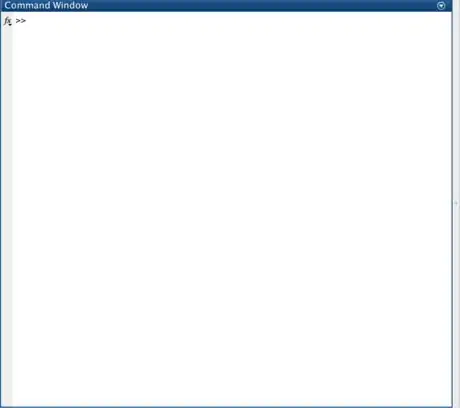
4Click inside the command window. This is where you will place individual statements. Inside the command window you can assign values to variables, assign functions to variables, plot functions etc.
-
5Name the function. The first thing you will begin to type is the name of the function. Typical names for functions are “f” and “g”. However, you can name the function anything that you want. The name of the function must start with a letter. It should not contain any special characters. It may contain numbers as long as the first character is a letter.
-
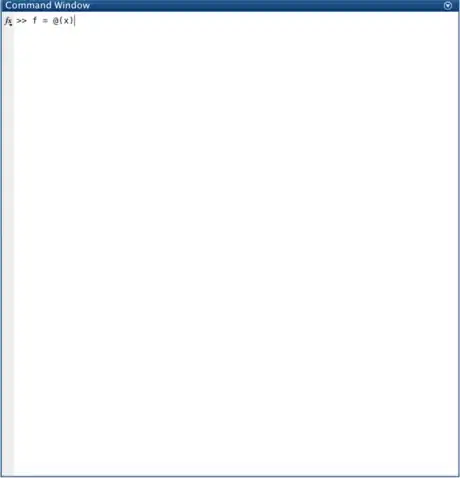
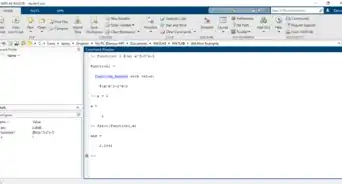
6Set up independent variables. Directly after the function you will set up the independent variables. You do this by putting an equal sign “=” after the function name. Then put a space and an “@”. Immediately after the “@” you will put an open parenthesis “(“. Now you can start listing all the of the independent variables. If your independent variable is “x”, it should look like this: “@(x)”. If you wish to have more independent variables, then you put a comma after each variable. For example, @(x,y).
-
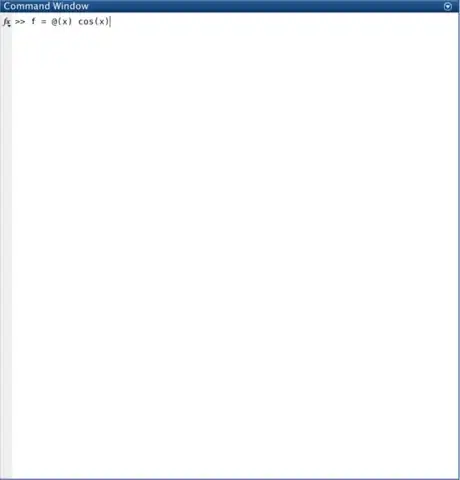
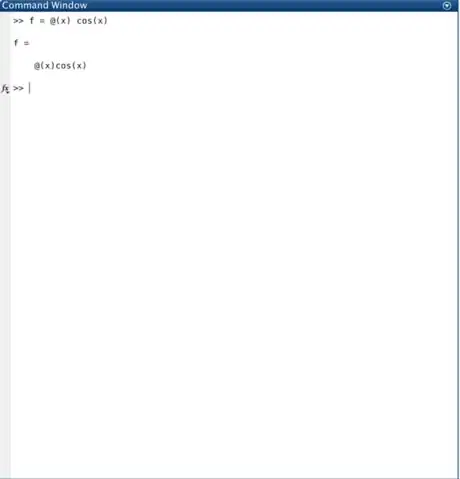
7Type your function. After you set up the independent variables you can type the function. It is a good idea to put a space in between them so your code looks neat. Here are some basic tips to help type functions in MATLAB.
- Cosine- cos(x)
- Sine-sin(x)
- Tangent-tan(x)
- Cosine(in degrees)-cosd(x)
- Sine(in degrees)-sind(x)
- Tangent(in degrees)-tand(x)
- Multiplication- “2*x”
- Division- “2/x”
- Addition- “2+x”
- Subtraction- “2-x
- Exponent- x^2
- e- exp(x)
- Example of how to type a polynomial - "2*x^2+3*x+7"
-
8Press ↵ Enter. This saves the function to the variable. After you press enter, the function should come up on the next line. If you get an error, then you may have typed something in wrong.
-
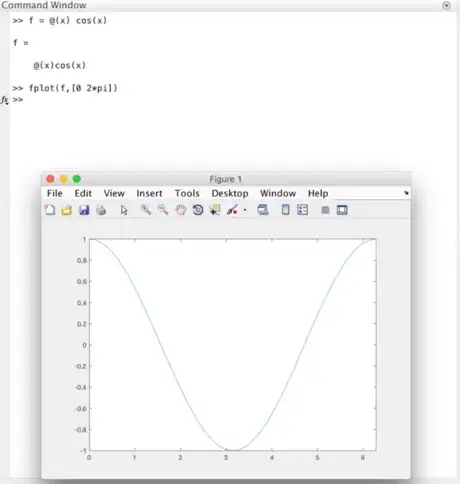
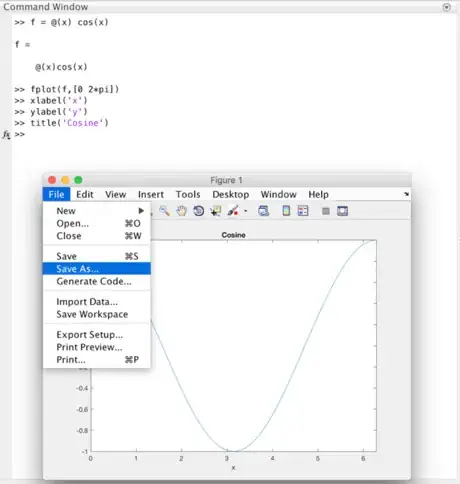
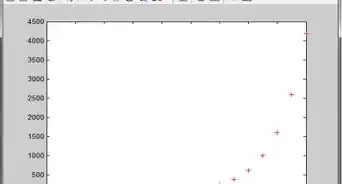
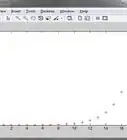
9Plot the function. On the next line you will write a statement to plot the function. To plot an anonymous function, you must use “fplot” even if your function is not named "f". The proper syntax for fplot is: fplot(name of function, interval). So you will basically type in the name of the function first and then type in the interval. The interval is written [lower bound upper bound]. For example: fplot(f,[0 2*pi]). If you do not know the interval, then you can just put “fplot(f)”. MATLAB will pick the interval. After you type this, then you will press enter again.
-
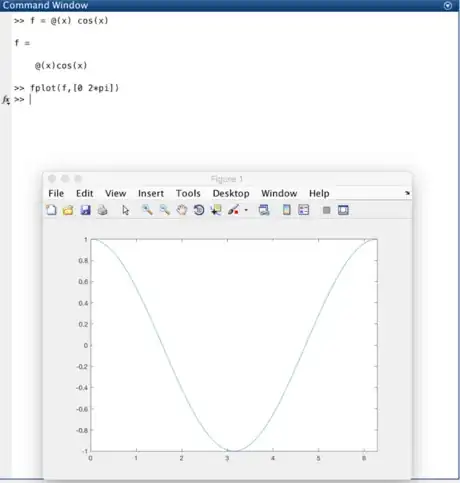
10Click back in the command window. Make sure you click back in the command window. Do not exit out of the graph. If you exit out of the graph, then you will not be able to add to the graph.
-
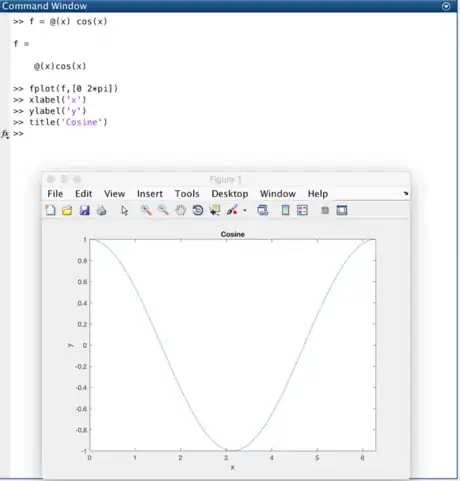
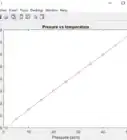
11Add label axes and title. After each time you label an axes or the title, you will hit ↵ Enter. Each time, the graph window will change. Make sure your cursor is still in the command window. Here is how you give a name to each:
- x-axis: xlabel('name')
- y-axis: ylabel('name')
- title:title('name').
-
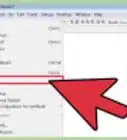
12Save the graph. If you want to save the graph, click file on the graph window. Then press "save as" and choose where you want to save it.
Advertisement
Things You'll Need
- Computer
- MATLAB
About This Article
Advertisement
