Demographics of Florida
| Census | Pop. | Note | %± |
|---|---|---|---|
| 1830 | 34,730 | — | |
| 1840 | 54,477 | 56.9% | |
| 1850 | 87,445 | 60.5% | |
| 1860 | 140,424 | 60.6% | |
| 1870 | 187,748 | 33.7% | |
| 1880 | 269,493 | 43.5% | |
| 1890 | 391,422 | 45.2% | |
| 1900 | 528,542 | 35.0% | |
| 1910 | 752,619 | 42.4% | |
| 1920 | 968,470 | 28.7% | |
| 1930 | 1,468,211 | 51.6% | |
| 1940 | 1,897,414 | 29.2% | |
| 1950 | 2,771,305 | 46.1% | |
| 1960 | 4,951,560 | 78.7% | |
| 1970 | 6,791,418 | 37.2% | |
| 1980 | 9,746,324 | 43.5% | |
| 1990 | 12,937,926 | 32.7% | |
| 2000 | 15,982,378 | 23.5% | |
| 2010 | 18,801,310 | 17.6% | |
| 2020 | 21,538,187 | 14.6% | |
| 2022 (est.) | 22,244,823 | 3.3% | |
| U.S. Decennial Census 1830–1970[1] 1980[2] 1990[3] 2000[4] 2010[5] 2020[6] 2022[7] | |||
| Historical racial composition | 2020[6] | 2010[5] | 2000[4] | 1990[3] | 1980[2] |
|---|---|---|---|---|---|
| White (non-Hispanic) | 51.5% | 57.9% | 65.4% | 73.2% | 76.7% |
| Hispanic or Latino | 26.5% | 22.5% | 16.8% | 12.2% | 8.8% |
| Black or African American (non-Hispanic) | 14.5% | 15.2% | 14.2% | 13.1% | 13.5% |
| Asian and Pacific Islander (non-Hispanic) | 3.0% | 2.4% | 1.7% | 1.1% | 1.0% |
| Native American (non-Hispanic) | 0.2% | 0.3% | 0.3% | 0.3% | |
| Other Race (non-Hispanic) | 0.6% | 0.3% | 0.2% | 0.1% | |
| Two or more races (non-Hispanic) | 3.7% | 1.6% | 1.5% | N/A | N/A |
| Population | 21,538,187 | 18,801,310 | 15,982,378 | 12,937,926 | 9,746,324 |
Florida is the third-most populous state in the United States. Its residents include people from a wide variety of ethnic, racial, national and religious backgrounds. The state has attracted immigrants, particularly from Latin America.[8] Florida's majority ethnic group are European Americans, with approximately 65% of the population identifying as White. National ethnic communities in the state include Cubans, who migrated en masse following the revolution in the mid 20th century. They have been joined by other immigrants from Latin America, and Spanish is spoken by more than 20% of the state's population, with high usage especially in the Miami-Dade County area.
Population
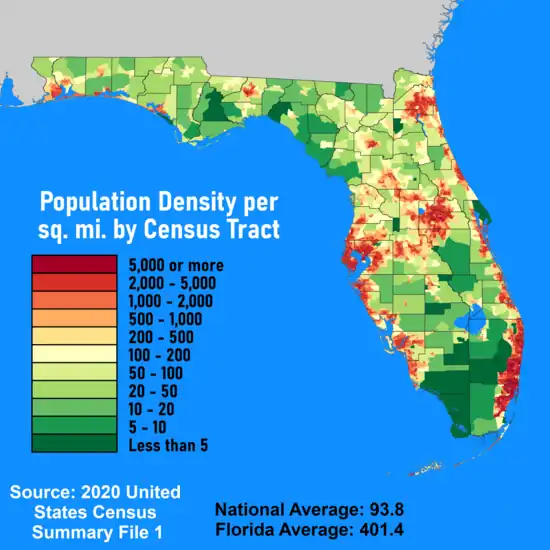
With a population of 21.5 million according to the 2020 census, Florida is the most populous state in the Southeastern United States, and the second-most populous state in the South behind Texas. Within the United States, it contains the highest percentage of people over 65 (17.3%), and the 8th fewest people under 18 (21.9%).[9]

Net domestic migration
| Year[10] | In-migrants | Out-migrants | Net migration |
|---|---|---|---|
| 2010 | 482,889 | 427,853 | 55,036 |
| 2011 | 498,597 | 437,202 | 61,395 |
| 2012 | 537,148 | 428,325 | 108,823 |
| 2013 | 529,406 | 423,995 | 105,411 |
| 2014 | 546,501 | 437,516 | 108,985 |
| 2015 | 584,938 | 445,320 | 139,618 |
| 2016 | 605,018 | 433,452 | 171,566 |
| 2017 | 566,476 | 447,586 | 118,890 |
| 2018 | 587,261 | 470,977 | 116,284 |
Race/ethnicity
2020 census
According to the 2020 census, the racial distributions are as follows; 51.5% Non-Hispanic White, 26.6% of the population are Hispanics or Latino (of any race), 14.5% African American, 4% Native American, and 2.3% Asian, Oriental and other.
.svg.png.webp)
|
Non-Hispanic White
30–40%
40–50%
50–60%
60–70%
70–80%
80–90% |
Hispanic or Latino
50–60%
60–70% |
Black or African American
50–60%
|
2010 census
According to the 2010 census, the racial distributions are as follows; 53.5% Non-Hispanic White, 25.6% of the population are Hispanic Americans or Latino (of any race), 15.2% African American (includes Afro-Caribbeans), 4.5% Native American, 2.0% Asian and others Florida has one of the largest African-American populations in the country, and has the second-highest Latino population on the East Coast outside of New York state. Its ethnic Asian population has grown rapidly since the late 1990s; the majority are Filipinos (163,000), Indians (128,000), Vietnamese (90,000) , ethnic Chinese (81,000). The state has some federally recognized Native American tribes, such as the Seminoles in the southeastern part of the state.[11]
2021 American Community Survey
|
Racial Makeup of Florida (2021)[12] White alone (56.06%) Black alone (15.08%) Native American alone (0.29%) Asian alone (2.85%) Pacific Islander alone (0.06%) Some other race alone (6.54%) Two or more races (19.12%)
|
Racial/Ethnic Makeup of Florida excluding Hispanics from Racial Categories (2021)[12] White NH (51.14%) Black NH (14.63%) Native American NH (0.09%) Asian NH (2.78%) Pacific Islander NH (0.05%) Some other race NH (0.68%) Two or more races NH (3.85%) Hispanic Any Race (26.77%)
|
Racial Makeup of Hispanics in Florida (2021)[12] White alone (18.37%) Black alone (1.70%) Native American alone (0.74%) Asian alone (0.25%) Pacific Islander alone (0.03%) Some other race alone (21.86%) Two or more races (57.04%)
|
According to the 2021 US Census Bureau estimates, Florida's population was 56.1% White (51.1% Non-Hispanic White), 15.1% Black or African American, 2.9% Asian, 0.3% Native American and Alaskan Native, 0.1% Pacific Islander, 6.5% Some Other Race, and 19.1% from two or more races.[12] The White population continues to remain the largest racial category as a high percentage of Hispanics in Florida identify as White (18.4%) with others identifying as Some Other Race (21.9%), Multiracial (57.0%), Black (1.7%), American Indian and Alaskan Native (0.2%), Asian (0.1%), and Hawaiian and Pacific Islander (0.1%).[12] By ethnicity, 26.8% of the total population is Hispanic-Latino (of any race) and 73.2% is Non-Hispanic (of any race). If treated as a separate category, Hispanics are the largest minority group in Florida.[12]
Birth data
Note: Births in the table exceed 100% because some Hispanics are counted both by their ethnicity and by their race, giving a higher overall number.
| Race | 2013[13] | 2014[14] | 2015[15] | 2016[16] | 2017[17] | 2018[18] | 2019[19] | 2020[20] | 2021[21] |
|---|---|---|---|---|---|---|---|---|---|
| White: | 154,791 (71.8%) | 159,035 (72.3%) | 162,594 (72.5%) | 157,006 (69.8%) | 154,504 (69.1%) | 157,945 (71.3%) | 156,463 (71.1%) | 148,661 (70.9%) | |
| Non-hispanic White | 98,586 (45.7%) | 100,837 (45.8%) | 102,549 (45.7%) | 99,344 (44.1%) | 96,280 (43.1%) | 95,868 (43.2%) | 93,590 (42.5%) | 88,080 (42.0%) | 91,223 (42.2%) |
| Black | 52,959 (24.6%) | 53,148 (24.1%) | 53,699 (23.9%) | 48,928 (21.7%) | 49,428 (22.1%) | 48,174 (21.7%) | 47,730 (21.7%) | 45,585 (21.7%) | 45,710 (21.1%) |
| Asian | 7,265 (3.4%) | 7,402 (3.4%) | 7,603 (3.4%) | 7,178 (3.2%) | 7,015 (3.1%) | 6,996 (3.2%) | 7,069 (3.2%) | 6,539 (3.1%) | 6,506 (3.0%) |
| American Indian | 392 (0.2%) | 406 (0.2%) | 373 (0.2%) | 237 (0.1%) | 429 (0.2%) | 413 (0.2%) | 400 (0.2%) | 229 (0.1%) | 227 (0.1%) |
| Hispanic (of any race) | 59,206 (27.5%) | 61,849 (28.1%) | 64,078 (28.6%) | 65,895 (29.3%) | 67,049 (30.0%) | 67,201 (30.3%) | 68,234 (31.0%) | 66,156 (31.6%) | 69,375 (32.1%) |
| Total | 215,407 (100%) | 219,991 (100%) | 224,269 (100%) | 225,022 (100%) | 223,630 (100%) | 221,542 (100%) | 220,002 (100%) | 209,671 (100%) | 216,260 (100%) |
Languages
| Language | Percent of population (2010)[22] |
|---|---|
| English | 73.36% |
| Spanish | 19.54% |
| French Creole (including Haitian and Antillean Creoles) | 1.84% |
| French | 0.60% |
| Portuguese | 0.50% |
| German | 0.42% |
| Tagalog, Vietnamese, Italian (tied) | 0.31% |
| Arabic | 0.22% |
| Chinese | 0.20% |
| Russian | 0.18% |
| Polish | 0.14% |
As of 2010, 73.36% of Florida residents age 5 and older spoke English at home as a primary language, while 19.54% spoke Spanish, 1.84% French Creole (mostly Haitian Creole), 0.60% French and 0.50% Portuguese. In total, 26.64% of Florida's population age 5 and older spoke a mother language other than English.[22]
Florida's public education system identified more than 200 first languages other than English spoken in the homes of students.[23] In 1990, the League of United Latin American Citizens (LULAC) settled a class action lawsuit against the state Florida Department of Education with a consent decree that required educators to be trained in teaching English for Speakers of Other Languages (ESOL).[24]
Article II, Section 9, of the Florida Constitution provides that "English is the official language of the State of Florida." This provision was adopted in 1988 by a vote following an Initiative Petition.
A Miami accent has developed among persons born and/or raised in and around Miami-Dade County and a few other parts of South Florida.[25] It is more prominent among Hispanics (especially Cuban Americans and other Latino groups, influenced by the Spanish language).[26][27]
Religion
Florida residents identify as mostly of various Protestant groups. Roman Catholics make up the single largest denomination in the state. Florida residents' current religious affiliations are shown in the table below:[28]
- Christianity 70%
- Protestantism 46%
- Catholicism 21%
- Mormonism 1%
- Jehovah's Witness 1%
- Other Christian 1%
- Non-Christian Faiths 6%
- Unaffiliated 24%
Veterans
There were 1.6 million veterans in Florida in 2010, representing 8% of the total population.[29]
Migration
In 2013, most net migrants come from 1) New York, 2) New Jersey, 3) Pennsylvania, and 4) the Midwestern United States; emigration is higher from these same states. For example, about 50,000 moved to New York; but more than 50,000 people moved from New York to Florida.[30]
References
- "Census Counts: 1830-2020". Florida County Population Census Counts: 1830 to 2020. Office of Economic and Demographic Research, The Florida Legislature. 2023. Archived from the original on April 4, 2022. Retrieved June 11, 2023.
- "General Population Characteristics FLORIDA 1980 Census of Population" (PDF). 07553445v1chA-Cpt11sec1ch002.pdf. U.S. Census Bureau. Retrieved June 11, 2023.
- "1990 Census of Population General Population Characteristics Florida Section 1 of 2" (PDF). Florida: 1990, Part 1. U.S. Census Bureau. Retrieved June 11, 2023.
- "PL002: HISPANIC OR LATINO, AND NOT ... - Census Bureau Table". PL002 | HISPANIC OR LATINO, AND NOT HISPANIC OR LATINO BY RACE [73]. U.S. Census Bureau. Retrieved March 21, 2023.
- "P2: HISPANIC OR LATINO, AND NOT ... - Census Bureau Table". P2 | HISPANIC OR LATINO, AND NOT HISPANIC OR LATINO BY RACE. U.S. Census Bureau. Retrieved June 11, 2023.
- "P2: HISPANIC OR LATINO, AND NOT ... - Census Bureau Table". P2 | HISPANIC OR LATINO, AND NOT HISPANIC OR LATINO BY RACE. U.S. Census Bureau. Retrieved June 11, 2023.
- "County Population Totals and Components of Change: 2020-2022". County Population Totals: 2020-2022. U.S. Census Bureau. March 30, 2023. Retrieved June 11, 2023.
- "State Population Facts - Florida". npg.org. Archived from the original on March 30, 2008. Retrieved April 2, 2008.
- Michael B. Sauter; Douglas A. McIntyre (May 10, 2011). "The States With The Oldest And Youngest Residents". wallst.com.
- "State-to-State Migration Flows".
- "U.S. Census Bureau QuickFacts: Florida". Census Bureau QuickFacts. December 21, 2010. Retrieved August 11, 2019.
- "B03002 HISPANIC OR LATINO ORIGIN BY RACE - Florida - 2021 American Community Survey 1-Year Estimates". U.S. Census Bureau. July 1, 2021. Retrieved July 8, 2023.
- https://www.cdc.gov/nchs/data/nvsr/nvsr64/nvsr64_01.pdf
- https://www.cdc.gov/nchs/data/nvsr/nvsr64/nvsr64_12.pdf
- https://www.cdc.gov/nchs/data/nvsr/nvsr66/nvsr66_01.pdf
- https://www.cdc.gov/nchs/data/nvsr/nvsr67/nvsr67_01.pdf
- https://www.cdc.gov/nchs/data/nvsr/nvsr67/nvsr67_08-508.pdf
- "Data" (PDF). www.cdc.gov. Retrieved December 2, 2019.
- "Data" (PDF). www.cdc.gov. Retrieved March 27, 2021.
- "Natality, 2016-2020 expanded Results Data current as of 2020". Retrieved January 24, 2022.
- "Data" (PDF). www.cdc.gov. Retrieved February 2, 2022.
- "Florida". Modern Language Association. Archived from the original on December 1, 2007. Retrieved August 15, 2013.
- MacDonald, Victoria M. (April 2004). "The Status of English Language Learners in Florida: Trends and Prospects" (PDF). Education Policy Research Unit, Arizona State University. Archived from the original (PDF) on February 9, 2014. Retrieved May 24, 2013.
- "League of United Latin American Citizens (LULAC) et al. vs. State Board of Education et al. Consent Decree". United States District Court for the Southern District of Florida. August 14, 1990. Archived from the original on June 17, 2013. Retrieved May 24, 2013.
- "'Miami Accent' Takes Speakers By Surprise". Articles - Sun-Sentinel.com. June 13, 2004. Archived from the original on August 20, 2012. Retrieved September 2, 2013.
- "Miami Accents: Why Locals Embrace That Heavy "L" Or Not". WLRN-TV and WLRN-FM. August 27, 2013. Retrieved September 2, 2013.
- "Miami Accents: How 'Miamah' Turned Into A Different Sort Of Twang". WLRN-TV & WLRN-FM. August 26, 2013. Retrieved September 2, 2013.
- "Adults in Florida". Pew Research Center.
- "What each state's veteran population looks like, in 10 maps". The Washington Post. November 11, 2014. Retrieved August 11, 2019.
- Fishkind, Hank (March 15, 2014). "Harsh winters make Florida attractive for visitors, moves". Florida Today. Melbourne, Florida. pp. 4A. Retrieved March 28, 2014.