Saint-Sauveur-Camprieu
Saint-Sauveur-Camprieu (French pronunciation: [sɛ̃ sovœʁ kɑ̃pʁijø]; Occitan: Sent Sauvaire e Camriu) is a commune in the Gard department in southern France.
Saint-Sauveur-Camprieu | |
|---|---|
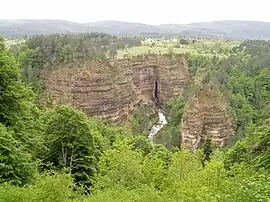 Bramabiau Gorge | |
.svg.png.webp) Coat of arms | |
Location of Saint-Sauveur-Camprieu | |
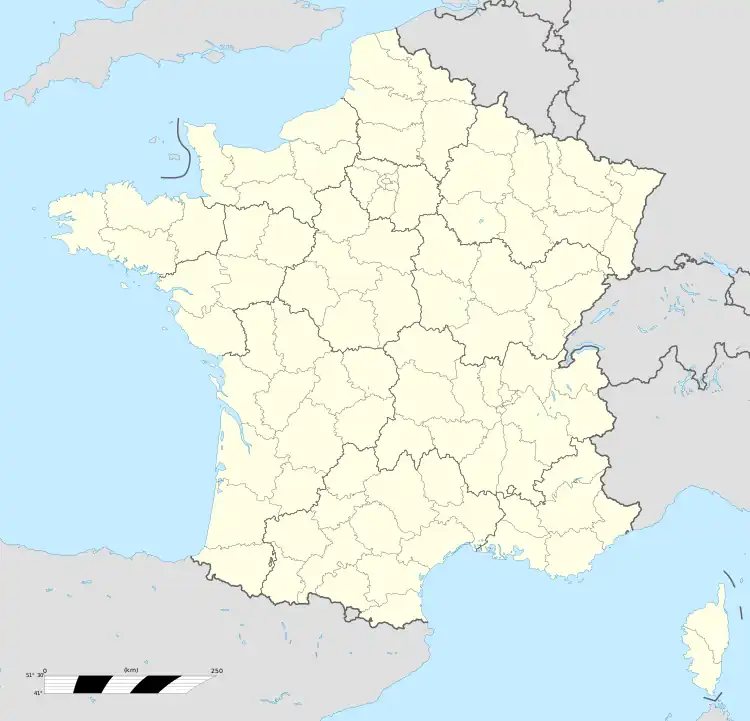 Saint-Sauveur-Camprieu 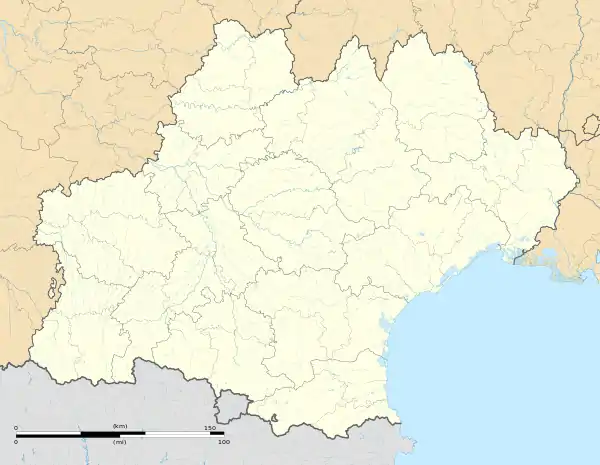 Saint-Sauveur-Camprieu | |
| Coordinates: 44°07′00″N 3°28′41″E | |
| Country | France |
| Region | Occitania |
| Department | Gard |
| Arrondissement | Le Vigan |
| Canton | Le Vigan |
| Government | |
| • Mayor (2020–2026) | Nicole Amasse[1] |
| Area 1 | 31.74 km2 (12.25 sq mi) |
| Population | 221 |
| • Density | 7.0/km2 (18/sq mi) |
| Time zone | UTC+01:00 (CET) |
| • Summer (DST) | UTC+02:00 (CEST) |
| INSEE/Postal code | 30297 /30750 |
| Elevation | 783–1,402 m (2,569–4,600 ft) (avg. 1,112 m or 3,648 ft) |
| 1 French Land Register data, which excludes lakes, ponds, glaciers > 1 km2 (0.386 sq mi or 247 acres) and river estuaries. | |
Geography
Climate
Saint-Sauveur-Camprieu has a oceanic climate (Köppen climate classification Cfb) closely bordering on a warm-summer Mediterranean climate (Csb). The average annual temperature in Saint-Sauveur-Camprieu is 8.6 °C (47.5 °F). The average annual rainfall is 1,474.9 mm (58.07 in) with November as the wettest month. The temperatures are highest on average in July, at around 17.0 °C (62.6 °F), and lowest in January, at around 1.2 °C (34.2 °F). The highest temperature ever recorded in Saint-Sauveur-Camprieu was 35.5 °C (95.9 °F) on 28 June 2019; the coldest temperature ever recorded was −18.1 °C (−0.6 °F) on 1 March 2005.
| Climate data for Saint-Sauveur-Camprieu (1991−2020 normals, extremes 1998−present) | |||||||||||||
|---|---|---|---|---|---|---|---|---|---|---|---|---|---|
| Month | Jan | Feb | Mar | Apr | May | Jun | Jul | Aug | Sep | Oct | Nov | Dec | Year |
| Record high °C (°F) | 20.2 (68.4) |
21.5 (70.7) |
22.4 (72.3) |
25.5 (77.9) |
29.3 (84.7) |
35.5 (95.9) |
33.3 (91.9) |
34.4 (93.9) |
28.7 (83.7) |
26.7 (80.1) |
21.6 (70.9) |
22.6 (72.7) |
35.5 (95.9) |
| Average high °C (°F) | 4.8 (40.6) |
5.3 (41.5) |
8.9 (48.0) |
12.0 (53.6) |
15.8 (60.4) |
20.9 (69.6) |
23.3 (73.9) |
23.2 (73.8) |
18.9 (66.0) |
14.1 (57.4) |
8.2 (46.8) |
5.8 (42.4) |
13.4 (56.1) |
| Daily mean °C (°F) | 1.2 (34.2) |
1.3 (34.3) |
4.3 (39.7) |
7.1 (44.8) |
10.7 (51.3) |
15.0 (59.0) |
17.0 (62.6) |
17.0 (62.6) |
13.3 (55.9) |
9.7 (49.5) |
4.7 (40.5) |
2.1 (35.8) |
8.6 (47.5) |
| Average low °C (°F) | −2.5 (27.5) |
−2.8 (27.0) |
−0.3 (31.5) |
2.2 (36.0) |
5.6 (42.1) |
9.0 (48.2) |
10.8 (51.4) |
10.8 (51.4) |
7.7 (45.9) |
5.3 (41.5) |
1.1 (34.0) |
−1.6 (29.1) |
3.8 (38.8) |
| Record low °C (°F) | −15.7 (3.7) |
−15.9 (3.4) |
−18.1 (−0.6) |
−9.9 (14.2) |
−3.2 (26.2) |
−1.8 (28.8) |
−0.5 (31.1) |
1.7 (35.1) |
−0.7 (30.7) |
−9.5 (14.9) |
−12.2 (10.0) |
−16.3 (2.7) |
−18.1 (−0.6) |
| Average precipitation mm (inches) | 138.1 (5.44) |
93.8 (3.69) |
97.6 (3.84) |
147.7 (5.81) |
121.8 (4.80) |
81.9 (3.22) |
56.3 (2.22) |
59.3 (2.33) |
127.5 (5.02) |
189.0 (7.44) |
220.2 (8.67) |
141.7 (5.58) |
1,474.9 (58.07) |
| Average precipitation days (≥ 1.0 mm) | 11.5 | 9.1 | 9.6 | 10.9 | 10.5 | 7.5 | 6.2 | 6.8 | 7.7 | 11.8 | 12.6 | 11.7 | 116.1 |
| Source: Météo-France[3] | |||||||||||||
Population
| Year | Pop. | ±% |
|---|---|---|
| 171 | 1,968 | — |
| 218 | 1,975 | +0.4% |
| 204 | 1,982 | +0.4% |
| 201 | 1,990 | +0.4% |
| 198 | 1,999 | +0.5% |
| 188 | 2,008 | +0.5% |
| 268 | — |
Sights
- Bramabiau Gorge
- Arboretum de Saint-Sauveur-des-Pourcils
See also
References
- "Répertoire national des élus: les maires" (in French). data.gouv.fr, Plateforme ouverte des données publiques françaises. 13 September 2022.
- "Populations légales 2020". The National Institute of Statistics and Economic Studies. 29 December 2022.
- "Fiche Climatologique Statistiques 1991-2020 et records" (PDF) (in French). Météo-France. Retrieved 4 September 2022.