Sumène
Sumène (French pronunciation: [symɛn]; Occitan: Sumena) is a commune in the Gard department in southern France.
Sumène | |
|---|---|
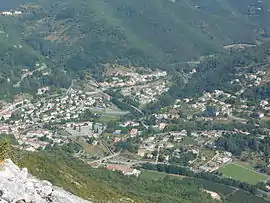 A general view of Sumène | |
.svg.png.webp) Coat of arms | |
Location of Sumène | |
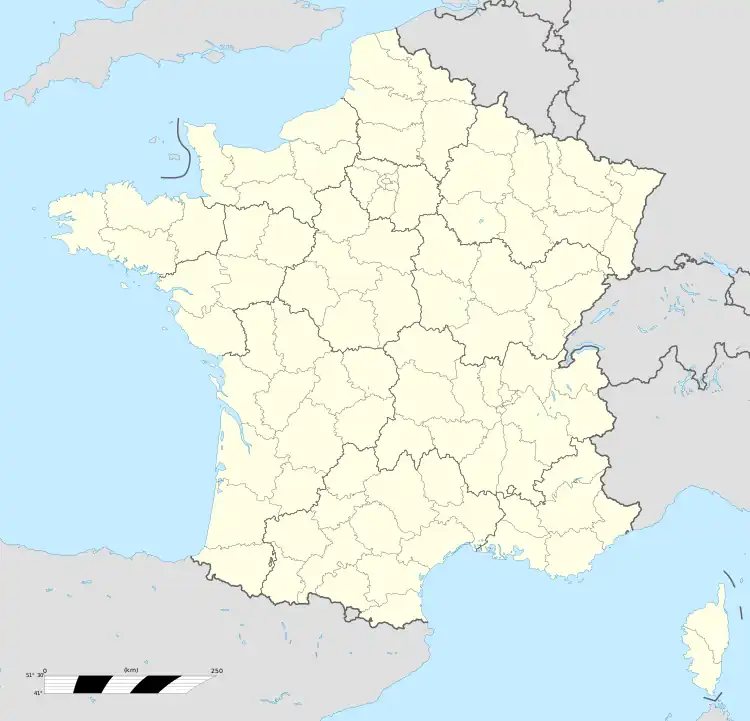 Sumène 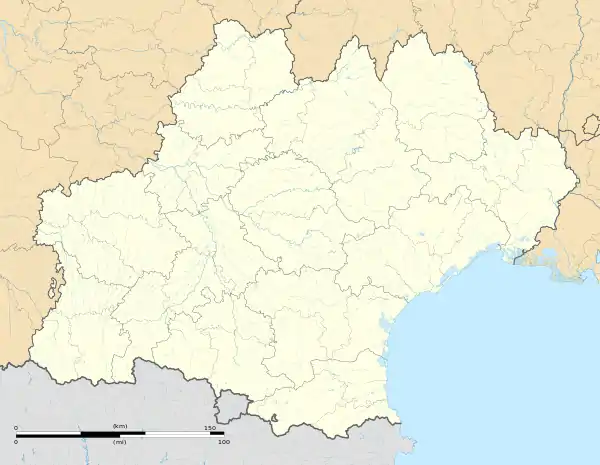 Sumène | |
| Coordinates: 43°58′55″N 3°42′58″E | |
| Country | France |
| Region | Occitania |
| Department | Gard |
| Arrondissement | Le Vigan |
| Canton | Le Vigan |
| Intercommunality | Cévennes Gangeoises et Suménoises |
| Government | |
| • Mayor (2020–2026) | Ghislain Pallier[1] |
| Area 1 | 36.59 km2 (14.13 sq mi) |
| Population | 1,308 |
| • Density | 36/km2 (93/sq mi) |
| Time zone | UTC+01:00 (CET) |
| • Summer (DST) | UTC+02:00 (CEST) |
| INSEE/Postal code | 30325 /30440 |
| Elevation | 175–933 m (574–3,061 ft) (avg. 205 m or 673 ft) |
| 1 French Land Register data, which excludes lakes, ponds, glaciers > 1 km2 (0.386 sq mi or 247 acres) and river estuaries. | |
Geography
Climate
Sumène has a hot-summer Mediterranean climate (Köppen climate classification Csa) closely bordering on a warm-summer Mediterranean climate (Csb). The average annual temperature in Sumène is 13.4 °C (56.1 °F). The average annual rainfall is 1,245.5 mm (49.04 in) with October as the wettest month. The temperatures are highest on average in July, at around 22.8 °C (73.0 °F), and lowest in January, at around 5.2 °C (41.4 °F). The highest temperature ever recorded in Sumène was 41.0 °C (105.8 °F) on 12 August 2003; the coldest temperature ever recorded was −13.8 °C (7.2 °F) on 15 January 1985.
| Climate data for Sumène (1981−2010 normals, extremes 1978−2011) | |||||||||||||
|---|---|---|---|---|---|---|---|---|---|---|---|---|---|
| Month | Jan | Feb | Mar | Apr | May | Jun | Jul | Aug | Sep | Oct | Nov | Dec | Year |
| Record high °C (°F) | 20.0 (68.0) |
22.0 (71.6) |
29.0 (84.2) |
31.2 (88.2) |
34.8 (94.6) |
37.0 (98.6) |
40.8 (105.4) |
41.0 (105.8) |
38.0 (100.4) |
31.0 (87.8) |
25.0 (77.0) |
20.4 (68.7) |
41.0 (105.8) |
| Average high °C (°F) | 10.0 (50.0) |
11.7 (53.1) |
15.8 (60.4) |
18.3 (64.9) |
22.7 (72.9) |
27.2 (81.0) |
30.8 (87.4) |
30.3 (86.5) |
25.4 (77.7) |
19.1 (66.4) |
13.5 (56.3) |
10.1 (50.2) |
19.6 (67.3) |
| Daily mean °C (°F) | 5.2 (41.4) |
6.1 (43.0) |
9.4 (48.9) |
11.9 (53.4) |
15.9 (60.6) |
19.8 (67.6) |
22.8 (73.0) |
22.4 (72.3) |
18.3 (64.9) |
13.9 (57.0) |
8.8 (47.8) |
5.7 (42.3) |
13.4 (56.1) |
| Average low °C (°F) | 0.4 (32.7) |
0.6 (33.1) |
3.0 (37.4) |
5.6 (42.1) |
9.1 (48.4) |
12.3 (54.1) |
14.7 (58.5) |
14.5 (58.1) |
11.3 (52.3) |
8.7 (47.7) |
4.0 (39.2) |
1.2 (34.2) |
7.2 (45.0) |
| Record low °C (°F) | −13.8 (7.2) |
−13.0 (8.6) |
−12.0 (10.4) |
−2.5 (27.5) |
0.0 (32.0) |
4.5 (40.1) |
6.7 (44.1) |
5.0 (41.0) |
3.0 (37.4) |
−3.0 (26.6) |
−8.5 (16.7) |
−9.4 (15.1) |
−13.8 (7.2) |
| Average precipitation mm (inches) | 97.5 (3.84) |
82.3 (3.24) |
65.0 (2.56) |
107.9 (4.25) |
98.7 (3.89) |
64.2 (2.53) |
37.8 (1.49) |
58.9 (2.32) |
150.7 (5.93) |
192.2 (7.57) |
152.8 (6.02) |
137.5 (5.41) |
1,245.5 (49.04) |
| Average precipitation days (≥ 1.0 mm) | 7.6 | 6.6 | 5.8 | 7.9 | 7.9 | 5.4 | 3.6 | 4.9 | 6.2 | 9.9 | 8.4 | 7.8 | 82.1 |
| Source: Météo-France[3] | |||||||||||||
Population
| Year | Pop. | ±% |
|---|---|---|
| 1962 | 1,687 | — |
| 1968 | 1,913 | +13.4% |
| 1975 | 1,702 | −11.0% |
| 1982 | 1,613 | −5.2% |
| 1990 | 1,417 | −12.2% |
| 1999 | 1,492 | +5.3% |
| 2008 | 1,555 | +4.2% |
See also
References
- "Répertoire national des élus: les maires". data.gouv.fr, Plateforme ouverte des données publiques françaises (in French). 2 December 2020.
- "Populations légales 2020". The National Institute of Statistics and Economic Studies. 29 December 2022.
- "Fiche Climatologique Statistiques 1981-2010 et records" (PDF) (in French). Météo-France. Retrieved 4 September 2022.
Wikimedia Commons has media related to Sumène.
This article is issued from Wikipedia. The text is licensed under Creative Commons - Attribution - Sharealike. Additional terms may apply for the media files.