This article was co-authored by wikiHow Staff. Our trained team of editors and researchers validate articles for accuracy and comprehensiveness. wikiHow's Content Management Team carefully monitors the work from our editorial staff to ensure that each article is backed by trusted research and meets our high quality standards.
This article has been viewed 309,580 times.
Learn more...
When two variables are directly proportional, they change at the same rate. The rate is shown by the constant in the equation . Directly proportional variables are indicated graphically by a straight line passing through the origin of the coordinate plane. Once you understand these basic concepts, it is easy to identify directly proportional variables by using the equation of their line, or their values.


Steps
Rewriting the Equation of the Line
-
1Understand direct proportion. Two variables are in direct proportion if each variable changes at the same rate.[1] In other words, if changes by a certain factor or constant (), then changes by that same constant ().
-
2Write down the equation of the line. The equation will have two variables and a constant. If you are not given the equation, you cannot use this method.
- For example, you might be given the equation .
Advertisement -
3Rewrite the equation in the form of direct proportion, or variation. The equation is , where equals the y-coordinate of a point on the line, equals the x-coordinate for that same point, and is the constant, or slope of the line. Use algebra to rearrange the equation in the form of . If you can’t rewrite the equation in this form, the variables are not directly proportional. If you can, it proves that they are directly proportional.[2]
- For example, if you multiply both sides of the equation by , the equation becomes , which is in the form of , with being the constant.


Using a Set of Points
-
1Identify the x-coordinates of the first two points. You should be given a list of coordinates, or have a graph from which you can determine the coordinates of the points. If you don’t have the coordinates of points on the line, you cannot use this method.
- For example, you might be given the set of points
- The x-coordinate of the first point is 2, and the x-coordinate of the second point is 4.
-
2Determine the factor by which the variable grows. To do this, determine which factor, or constant, the first x-coordinate is multiplied by to arrive at the second coordinate.
- For example, if the first x-coordinate is 2, and the second x-coordinate is 4, you need to determine what you multiply 2 by to get 4:
So, the variable grows by the constant 2.
- For example, if the first x-coordinate is 2, and the second x-coordinate is 4, you need to determine what you multiply 2 by to get 4:
-
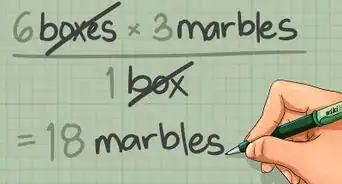
3Determine the factor by which the variable grows. Use the same two points you used to determine the growth of . Use algebra to determine the factor by which the two coordinates vary.
- For example, if the first y-coordinate is 1, and the second y-coordinate is 2, you need to determine what you multiply 1 by to get 2:
So, the variable grows by the constant 2.
- For example, if the first y-coordinate is 1, and the second y-coordinate is 2, you need to determine what you multiply 1 by to get 2:
-
4Compare the constants of the two variables. If and changed at the same rate, or by the same factor, then they are directly proportional.[3]
- For example, since the x-coordinates changed by a factor of 2 while the y-coordinates also changed by a factor of 2, the two variables are directly proportional.


Using a Graph
-
1Note whether the line is straight. When two variables are in proportion, the line representing them will be straight.[4] This means that the slope of the line is constant, or follows the equation .
-
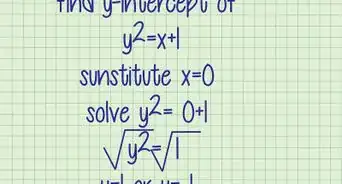
2Determine the y-intercept. The y-intercept is the point where the line crosses the y-axis. When two variables are directly proportional, when graphed their line will cross through the origin. The origin is at the point , so the y-intercept of the line should be . If it isn’t, the variables are not directly proportional.[5]
- The y-axis is the vertical axis.
-
3Find the coordinates of two points on the line. Compare the coordinates with each other, and determine whether each coordinate changed by the same factor.[6] That is, determine whether the constant () is the same for both the and values.
- For example, if the first point is , and the second point is , the x-coordinate changed by a factor of 2, since . The y-coordinate also changed by a factor of 2, since . Thus, you can confirm that the line represents two variables that are directly proportional.


Completing Sample Problems
-
1Look at the equation. Determine whether the two variables are directly proportional: .
- Remember that if the variables are directly proportional, they will follow the pattern .
- Use algebra to rewrite the equation.
- Isolate the variable by dividing each side by :
- Isolate the variable by dividing each side by :
- Assess whether the rewritten equation follows the pattern . In this instance, the equation does not, so the variables are not directly proportional. In fact, they are inversely proportional.[7]
-
2Consider the following set of points. Are the variables directly proportional?
- Determine the growth of . Do this by finding the factor you multiply the first x-coordinate by to reach the second coordinate:
So, the x-coordinate grows by factor of 3. - Determine the growth of :
So, the y-coordinate grows by factor of 3. - Compare the factor, or constant, of the two variables. They both grow by a factor of 3. Therefore, the variables are directly proportional.
- Determine the growth of . Do this by finding the factor you multiply the first x-coordinate by to reach the second coordinate:
-
3Consider a graph of the line . Does the graph show direct proportion between variables?
- Note whether the line is straight. Since the equation of the line is in slope-intercept form, it has a constant slope, meaning the line is straight. So potentially, the variables are directly proportional.
- Determine the y-intercept. If the variables are directly proportional, the line will pass through the point . The y-intercept of this line is the point . So, the variables are not directly proportional.


Community Q&A
-
QuestionDoes a direct proportion need to have a slope of 0?
 DonaganTop AnswererNo. A zero slope means there's no change at all; thus, no proportionality at all.
 -
QuestionHow do I solve indirect proportion?DonaganTop AnswererIf you're referring to inverse proportionality, such a case can be represented by xy = k, or y = k/x, or x = k/y, where x and y are variables, and k is a constant. If you can express x and y by any of those equations, you know that x and y are inversely proportional to each other (meaning that x goes up at the same rate that y goes down, or vice versa).
-
QuestionIn your example of ordered pairs x = 2, 4, 6 and y = 1, 2, 3, only the first two a and y values increased by the same constant of 2, yet you said that the example was a direct variation. Why?DonaganTop AnswererIt is a "direct variation," because each x value is related identically to the corresponding y value (x = 2y). We call this a direct proportion.


References
- ↑ https://www.mathsisfun.com/algebra/directly-inversely-proportional.html
- ↑ https://www.khanacademy.org/math/algebra2/rational-expressions-equations-and-functions/direct-and-inverse-variation/v/recognizing-direct-and-inverse-variation
- ↑ https://www.khanacademy.org/math/algebra2/rational-expressions-equations-and-functions/direct-and-inverse-variation/v/recognizing-direct-and-inverse-variation
- ↑ http://www.gcse.com/physics_coursework_analysing_direct_proportion.htm
- ↑ http://www.gcse.com/physics_coursework_analysing_direct_proportion.htm
- ↑ https://virtualnerd.com/common-core/grade-8/8_EE-expressions-equations/B/5/graph-direct-variation-definition
- ↑ https://www.khanacademy.org/math/algebra2/rational-expressions-equations-and-functions/direct-and-inverse-variation/v/recognizing-direct-and-inverse-variation
About This Article

To tell if 2 variables are directly proportional while looking at their graphs, note if their x- and y- intercept coordinates are changed by the same factor. If they are, they are proportional! If you don't have a graph, you can tell if 2 variables are directly proportional by writing down the equation of the line. If you can use algebra to rewrite the equation to read y=kx, wherein y = the y coordinate, k = the constant, and x = the x coordinate, then the variables are directly proportional. To learn how to use a set of points, keep reading!