This article was co-authored by Gonzalo Martinez. Gonzalo Martinez is the President of CleverTech, a tech repair business in San Jose, California founded in 2014. CleverTech LLC specializes in repairing Apple products. CleverTech pursues environmental responsibility by recycling aluminum, display assemblies, and the micro components on motherboards to reuse for future repairs. On average, they save 2 lbs - 3 lbs more electronic waste daily than the average computer repair store.
This article has been viewed 46,142 times.
Task Manager, which goes by the name of Activity Monitor on Mac OS X, is an application that allows you to view and monitor all active processes running on your computer. If your computer is running slow or inefficiently, you can open Activity Monitor to determine which applications are consuming the highest amount of resources. Activity Monitor is stored in the Utilities folder on Mac OS X.
Steps
Opening Activity Monitor


Using Activity Monitor
-
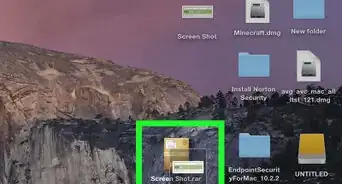
1Click on the “CPU” column near the top of Activity Monitor to sort processes by CPU and determine which processes are consuming the highest amount of resources. This can be helpful if your computer is running slow, and you want to identify one or more applications slowing down your computer.
-
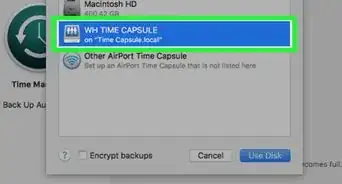
2Click on the process name you want ended, then click on “Quit Process.” That particular process or application will close and free up CPU on your computer. For example, if you downloaded a third-party application that continues to run in the background, consider ending that particular process to free up CPU.[1]
- Select the option to “Force Quit” any processes that are unresponsive or won’t close after selecting “Quit.” Applications that are looping, unresponsive, or taking an excessive amount of time to load may need to be closed using the “Force Quit” option.
-
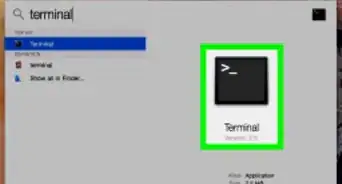
3Click on the “Memory” or “System Memory” tab to view information about the amount of memory being used on your computer. The Memory tab will display your computer’s allotments of free memory, and is useful for determining whether you need to install more RAM to improve speed and efficiency.
- If there is little to no memory next to “Free,” or any values displayed next to “Swap Used,” you may want to consider purchasing more RAM for your computer. These signs indicate that your computer is out of physical memory and is using a portion of the hard drive for temporary storage -- leading to longer wait times.
-
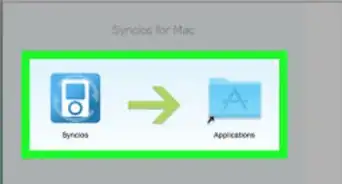
4Click on the “Energy” tab to see an overview of your computer’s overall energy use, as well as the amount of energy being used by each application. The Energy tab will also display information about your computer’s battery life.
-
5Click on the “Disk” tab to view total disk activity across all processes, as well as the amount of data each process has read from and written to your disk.
-
6Click on the “Network” tab to view the amount of data your Mac is sending and receiving over your network. The Network tab can be useful for identifying the processes sending and receiving the most data on your computer.[2]


References
About This Article