X
wikiHow is a “wiki,” similar to Wikipedia, which means that many of our articles are co-written by multiple authors. To create this article, volunteer authors worked to edit and improve it over time.
This article has been viewed 29,192 times.
Learn more...
Hypothesis testing for a proportion is used to determine if a sampled proportion is significantly different from a specified population proportion. For example, if you expect the proportion of male births to be 50 percent, but the actual proportion of male births is 53 percent in a sample of 1000 births. Is this significantly different from the hypothesized population parameter? To find out, follow these steps.
Steps
-
1Formulate your research question. Hypothesis testing for a proportion is appropriate for comparing proportions of a sample to a hypothesized population parameter.[1]
- Examples of questions that can be answered using hypothesis testing for a proportion:
- Are there more than 50 percent of Americans who self-identify as liberal?
- Is the percentage of defects in a given manufacturing plant more than 5%?
- Is the proportion of babies born male different from 50 percent?
- Examples of questions that should be answered using another test:
- Are there more Americans who self-identify as liberal than as conservative? (Use hypothesis testing for 2 proportions instead.)
- Is the mean number of defects in a given manufacturing plant more than 50 per month? (Use hypothesis testing for one sample t-test instead.)
- Are male births related to paternal age? (Use chi-square test for independence instead.)
- Examples of questions that can be answered using hypothesis testing for a proportion:
-
2Check to see if the following assumptions are met:[2]
- Simple random sampling is used.
- Each sample point can result in only one of two possible outcomes. These outcomes are called successes and failures.
- The sample includes at least 10 successes and 10 failures.
- The population size is at least 20 times as big as the sample size.
Advertisement -
3State the null hypothesis and the alternative hypothesis. The null hypothesis (H0) always contains an equality, and is the one you are trying to refute. The alternative (research) hypothesis never contains an equality, and is the one you are trying to confirm. These two hypotheses are stated so that they are mutually exclusive and collectively exhaustive. Mutually exclusive means that if one is true, the other must be false, and vice versa. Collectively exhaustive means that at least one of the outcomes must occur. Your hypotheses are formulated depending on whether it is right-tailed, left-tailed, or 2-tailed:
- Right-tailed: Research question: Is the sample proportion greater than the hypothesized population proportion? Your hypotheses would be stated as follows: H0: p<=p0; Ha: p>p0.
- Left-tailed: Research question: Is the sample proportion less than the hypothesized population proportion? Your hypotheses would be stated as follows: H0: p>=p0; Ha: p<p0.
- Two-tailed: Research question: Is the sample proportion different from the hypothesized population proportion? Your hypotheses would be stated as follows: H0: p=p0; Ha: p<>p0.
- In your example, you can use a two-tailed test to see if the sample proportion of male births, 0.53, is different from the hypothesized population proportion of 0.50. So H0: p=0.50; Ha: p<>0.50. Typically, if there is no a priori reason to believe that any differences must be unidirectional, the two-tailed test is preferred as it is a more stringent test.
-
4Set an appropriate significance level (alpha). By definition, the alpha level is the probability of rejecting the null hypothesis when the null hypothesis is true.[3] Most commonly, alpha is set at 0.05, although any other values (between 0 and 1, exclusive) can be used instead. Other commonly used alpha values include 0.01 and 0.10.
-
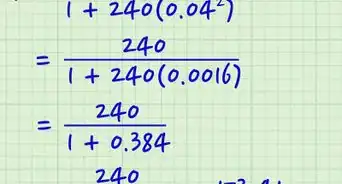
5Calculate the test statistic, z. The formula is z = (p - p0)/s, where s = standard deviation of the sampling distribution = sqrt(p0*(1-p0)/n).
- In our example, p=0.53, p0=0.50, and n=1000. s = sqrt(0.50*(1-0.50)/1000) = 0.0158. the test statistic is z = (0.53-0.50)/0.0158 = 1.8974.
-
6Convert the test statistic to a p value. p value is the probability that a randomly selected sample of n would have a sample statistic at least as different as the one obtained. p value is the tail area under the normal curve in the direction of the alternative hypothesis. For example, if a right-tailed test is used, p value is the right-tailed area, or area to the right of the z value. If a two-tailed test is used, p value is the area in both tails. p value can be found using one of several methods:
- Normal distribution probability z table. Examples can be found on the web, such as this. It is important to read the table description to note what probability is listed by the table. Some tables list cumulative (left side) area, others list right tail area, still others list only area from mean up to a positive z value.
- Excel. The excel function =norm.s.dist(z,cumulative). Substitute the numeric value for z and "true" for cumulative. This excel formula gives cumulative area to the left of a given z value. For your example, you would use the formula =norm.s.dist(1.8974,true) to find the cumulative left side area, which includes the left tail and the body. (Body is the area from -z to z.) You can subtract this from 1 to find the right tail area. Since your example is 2-tailed, you would then multiply by 2. A formula for p can be =2*(1-norm.s.dist(1.8974,true)). The output is 0.0578.
- Texas Instrument calculator, such as TI-83 or TI-84.
- Online normal distribution calculators.
-
7Decide between null hypothesis or alternative hypothesis. If p<alpha, reject H0. Otherwise, fail to reject H0. In your example, since p=0.0578 is greater than alpha=0.05, you fail to reject H0.
-
8State a conclusion about the research question. For your example, you fail to reject the null hypothesis that the proportion of babies born male is 0.50. There is insufficient evidence to support the claim that the proportion of male birth is not 0.50.


Advertisement


References
About This Article
Advertisement