wikiHow is a “wiki,” similar to Wikipedia, which means that many of our articles are co-written by multiple authors. To create this article, 24 people, some anonymous, worked to edit and improve it over time.
wikiHow marks an article as reader-approved once it receives enough positive feedback. This article received 29 testimonials and 100% of readers who voted found it helpful, earning it our reader-approved status.
This article has been viewed 2,523,693 times.
Learn more...
Standard deviation tells you how spread out the numbers are in a sample.[1] Once you know what numbers and equations to use, calculating standard deviation is simple!
Steps
Finding the Mean
-
1Look at your data set. This is a crucial step in any type of statistical calculation, even if it is a simple figure like the mean or median.[2]
- Know how many numbers are in your sample.
- Do the numbers vary across a large range? Or are the differences between the numbers small, such as just a few decimal places?
- Know what type of data you are looking at. What do your numbers in your sample represent? this could be something like test scores, heart rate readings, height, weight etc.
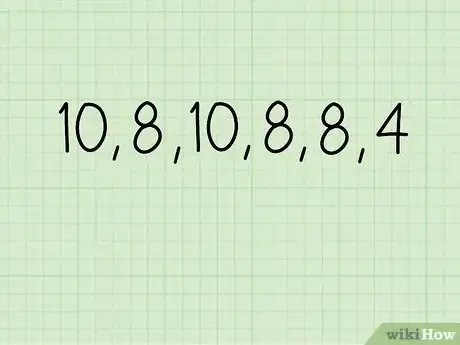
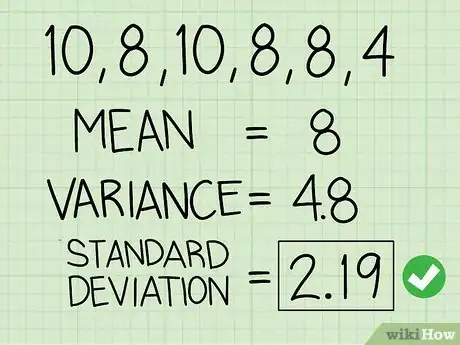
- For example, a set of test scores is 10, 8, 10, 8, 8, and 4.
-
2Gather all of your data. You will need every number in your sample to calculate the mean.[3]
- The mean is the average of all your data points.
- This is calculated by adding all of the numbers in your sample, then dividing this figure by the how many numbers there are in your sample (n).
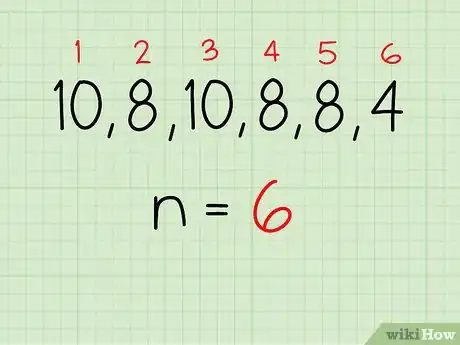
- In the sample of test scores (10, 8, 10, 8, 8, 4) there are 6 numbers in the sample. Therefore n = 6.
Advertisement -
3Add the numbers in your sample together. This is the first part of calculating a mathematical average or mean.[4]
- For example, use the data set of quiz scores: 10, 8, 10, 8, 8, and 4.
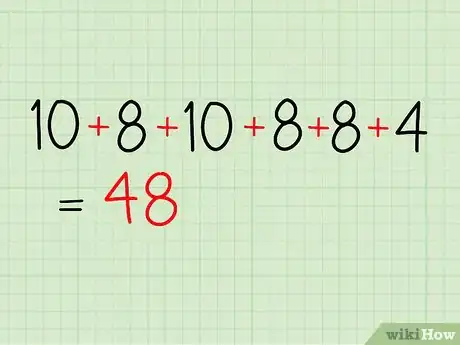
- 10 + 8 + 10 + 8 + 8 + 4 = 48. This is the sum of all the numbers in the data set or sample.
- Add the numbers a second time to check your answer.
-
4Divide the sum by how many numbers there are in your sample (n). This will provide the average or mean of the data.[5]
- In the sample of test scores (10, 8, 10, 8, 8, and 4) there are six numbers, so n = 6.
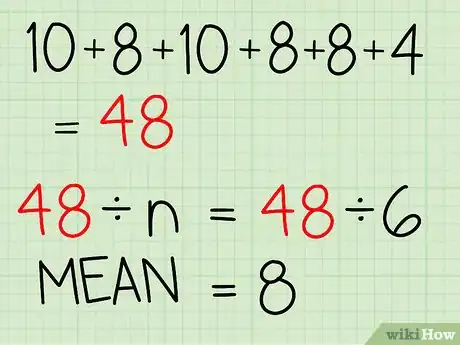
- The sum of the test scores in the example was 48. So you would divide 48 by n to figure out the mean.
- 48 / 6 = 8
- The mean test score in the sample is 8.
Finding the Variance In Your Sample
-
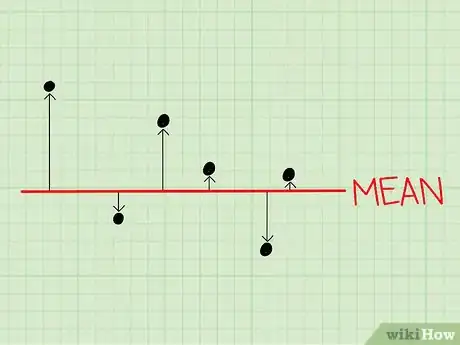
1Find the variance. The variance is a figure that represents how far the data in your sample is clustered around the mean.[6]
- This figure will give you an idea of how far your data is spread out.
- Samples with low variance have data that is clustered closely about the mean.
- Samples with high variance have data that is clustered far from the mean.
- Variance is often used to compare the distribution of two data sets.
-
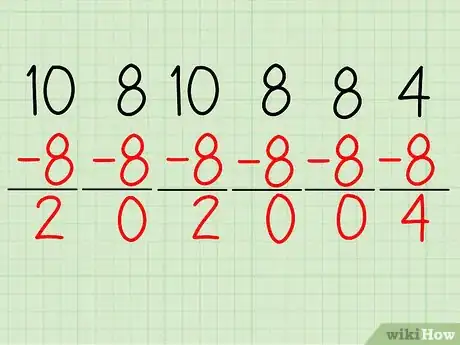
2Subtract the mean from each of your numbers in your sample. This will give you a figure of how much each data point differs from the mean.[7]
- For example, in our sample of test scores (10, 8, 10, 8, 8, and 4) the mean or mathematical average was 8.
- 10 - 8 = 2; 8 - 8 = 0, 10 - 8 = 2, 8 - 8 = 0, 8 - 8 = 0, and 4 - 8 = -4.
- Do this procedure again to check each answer. It is very important you have each of these figures correct as you will need them for the next step.
-
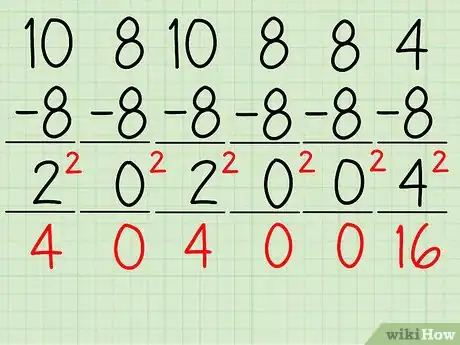
3Square all of the numbers from each of the subtractions you just did. You will need each of these figures to find out the variance in your sample.[8]
- Remember, in our sample we subtracted the mean (8) from each of the numbers in the sample (10, 8, 10, 8, 8, and 4) and came up with the following: 2, 0, 2, 0, 0 and -4.
- To do the next calculation in figuring out variance you would perform the following: 22, 02, 22, 02, 02, and (-4)2 = 4, 0, 4, 0, 0, and 16.
- Check your answers before proceeding to the next step.
-
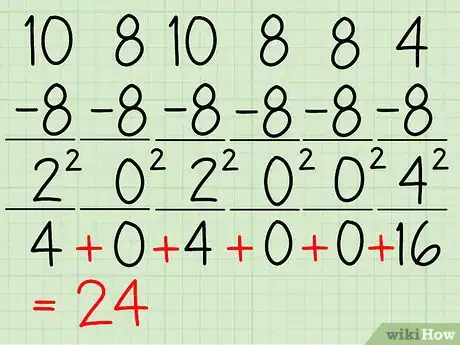
4Add the squared numbers together. This figure is called the sum of squares.[9]
- In our example of test scores, the squares were as follows: 4, 0, 4, 0, 0, and 16.
- Remember, in the example of test scores we started by subtracting the mean from each of the scores and squaring these figures: (10-8)^2 + (8-8)^2 + (10-8)^2 + (8-8)^2 + (8-8)^2 + (4-8)^2
- 4 + 0 + 4 + 0 + 0 + 16 = 24.
- The sum of squares is 24.
-
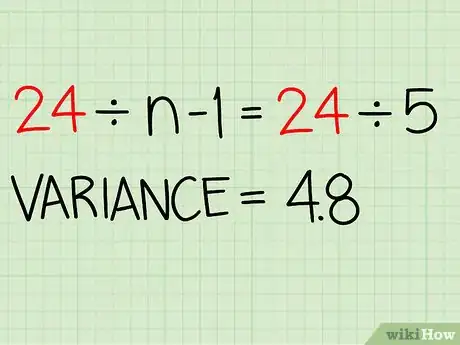
5Divide the sum of squares by (n-1). Remember, n is how many numbers are in your sample. Doing this step will provide the variance. The reason to use n-1 is to have sample variance and population variance unbiased. [10]
- In our sample of test scores (10, 8, 10, 8, 8, and 4) there are 6 numbers. Therefore, n = 6.
- n-1 = 5.
- Remember the sum of squares for this sample was 24.
- 24 / 5 = 4.8
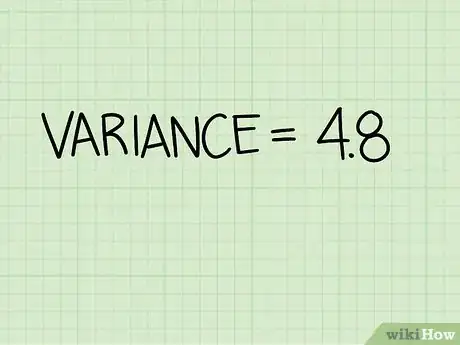
- The variance in this sample is thus 4.8.
Calculating the Standard Deviation
-
1Find your variance figure. You will need this to find the standard deviation for your sample.[11]
- Remember, variance is how spread out your data is from the mean or mathematical average.
- Standard deviation is a similar figure, which represents how spread out your data is in your sample.
- In our example sample of test scores, the variance was 4.8.
-
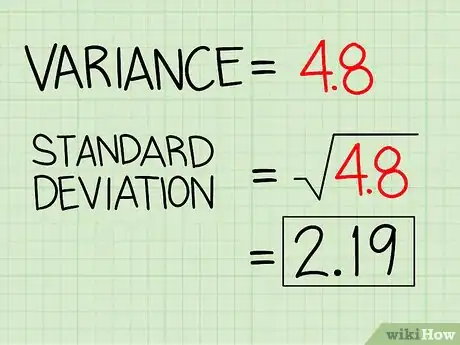
2Take the square root of the variance. This figure is the standard deviation.[12]
- Usually, at least 68% of all the samples will fall inside one standard deviation from the mean.
- Remember in our sample of test scores, the variance was 4.8.
- √4.8 = 2.19. The standard deviation in our sample of test scores is therefore 2.19.
- 5 out of 6 (83%) of our sample of test scores (10, 8, 10, 8, 8, and 4) is within one standard deviation (2.19) from the mean (8).
-
3Go through finding the mean, variance and standard deviation again. This will allow you to check your answer.[13]
- It is important that you write down all steps to your problem when you are doing calculations by hand or with a calculator.
- If you come up with a different figure the second time around, check your work.
- If you cannot find where you made a mistake, start over a third time to compare your work.
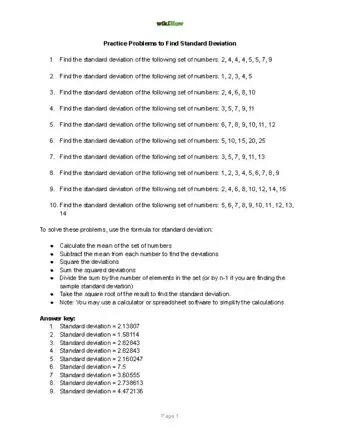
Practice Problems and Answers
Community Q&A
-
QuestionWhat is the standard deviation of 10 samples with a mean of 29.05?
 Community AnswerDepends on the 10 samples of data. If all ten numbers were 29.05 then the standard deviation would be zero. Standard deviation is a measure of how much the data deviates from the mean.
 -
QuestionHow do I calculate the standard deviation of 5 samples with the mean of 26?
 Community AnswerYou take the average of 26 and 5, divide by b squared and multiply by deviation equation constant.
 -
QuestionHow do I find the standard deviation of 10 samples with a mean of 29.05?
 Community AnswerTake each sample and subract the mean. Next, square each result, getting rid of the negative. Add the 10 results and divide the sun by 10 - 1 or 9. That is the standard deviation.
References
- ↑ http://www.mathsisfun.com/data/standard-deviation.html
- ↑ http://www.mathsisfun.com/data/standard-deviation.html
- ↑ http://www.mathsisfun.com/data/standard-deviation.html
- ↑ http://www.mathsisfun.com/data/standard-deviation.html
- ↑ http://www.mathsisfun.com/data/standard-deviation.html
- ↑ http://pirate.shu.edu/~wachsmut/Teaching/MATH1101/Descriptives/variability.html
- ↑ http://pirate.shu.edu/~wachsmut/Teaching/MATH1101/Descriptives/variability.html
- ↑ http://pirate.shu.edu/~wachsmut/Teaching/MATH1101/Descriptives/variability.html
- ↑ http://pirate.shu.edu/~wachsmut/Teaching/MATH1101/Descriptives/variability.html
- ↑ http://pirate.shu.edu/~wachsmut/Teaching/MATH1101/Descriptives/variability.html
- ↑ http://pirate.shu.edu/~wachsmut/Teaching/MATH1101/Descriptives/variability.html
- ↑ http://pirate.shu.edu/~wachsmut/Teaching/MATH1101/Descriptives/variability.html
- ↑ http://pirate.shu.edu/~wachsmut/Teaching/MATH1101/Descriptives/variability.html
About This Article
To calculate standard deviation, start by calculating the mean, or average, of your data set. Then, subtract the mean from all of the numbers in your data set, and square each of the differences. Next, add all the squared numbers together, and divide the sum by n minus 1, where n equals how many numbers are in your data set. Finally, take the square root of that number to find the standard deviation. To learn how to find standard deviation with the help of example problems, keep reading!
