List of municipalities in Saskatchewan
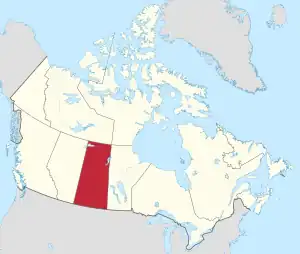
Saskatchewan is the sixth-most populous province in Canada with 1,132,505 residents as of 2021 and is the fifth-largest in land area at 588,244 km2 (227,122 sq mi).[1] In 2021, Saskatchewan's 774 municipalities covered 52.1% of the province's land mass and were home to 94.9% of its population.[2][3][lower-alpha 1] These 774 municipalities are local government "creatures of provincial jurisdiction" with natural persons power.[4] One of the key purposes of Saskatchewan's municipalities are "to provide services, facilities and other things that, in the opinion of council, are necessary or desirable for all or a part of the municipality".[4] Other purposes are to: "provide good government"; "develop and maintain a safe and viable community"; "foster economic, social and environmental well-being" and "provide wise stewardship of public assets."[4]
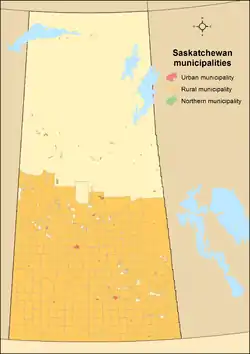
The Government of Saskatchewan's Ministry of Municipal Relations recognizes three general types of municipalities and seven sub-types – urban municipalities (cities, towns, villages and resort villages), rural municipalities and northern municipalities (northern towns, northern villages and northern hamlets).[2] Cities are formed under the provincial authority of The Cities Act, which was enacted in 2002.[5] Towns, villages, resort villages and rural municipalities are formed under the authority of The Municipalities Act, enacted in 2005.[6] The three sub-types of northern municipalities are formed under the authority of The Northern Municipalities Act, enacted in 2010.[7] As provincial laws, these three acts were passed by the Legislative Assembly of Saskatchewan with royal assent granted by the Lieutenant Governor.
Of Saskatchewan's 774 municipalities, 454 of them are urban municipalities (16 cities, 147 towns, 250 villages and 41 resort villages), 296 are rural municipalities and 24 are northern municipalities (2 northern towns, 11 northern villages and 11 northern hamlets).[2] The Cities Act, The Municipalities Act and The Northern Municipalities Act stipulate governance of these municipalities.[5][6][7] Saskatchewan's Ministry of Municipal Relations is responsible for providing provincial programs and services to municipalities.[8]
In 2021, just over 43% of Saskatchewan's population resided in its two largest cities. Saskatoon, the largest city, is home to 24% of the province's population (266,141 residents), while Regina, Saskatchewan's capital city, is home to 20% (226,404 residents).[3] The resort villages of Krydor and Waldron are tied as Saskatchewan's smallest municipalities by population with 15 people each.[3] The largest municipality by land area is the Rural Municipality of Hudson Bay No. 394 at 12,399.12 km2 (4,787.33 sq mi), while the smallest by land area is the Resort Village of Greig Lake at 0.10 km2 (0.039 sq mi).[3]
Urban municipalities
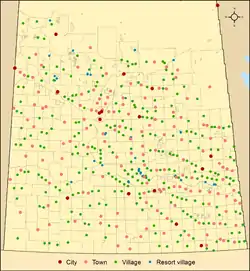


As of 2020, Saskatchewan has 454 urban municipalities, which includes the sub-types of cities, towns, villages and resort villages.[2]
Cities
A city can be created from a town by Saskatchewan's Minister of Municipal Relations by ministerial order via section 39 of The Cities Act if it has a population of 5,000 or more and the change in status is requested by the town council.[5] A city does not automatically revert to town status if the population drops below 5,000; this only occurs if the city council requests it, the majority of electors vote to revert to town status, or the minister is of the opinion that the reversion to town status is in the public interest.[5] Melville retains its city status despite dropping below the 5,000 population threshold in the 1990s.
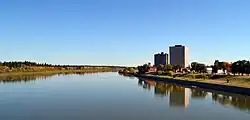
Saskatchewan has 16 cities including Lloydminster, which traverses the provincial border with Alberta.[2] Unlike Lloydminster, Flin Flon, which traverses the provincial border with Manitoba, is not officially recognized as a city. Saskatchewan's 16 cities had a cumulative population of 689,475 in the 2021 Census.[3] Saskatchewan's largest and smallest cities are Saskatoon and Melville with populations of 266,141 and 4,493.[3] The largest and smallest city by land area are Saskatoon and Meadow Lake with 226.56 km2 (87.48 sq mi) and 12.37 km2 (4.78 sq mi).[3]
Cities are governed by a council of six councillors and a mayor, although the council may vary the number of councillors to any even number that is at least two.[5]: s.54 A council may designate a person under the age of 18 years a "youth member" to participate in its session, but such a member is not a councillor and may not vote.[5]: s.56 A city may by bylaw be divided into wards to elect its council.[5]: s.57 The mayor presides over the council as a member and is ex officio a member of every committee of the council unless the council determines otherwise.[5]: s.66
Towns
A town can be created from a village or resort village by Saskatchewan's Minister of Municipal Relations by ministerial order via section 52 of The Municipalities Act if it has a population of 500 or more.[6] Upon reaching a population of 5,000, a town's council may request the minister to change its status to a city in accordance with section 39 of The Cities Act.[5] Should a town's population decline to less than 500, its council may request its status be reverted to village or resort village status.[6]
Saskatchewan has 147 towns that had a cumulative population of 145,995 in the 2021 Census.[2][3] Saskatchewan's largest and smallest towns are Nipawin and Fleming with populations of 4,570 and 70.[3] The largest and smallest town by land area are Battleford and Francis with 23.26 km2 (8.98 sq mi) and 0.62 km2 (0.24 sq mi).[3]
Towns, villages, and resort villages are all governed by a council with a mayor and two councillors, although they may vary that number to any even number at least two unless they are divided into wards.[6]: s.80
Villages
A village can be created from an organized hamlet by Saskatchewan's Minister of Municipal Relations by ministerial order via section 51 of The Municipalities Act if it meets four requirements. It must have:[6]
- been an organized hamlet for three or more years;
- a population of 300 or more;
- 150 or more dwellings or businesses; and
- a taxable assessment of at least $30 million.[5][9]
Upon reaching a population of 500, a village's council may request the minister to change its status to a town in accordance with section 52 of The Municipalities Act.[6]
Saskatchewan has 250 villages that had a cumulative population of 40,447 in the 2021 Census.[2][3] Saskatchewan's largest village is Caronport with a population of 1,033, while Krydor, and Waldron are all tied as the province's smallest villages with populations of 15 each.[3] The largest and smallest villages by land area are Christopher Lake and Minton with 4.59 km2 (1.77 sq mi) and 0.25 km2 (0.097 sq mi).[3]
Resort villages
Like a village, a resort village can be created from an organized hamlet by Saskatchewan's Minister of Municipal Relations by ministerial order via section 51 of The Municipalities Act if it has:
- been an organized hamlet for three or more years;
- can demonstrate with a municipal census of the organized hamlet a permanent and seasonal population of 300 if the most recent national census shows a population of at least 100;
- 150 or more dwellings or businesses;
- a taxable assessment of at least $35 million;
- and is predominantly of a resort nature[6][9]
Upon reaching a population of 500, a resort village's council may request the minister to change its status to a town in accordance with section 52 of The Municipalities Act.[6]
Saskatchewan has 41 resort villages that had a cumulative population of 6,578 in the 2021 Census.[2][3] Saskatchewan's largest resort village by population is Candle Lake with 1,160 inhabitants while the smallest is Sunset Cove with a population of 21.[3] The largest and smallest resort municipalities by land area are Candle Lake and Greig Lake with 62.93 km2 (24.30 sq mi) and 0.010 km2 (0.0039 sq mi).[3]
List of urban municipalities
| Name[10] | Status | Rural municipality[lower-alpha 2] | Incorporation date[11] |
2021 Census of Population[3] | ||||
|---|---|---|---|---|---|---|---|---|
| Population (2021) |
Population (2016) |
Change |
Land area (km2) |
Population density (/km2) | ||||
| Estevan | City | Estevan No. 5 | March 1, 1957 | 10,851 | 11,483 | −5.5% | 18.30 | 593.0 |
| Flin Flon | City | — | April 4, 1952 | 159 | 203 | −21.7% | 2.01 | 79.1 |
| Humboldt | City | Humboldt No. 370 | November 7, 2000 | 6,033 | 5,869 | +2.8% | 13.30 | 453.6 |
| Lloydminster | City | Britannia No. 502 and Wilton No. 472 | January 1, 1958 | 11,843 | 11,765 | +0.7% | 18.06 | 655.8 |
| Martensville | City | Corman Park No. 344 | November 3, 2009 | 10,549 | 9,655 | +9.3% | 13.56 | 777.9 |
| Meadow Lake | City | Meadow Lake No. 588 | November 3, 2009 | 5,322 | 5,344 | −0.4% | 12.37 | 430.2 |
| Melfort | City | Star City No. 428 | September 2, 1980 | 5,955 | 5,992 | −0.6% | 14.73 | 404.3 |
| Melville | City | Cana No. 214 | August 1, 1960 | 4,493 | 4,562 | −1.5% | 14.78 | 304.0 |
| Moose Jaw | City | Moose Jaw No. 161 | November 20, 1903 | 33,665 | 33,910 | −0.7% | 65.81 | 511.5 |
| North Battleford | City | North Battleford No. 437 | May 1, 1913 | 13,836 | 14,315 | −3.3% | 33.55 | 412.4 |
| Prince Albert | City | Prince Albert No. 461 | October 8, 1904 | 37,756 | 35,926 | +5.1% | 67.17 | 562.1 |
| Regina | City | Sherwood No. 159 | June 19, 1903 | 226,404 | 215,106 | +5.3% | 178.81 | 1,266.2 |
| Saskatoon | City | Corman Park No. 344 | May 26, 1906 | 266,141 | 247,201 | +7.7% | 226.56 | 1,174.7 |
| Swift Current | City | Swift Current No. 137 | January 15, 1914 | 16,750 | 16,604 | +0.9% | 29.30 | 571.7 |
| Warman | City | Corman Park No. 344 | October 24, 2012 | 12,419 | 11,020 | +12.7% | 13.10 | 948.0 |
| Weyburn | City | Weyburn No. 67 | September 1, 1913 | 11,019 | 10,870 | +1.4% | 19.03 | 579.0 |
| Yorkton | City | Orkney No. 244 | February 1, 1928 | 16,280 | 16,343 | −0.4% | 36.19 | 449.8 |
| Aberdeen | Town | Aberdeen No. 373 | November 1, 1988 | 716 | 662 | +8.2% | 1.96 | 365.3 |
| Alameda | Town | Moose Creek No. 33 | April 15, 1907 | 345 | 369 | −6.5% | 2.53 | 136.4 |
| Allan | Town | Bayne No. 371 | December 1, 1965 | 625 | 644 | −3.0% | 1.80 | 347.2 |
| Arborfield | Town | Arborfield No. 456 | June 1, 1950 | 285 | 312 | −8.7% | 0.87 | 327.6 |
| Arcola | Town | Brock No. 64 | November 20, 1903 | 636 | 657 | −3.2% | 3.46 | 183.8 |
| Asquith | Town | Vanscoy No. 345 | August 15, 1908 | 624 | 639 | −2.3% | 1.37 | 455.5 |
| Assiniboia | Town | Lake of the Rivers No. 72 | October 1, 1913 | 2,333 | 2,424 | −3.8% | 3.68 | 634.0 |
| Balcarres | Town | Abernethy No. 186 | January 1, 1951 | 616 | 587 | +4.9% | 1.62 | 380.2 |
| Balgonie | Town | Edenwold No. 158 | September 1, 1907 | 1,756 | 1,765 | −0.5% | 4.76 | 368.9 |
| Battleford | Town | Battle River No. 438 | June 15, 1904 | 4,400 | 4,429 | −0.7% | 23.26 | 189.2 |
| Bengough | Town | Bengough No. 40 | April 1, 1958 | 332 | 332 | 0.0% | 1.12 | 296.4 |
| Bienfait | Town | Coalfields No. 4 | March 1, 1957 | 668 | 762 | −12.3% | 3.05 | 219.0 |
| Big River | Town | Big River No. 555 | October 1, 1966 | 666 | 700 | −4.9% | 2.68 | 248.5 |
| Biggar | Town | Biggar No. 347 | November 1, 1911 | 2,133 | 2,226 | −4.2% | 15.37 | 138.8 |
| Birch Hills | Town | Birch Hills No. 460 | August 1, 1960 | 1,066 | 1,033 | +3.2% | 2.39 | 446.0 |
| Blaine Lake | Town | Blaine Lake No. 434 | March 1, 1954 | 509 | 499 | +2.0% | 1.86 | 273.7 |
| Bredenbury | Town | Saltcoats No. 213 | May 1, 1913 | 386 | 372 | +3.8% | 4.61 | 83.7 |
| Broadview | Town | Elcapo No. 154 | May 15, 1907 | 541 | 552 | −2.0% | 2.82 | 191.8 |
| Bruno | Town | Bayne No. 371 | January 1, 1962 | 604 | 611 | −1.1% | 0.94 | 642.6 |
| Burstall | Town | Deer Forks No. 232 | November 1, 1976 | 302 | 278 | +8.6% | 1.09 | 277.1 |
| Cabri | Town | Riverside No. 168 | April 16, 1917 | 413 | 390 | +5.9% | 1.36 | 303.7 |
| Canora | Town | Good Lake No. 274 | November 1, 1910 | 2,092 | 2,024 | +3.4% | 7.35 | 284.6 |
| Carlyle | Town | Antler No. 61 | January 1, 1906 | 1,524 | 1,508 | +1.1% | 5.41 | 281.7 |
| Carnduff | Town | Mount Pleasant No. 2 | August 12, 1905 | 1,150 | 1,099 | +4.6% | 2.61 | 440.6 |
| Carrot River | Town | Moose Range No. 486 | April 1, 1948 | 946 | 973 | −2.8% | 1.75 | 540.6 |
| Central Butte | Town | Enfield No. 194 | July 1, 1967 | 416 | 372 | +11.8% | 2.10 | 198.1 |
| Choiceland | Town | Torch River No. 488 | January 1, 1979 | 342 | 359 | −4.7% | 1.06 | 322.6 |
| Churchbridge | Town | Churchbridge No. 211 | March 1, 1964 | 866 | 896 | −3.3% | 2.57 | 337.0 |
| Colonsay | Town | Colonsay No. 342 | January 1, 1977 | 446 | 451 | −1.1% | 2.40 | 185.8 |
| Coronach | Town | Hart Butte No. 11 | November 1, 1978 | 612 | 643 | −4.8% | 2.34 | 261.5 |
| Craik | Town | Craik No. 222 | August 1, 1907 | 405 | 392 | +3.3% | 3.08 | 131.5 |
| Cudworth | Town | Hoodoo No. 401 | October 1, 1961 | 772 | 814 | −5.2% | 2.12 | 364.2 |
| Cupar | Town | Cupar No. 218 | January 1, 1961 | 598 | 564 | +6.0% | 0.86 | 695.3 |
| Cut Knife | Town | Cut Knife No. 439 | August 1, 1968 | 547 | 573 | −4.5% | 1.88 | 291.0 |
| Dalmeny | Town | Corman Park No. 344 | April 1, 1983 | 1,766 | 1,826 | −3.3% | 3.28 | 538.4 |
| Davidson | Town | Arm River No. 252 | November 15, 1906 | 1,044 | 1,048 | −0.4% | 4.05 | 257.8 |
| Delisle | Town | Vanscoy No. 345 | November 1, 1913 | 1,024 | 1,038 | −1.3% | 3.33 | 307.5 |
| Duck Lake | Town | Duck Lake No. 463 | November 1, 1911 | 579 | 569 | +1.8% | 2.38 | 243.3 |
| Dundurn | Town | Dundurn No. 314 | November 1, 1980 | 675 | 611 | +10.5% | 1.48 | 456.1 |
| Eastend | Town | White Valley No. 49 | March 15, 1920 | 607 | 503 | +20.7% | 2.61 | 232.6 |
| Eatonia | Town | Chesterfield No. 261 | January 1, 1954 | 498 | 524 | −5.0% | 1.60 | 311.3 |
| Elrose | Town | Monet No. 257 | February 1, 1951 | 470 | 496 | −5.2% | 2.89 | 162.6 |
| Esterhazy | Town | Fertile Belt No. 183 | March 1, 1957 | 2,345 | 2,502 | −6.3% | 5.56 | 421.8 |
| Eston | Town | Snipe Lake No. 259 | December 1, 1928 | 972 | 1,061 | −8.4% | 2.65 | 366.8 |
| Fleming | Town | Moosomin No. 121 | June 15, 1907 | 70 | 84 | −16.7% | 1.89 | 37.0 |
| Foam Lake | Town | Foam Lake No. 276 | March 1, 1924 | 1,183 | 1,141 | +3.7% | 6.04 | 195.9 |
| Fort Qu'Appelle | Town | North Qu'Appelle No. 187 | January 1, 1951 | 1,972 | 2,042 | −3.4% | 5.09 | 387.4 |
| Francis | Town | Francis No. 127 | September 24, 1906 | 182 | 217 | −16.1% | 0.62 | 293.5 |
| Govan | Town | Last Mountain Valley No. 250 | November 1, 1911 | 200 | 194 | +3.1% | 1.27 | 157.5 |
| Grand Coulee | Town | Sherwood No. 159 | October 26, 2016 | 606 | 649 | −6.6% | 1.74 | 348.3 |
| Gravelbourg | Town | Gravelbourg No. 104 | November 1, 1916 | 986 | 1,083 | −9.0% | 3.21 | 307.2 |
| Grenfell | Town | Elcapo No. 154 | November 1, 1911 | 1,059 | 1,099 | −3.6% | 3.14 | 337.3 |
| Gull Lake | Town | Gull Lake No. 139 | November 1, 1911 | 908 | 1,046 | −13.2% | 2.40 | 378.3 |
| Hafford | Town | Redberry No. 435 | January 1, 1981 | 414 | 407 | +1.7% | 1.13 | 366.4 |
| Hague | Town | Rosthern No. 403 | November 1, 1991 | 889 | 874 | +1.7% | 1.27 | 700.0 |
| Hanley | Town | Rosedale No. 283 | December 1, 1906 | 540 | 511 | +5.7% | 2.66 | 203.0 |
| Hepburn | Town | Laird No. 404 | October 24, 2012 | 784 | 688 | +14.0% | 1.14 | 687.7 |
| Herbert | Town | Morse No. 165 | November 1, 1912 | 770 | 856 | −10.0% | 3.69 | 208.7 |
| Hudson Bay | Town | Hudson Bay No. 394 | November 30, 1946 | 1,403 | 1,436 | −2.3% | 17.38 | 80.7 |
| Imperial | Town | Big Arm No. 251 | April 1, 1962 | 372 | 360 | +3.3% | 1.20 | 310.0 |
| Indian Head | Town | Indian Head No. 156 | April 19, 1902 | 1,902 | 1,910 | −0.4% | 3.08 | 617.5 |
| Ituna | Town | Ituna Bon Accord No. 246 | October 1, 1961 | 726 | 701 | +3.6% | 1.47 | 493.9 |
| Kamsack | Town | Cote No. 271 | November 1, 1911 | 1,779 | 1,898 | −6.3% | 5.67 | 313.8 |
| Kelvington | Town | Kelvington No. 366 | May 1, 1944 | 827 | 834 | −0.8% | 3.87 | 213.7 |
| Kerrobert | Town | Progress No. 351 | November 1, 1911 | 970 | 1,026 | −5.5% | 8.47 | 114.5 |
| Kindersley | Town | Kindersley No. 290 | November 1, 1910 | 4,567 | 4,597 | −0.7% | 12.91 | 353.8 |
| Kinistino | Town | Kinistino No. 459 | February 7, 1952 | 671 | 654 | +2.6% | 1.58 | 424.7 |
| Kipling | Town | Kingsley No. 124 | January 1, 1954 | 1,076 | 1,074 | +0.2% | 2.55 | 422.0 |
| Kyle | Town | Lacadena No. 228 | January 1, 1959 | 413 | 449 | −8.0% | 1.16 | 356.0 |
| Lafleche | Town | Wood River No. 74 | June 1, 1953 | 373 | 382 | −2.4% | 1.43 | 260.8 |
| Lampman | Town | Browning No. 34 | June 1, 1963 | 673 | 675 | −0.3% | 2.13 | 316.0 |
| Langenburg | Town | Langenburg No. 181 | September 15, 1959 | 1,228 | 1,165 | +5.4% | 3.38 | 363.3 |
| Langham | Town | Corman Park No. 344 | August 1, 1907 | 1,518 | 1,496 | +1.5% | 4.27 | 355.5 |
| Lanigan | Town | Usborne No. 310 | April 15, 1908 | 1,433 | 1,377 | +4.1% | 8.14 | 176.0 |
| Lashburn | Town | Manitou Lake No. 442 | March 1, 1979 | 870 | 983 | −11.5% | 3.05 | 285.2 |
| Leader | Town | Happyland No. 231 | May 1, 1947 | 881 | 863 | +2.1% | 1.68 | 524.4 |
| Lemberg | Town | Abernethy No. 186 | September 1, 1907 | 266 | 313 | −15.0% | 2.67 | 99.6 |
| Leroy | Town | Leroy No. 339 | March 1, 1963 | 510 | 450 | +13.3% | 2.11 | 241.7 |
| Lumsden | Town | Lumsden No. 189 | March 15, 1905 | 1,800 | 1,824 | −1.3% | 4.92 | 365.9 |
| Luseland | Town | Progress No. 351 | January 1, 1954 | 559 | 623 | −10.3% | 1.59 | 351.6 |
| Macklin | Town | Eye Hill No. 382 | November 1, 1912 | 1,247 | 1,374 | −9.2% | 3.05 | 408.9 |
| Maidstone | Town | Eldon No. 471 | March 1, 1955 | 1,209 | 1,185 | +2.0% | 4.39 | 275.4 |
| Maple Creek | Town | Maple Creek No. 111 | April 30, 1903 | 2,176 | 2,084 | +4.4% | 4.35 | 500.2 |
| Marshall | Town | Wilton No. 472 | October 26, 2006 | 522 | 591 | −11.7% | 1.15 | 453.9 |
| Midale | Town | Cymri No. 36 | March 1, 1962 | 510 | 604 | −15.6% | 1.62 | 314.8 |
| Milestone | Town | Brock No. 64 | August 15, 1906 | 682 | 699 | −2.4% | 2.12 | 321.7 |
| Moosomin | Town | Moosomin No. 121 | March 20, 1889 | 2,657 | 2,743 | −3.1% | 7.15 | 371.6 |
| Morse | Town | Morse No. 165 | November 1, 1912 | 216 | 242 | −10.7% | 1.54 | 140.3 |
| Mossbank | Town | Lake Johnston No. 102 | May 15, 1959 | 368 | 360 | +2.2% | 1.56 | 235.9 |
| Naicam | Town | Pleasantdale No. 398 | September 1, 1954 | 651 | 661 | −1.5% | 1.56 | 417.3 |
| Nipawin | Town | Nipawin No. 487 | May 1, 1937 | 4,570 | 4,401 | +3.8% | 8.93 | 511.8 |
| Nokomis | Town | Wreford No. 280 | August 15, 1908 | 414 | 404 | +2.5% | 2.55 | 162.4 |
| Norquay | Town | Clayton No. 333 | March 1, 1963 | 420 | 434 | −3.2% | 1.62 | 259.3 |
| Ogema | Town | Key West No. 70 | January 7, 1913 | 383 | 403 | −5.0% | 1.33 | 288.0 |
| Osler | Town | Corman Park No. 344 | November 1, 1985 | 1,251 | 1,237 | +1.1% | 1.62 | 772.2 |
| Outlook | Town | Rudy No. 284 | November 1, 1909 | 2,336 | 2,279 | +2.5% | 8.34 | 280.1 |
| Oxbow | Town | Enniskillen No. 3 | May 30, 1904 | 1,286 | 1,328 | −3.2% | 3.33 | 386.2 |
| Pense | Town | Pense No. 160 | October 24, 2012 | 603 | 587 | +2.7% | 1.32 | 456.8 |
| Pilot Butte | Town | McLeod No. 185 | November 1, 1980 | 2,638 | 2,137 | +23.4% | 5.71 | 462.0 |
| Ponteix | Town | Grassy Creek No. 78 | April 1, 1957 | 577 | 563 | +2.5% | 1.19 | 484.9 |
| Porcupine Plain | Town | Porcupine No. 395 | January 1, 1968 | 817 | 862 | −5.2% | 2.12 | 385.4 |
| Preeceville | Town | Preeceville No. 334 | November 30, 1946 | 1,062 | 1,125 | −5.6% | 2.86 | 371.3 |
| Qu'Appelle | Town | South Qu'Appelle No. 157 | February 20, 1904 | 625 | 639 | −2.2% | 3.88 | 161.1 |
| Radisson | Town | Great Bend No. 405 | July 1, 1913 | 466 | 514 | −9.3% | 2.07 | 225.1 |
| Radville | Town | Laurier No. 38 | May 1, 1913 | 778 | 807 | −3.6% | 2.95 | 263.7 |
| Raymore | Town | Moose Range No. 486 | August 1, 1963 | 507 | 575 | −11.8% | 2.74 | 185.0 |
| Redvers | Town | Antler No. 61 | July 6, 1960 | 1,008 | 1,042 | −3.3% | 2.90 | 347.6 |
| Regina Beach | Town | Lumsden No. 189 | November 1, 1980 | 1,292 | 1,145 | +12.8% | 3.88 | 333.0 |
| Rocanville | Town | Rocanville No. 151 | August 1, 1967 | 889 | 863 | +3.0% | 2.36 | 376.7 |
| Rockglen | Town | Poplar Valley No. 12 | September 1, 1957 | 399 | 441 | −9.5% | 2.65 | 150.6 |
| Rose Valley | Town | Ponass Lake No. 367 | January 1, 1962 | 256 | 282 | −9.2% | 1.05 | 243.8 |
| Rosetown | Town | St. Andrews No. 287 | November 1, 1911 | 2,507 | 2,451 | +2.3% | 11.59 | 216.3 |
| Rosthern | Town | Rosthern No. 403 | November 20, 1903 | 1,602 | 1,688 | −5.1% | 4.14 | 387.0 |
| Rouleau | Town | Redburn No. 130 | March 1, 1907 | 505 | 540 | −6.5% | 1.54 | 327.9 |
| Saltcoats | Town | Saltcoats No. 213 | November 1, 1910 | 473 | 484 | −2.3% | 1.35 | 350.4 |
| Scott | Town | Tramping Lake No. 380 | November 1, 1910 | 74 | 73 | +1.4% | 4.17 | 17.7 |
| Shaunavon | Town | Grassy Creek No. 78 | November 1, 1914 | 1,784 | 1,714 | +4.1% | 4.80 | 371.7 |
| Shellbrook | Town | Shellbrook No. 493 | April 1, 1948 | 1,510 | 1,444 | +4.6% | 3.93 | 384.2 |
| Sintaluta | Town | Indian Head No. 156 | June 1, 1907 | 124 | 119 | +4.2% | 2.67 | 46.4 |
| Southey | Town | Cupar No. 218 | November 1, 1980 | 832 | 804 | +3.5% | 1.56 | 533.3 |
| Spiritwood | Town | Spiritwood No. 496 | September 1, 1965 | 966 | 913 | +5.8% | 2.91 | 332.0 |
| Springside | Town | St. Philips No. 301 | November 1, 1985 | 478 | 502 | −4.8% | 0.70 | 682.9 |
| St. Brieux | Town | Lake Lenore No. 399 | November 8, 2006 | 638 | 667 | −4.3% | 2.56 | 249.2 |
| St. Walburg | Town | Frenchman Butte No. 501 | February 1, 1953 | 591 | 689 | −14.2% | 2.02 | 292.6 |
| Star City | Town | Star City No. 428 | November 1, 1921 | 374 | 387 | −3.4% | 0.70 | 534.3 |
| Stoughton | Town | Tecumseh No. 65 | June 1, 1960 | 652 | 649 | +0.5% | 3.45 | 189.0 |
| Strasbourg | Town | McKillop No. 220 | July 1, 1907 | 788 | 800 | −1.5% | 5.81 | 135.6 |
| Sturgis | Town | Preeceville No. 334 | March 1, 1951 | 646 | 644 | +0.3% | 3.15 | 205.1 |
| Tisdale | Town | Tisdale No. 427 | November 1, 1920 | 2,962 | 3,235 | −8.4% | 6.56 | 451.5 |
| Turtleford | Town | Mervin No. 499 | July 1, 1983 | 503 | 496 | +1.4% | 1.66 | 303.0 |
| Unity | Town | Round Valley No. 410 | November 1, 1919 | 2,496 | 2,573 | −3.0% | 9.70 | 257.3 |
| Vonda | Town | Grant No. 372 | May 6, 1907 | 384 | 384 | 0.0% | 2.75 | 139.6 |
| Wadena | Town | Lakeview No. 337 | April 1, 1912 | 1,269 | 1,288 | −1.5% | 2.99 | 424.4 |
| Wakaw | Town | Fish Creek No. 402 | August 1, 1953 | 978 | 922 | +6.1% | 3.09 | 316.5 |
| Waldheim | Town | Laird No. 404 | March 1, 1967 | 1,237 | 1,213 | +2.0% | 1.97 | 627.9 |
| Wapella | Town | Martin No. 122 | November 20, 1903 | 278 | 326 | −14.7% | 2.63 | 105.7 |
| Watrous | Town | Morris No. 312 | December 30, 1909 | 1,842 | 1,900 | −3.1% | 11.29 | 163.2 |
| Watson | Town | Lakeside No. 338 | August 1, 1908 | 707 | 697 | +1.4% | 2.96 | 238.9 |
| Wawota | Town | Wawken No. 93 | February 1, 1975 | 555 | 543 | +2.2% | 1.28 | 433.6 |
| White City | Town | Edenwold No. 158 | November 1, 2000 | 3,821[12] | 3,099 | +23.3% | 7.56 | 505.4 |
| Whitewood | Town | Willowdale No. 153 | December 31, 1892 | 944 | 862 | +9.5% | 3.93 | 240.2 |
| Wilkie | Town | Tramping Lake No. 380 | November 1, 1910 | 1,195 | 1,219 | −2.0% | 9.22 | 129.6 |
| Willow Bunch | Town | Willow Bunch No. 42 | October 1, 1960 | 299 | 272 | +9.9% | 0.91 | 328.6 |
| Wolseley | Town | Wolseley No. 155 | October 20, 1898 | 852 | 854 | −0.2% | 5.84 | 145.9 |
| Wynyard | Town | Big Quill No. 308 | November 1, 1911 | 1,724 | 1,798 | −4.1% | 5.32 | 324.1 |
| Yellow Grass | Town | Scott No. 98 | February 15, 1906 | 483 | 478 | +1.0% | 2.67 | 180.9 |
| Zealandia | Town | St. Andrews No. 287 | November 1, 1911 | 75 | 80 | −6.2% | 1.29 | 58.1 |
| Abbey | Village | Miry Creek No. 229 | September 2, 1913 | 100 | 129 | −22.5% | 0.73 | 137.0 |
| Abernethy | Village | Abernethy No. 186 | July 26, 1904 | 190 | 204 | −6.9% | 0.98 | 193.9 |
| Albertville | Village | Wise Creek No. 77 | January 1, 1986 | 121 | 142 | −14.8% | 1.13 | 107.1 |
| Alida | Village | Reciprocity No. 32 | February 19, 1926 | 103 | 120 | −14.2% | 0.38 | 271.1 |
| Alvena | Village | Fish Creek No. 402 | July 1, 1936 | 75 | 60 | +25.0% | 0.43 | 174.4 |
| Annaheim | Village | St. Peter No. 369 | April 1, 1977 | 206 | 210 | −1.9% | 0.70 | 294.3 |
| Archerwill | Village | Barrier Valley No. 397 | January 1, 1947 | 153 | 166 | −7.8% | 0.82 | 186.6 |
| Arran | Village | Livingston No. 331 | September 21, 1916 | 20 | 25 | −20.0% | 0.72 | 27.8 |
| Atwater | Village | Fertile Belt No. 183 | August 12, 1910 | 27 | 30 | −10.0% | 1.84 | 14.7 |
| Avonlea | Village | Elmsthorpe No. 100 | February 10, 1912 | 411 | 393 | +4.6% | 1.30 | 316.2 |
| Aylesbury | Village | Craik No. 222 | March 31, 1910 | 67 | 40 | +67.5% | 1.31 | 51.1 |
| Aylsham | Village | Nipawin No. 487 | August 4, 1947 | 82 | 65 | +26.2% | 0.53 | 154.7 |
| Bangor | Village | Fertile Belt No. 183 | June 8, 1911 | 40 | 38 | +5.3% | 1.57 | 25.5 |
| Beatty | Village | Flett's Springs No. 429 | March 31, 1921 | 65 | 60 | +8.3% | 0.82 | 79.3 |
| Beechy | Village | Victory No. 226 | May 11, 1925 | 209 | 228 | −8.3% | 1.09 | 191.7 |
| Belle Plaine | Village | Pense No. 160 | August 12, 1910 | 79 | 85 | −7.1% | 1.35 | 58.5 |
| Bethune | Village | Dufferin No. 190 | August 2, 1912 | 560 | 399 | +40.4% | 2.38 | 235.3 |
| Bjorkdale | Village | Bjorkdale No. 426 | April 1, 1968 | 147 | 201 | −26.9% | 1.36 | 108.1 |
| Bladworth | Village | McCraney No. 282 | July 27, 1906 | 71 | 65 | +9.2% | 0.87 | 81.6 |
| Borden | Village | Great Bend No. 405 | July 19, 1907 | 281 | 287 | −2.1% | 0.73 | 384.9 |
| Bracken | Village | Lone Tree No. 18 | January 4, 1926 | 20 | 20 | 0.0% | 0.63 | 31.7 |
| Bradwell | Village | Blucher No. 343 | December 26, 1912 | 164 | 166 | −1.2% | 0.42 | 390.5 |
| Briercrest | Village | Redburn No. 130 | April 17, 1912 | 155 | 159 | −2.5% | 0.69 | 224.6 |
| Brock | Village | Kindersley No. 290 | July 7, 1910 | 134 | 142 | −5.6% | 0.70 | 191.4 |
| Broderick | Village | Rudy No. 284 | September 13, 1909 | 96 | 85 | +12.9% | 0.77 | 124.7 |
| Brownlee | Village | Eyebrow No. 193 | December 29, 1908 | 55 | 55 | 0.0% | 2.57 | 21.4 |
| Buchanan | Village | Buchanan No. 304 | June 11, 1907 | 237 | 218 | +8.7% | 1.13 | 209.7 |
| Buena Vista | Village | Lumsden No. 189 | November 18, 1983 | 646 | 612 | +5.6% | 3.63 | 178.0 |
| Bulyea | Village | McKillop No. 220 | March 9, 1909 | 121 | 113 | +7.1% | 1.26 | 96.0 |
| Cadillac | Village | Wise Creek No. 77 | July 2, 1914 | 116 | 92 | +26.1% | 1.16 | 100.0 |
| Calder | Village | Calder No. 241 | January 18, 1911 | 81 | 90 | −10.0% | 0.75 | 108.0 |
| Canwood | Village | Canwood No. 494 | July 18, 1916 | 314 | 332 | −5.4% | 2.42 | 129.8 |
| Carievale | Village | Argyle No. 1 | March 14, 1903 | 244[12] | 240 | +1.7% | 1.51 | 161.6 |
| Caronport | Village | Caron No. 162 | January 1, 1988 | 1,033 | 994 | +3.9% | 1.82 | 567.6 |
| Ceylon | Village | The Gap No. 39 | September 26, 1911 | 97 | 111 | −12.6% | 0.76 | 127.6 |
| Chamberlain | Village | Sarnia No. 221 | January 31, 1911 | 96 | 90 | +6.7% | 0.68 | 141.2 |
| Chaplin | Village | Chaplin No. 164 | October 8, 1912 | 222 | 229 | −3.1% | 1.15 | 193.0 |
| Christopher Lake | Village | Lakeland No. 521 | March 1, 1985 | 302 | 289 | +4.5% | 4.59 | 65.8 |
| Clavet | Village | Blucher No. 343 | July 1, 1978 | 450 | 410 | +9.8% | 0.86 | 523.3 |
| Climax | Village | Lone Tree No. 18 | December 11, 1923 | 137 | 195 | −29.7% | 0.94 | 145.7 |
| Coderre | Village | Rodgers No. 133 | August 26, 1925 | 30 | 30 | 0.0% | 0.85 | 35.3 |
| Codette | Village | Nipawin No. 487 | March 9, 1929 | 180 | 198 | −9.1% | 0.41 | 439.0 |
| Coleville | Village | Oakdale No. 320 | July 1, 1953 | 280 | 305 | −8.2% | 1.66 | 168.7 |
| Conquest | Village | Fertile Valley No. 285 | October 24, 1911 | 167 | 160 | +4.4% | 1.00 | 167.0 |
| Consul | Village | Reno No. 51 | June 12, 1917 | 50 | 73 | −31.5% | 0.70 | 71.4 |
| Craven | Village | Longlaketon No. 219 | April 11, 1905 | 266 | 214 | +24.3% | 1.22 | 218.0 |
| Creelman | Village | Fillmore No. 96 | April 6, 1906 | 103 | 113 | −8.8% | 1.35 | 76.3 |
| Debden | Village | Canwood No. 494 | June 7, 1922 | 327 | 337 | −3.0% | 1.34 | 244.0 |
| Denholm | Village | Mayfield No. 406 | June 25, 1912 | 75 | 88 | −14.8% | 0.35 | 214.3 |
| Denzil | Village | Eye Hill No. 382 | May 3, 1911 | 140 | 143 | −2.1% | 0.61 | 229.5 |
| Dilke | Village | Sarnia No. 221 | December 30, 1912 | 60 | 98 | −38.8% | 1.28 | 46.9 |
| Dinsmore | Village | Milden No. 286 | November 3, 1913 | 267 | 289 | −7.6% | 2.55 | 104.7 |
| Disley | Village | Lumsden No. 189 | June 24, 1907 | 58 | 67 | −13.4% | 0.65 | 89.2 |
| Dodsland | Village | Winslow No. 319 | August 23, 1913 | 215 | 215 | 0.0% | 2.86 | 75.2 |
| Dorintosh | Village | Meadow Lake No. 588 | January 1, 1989 | 107 | 134 | −20.1% | 0.28 | 382.1 |
| Drake | Village | Usborne No. 310 | September 19, 1910 | 197 | 197 | 0.0% | 0.64 | 307.8 |
| Drinkwater | Village | Redburn No. 130 | June 7, 1904 | 74 | 70 | +5.7% | 2.64 | 28.0 |
| Dubuc | Village | Grayson No. 184 | May 29, 1905 | 71 | 61 | +16.4% | 0.61 | 116.4 |
| Duval | Village | Last Mountain Valley No. 250 | December 21, 1910 | 95 | 83 | +14.5% | 0.67 | 141.8 |
| Dysart | Village | Lipton No. 217 | April 6, 1909 | 188 | 200 | −6.0% | 1.19 | 158.0 |
| Earl Grey | Village | Longlaketon No. 219 | July 27, 1906 | 229 | 246 | −6.9% | 1.35 | 169.6 |
| Ebenezer | Village | Orkney No. 244 | July 1, 1948 | 188 | 185 | +1.6% | 0.60 | 313.3 |
| Edam | Village | Turtle River No. 469 | October 12, 1911 | 476 | 485 | −1.9% | 1.14 | 417.5 |
| Edenwold | Village | Edenwold No. 158 | October 3, 1912 | 243 | 233 | +4.3% | 0.69 | 352.2 |
| Elbow | Village | Loreburn No. 254 | April 6, 1909 | 341 | 337 | +1.2% | 3.96 | 86.1 |
| Elfros | Village | Elfros No. 307 | December 1, 1909 | 90 | 90 | 0.0% | 2.48 | 36.3 |
| Endeavour | Village | Preeceville No. 334 | April 29, 1953 | 75 | 65 | +15.4% | 1.00 | 75.0 |
| Englefeld | Village | St. Peter No. 369 | June 13, 1916 | 259 | 285 | −9.1% | 0.66 | 392.4 |
| Ernfold | Village | Morse No. 165 | December 4, 1912 | 20 | 15 | +33.3% | 1.29 | 15.5 |
| Eyebrow | Village | Eyebrow No. 193 | January 8, 1909 | 130 | 119 | +9.2% | 2.52 | 51.6 |
| Fairlight | Village | Maryfield No. 91 | October 5, 1909 | 25 | 40 | −37.5% | 2.58 | 9.7 |
| Fenwood | Village | Stanley No. 215 | June 30, 1909 | 42 | 30 | +40.0% | 1.74 | 24.1 |
| Fillmore | Village | Fillmore No. 96 | June 10, 1905 | 282 | 311 | −9.3% | 1.32 | 213.6 |
| Flaxcombe | Village | Kindersley No. 290 | June 4, 1913 | 134 | 124 | +8.1% | 1.45 | 92.4 |
| Forget | Village | Tecumseh No. 65 | November 21, 1904 | 35 | 55 | −36.4% | 1.37 | 25.5 |
| Fosston | Village | Ponass Lake No. 367 | January 1, 1965 | 40 | 45 | −11.1% | 0.54 | 74.1 |
| Fox Valley | Village | Fox Valley No. 171 | August 30, 1928 | 259 | 249 | +4.0% | 0.70 | 370.0 |
| Frobisher | Village | Coalfields No. 4 | July 4, 1904 | 127 | 160 | −20.6% | 1.43 | 88.8 |
| Frontier | Village | Frontier No. 19 | July 10, 1930 | 364 | 372 | −2.2% | 1.05 | 346.7 |
| Gainsborough | Village | Argyle No. 1 | May 25, 1894 | 227 | 254 | −10.6% | 0.94 | 241.5 |
| Gerald | Village | Spy Hill No. 152 | March 25, 1953 | 129 | 136 | −5.1% | 0.74 | 174.3 |
| Glaslyn | Village | Parkdale No. 498 | April 16, 1929 | 353 | 387 | −8.8% | 1.91 | 184.8 |
| Glen Ewen | Village | Enniskillen No. 3 | March 24, 1904 | 185[12] | 154 | +20.1% | 2.59 | 71.4 |
| Glenavon | Village | Chester No. 125 | April 13, 1910 | 179 | 182 | −1.6% | 1.29 | 138.8 |
| Glenside | Village | Rudy No. 284 | March 30, 1911 | 73 | 76 | −3.9% | 0.78 | 93.6 |
| Golden Prairie | Village | Big Stick No. 141 | April 15, 1942 | 30 | 30 | 0.0% | 0.48 | 62.5 |
| Goodeve | Village | Stanley No. 215 | August 18, 1910 | 40 | 40 | 0.0% | 2.38 | 16.8 |
| Goodsoil | Village | Beaver River No. 622 | January 1, 1960 | 301 | 282 | +6.7% | 1.78 | 169.1 |
| Goodwater | Village | Lomond No. 37 | May 8, 1911 | 40 | 30 | +33.3% | 0.56 | 71.4 |
| Grayson | Village | Grayson No. 184 | April 19, 1906 | 185 | 211 | −12.3% | 1.79 | 103.4 |
| Halbrite | Village | Cymri No. 36 | February 26, 1904 | 110 | 119 | −7.6% | 1.10 | 100.0 |
| Harris | Village | Harris No. 316 | August 10, 1909 | 190 | 193 | −1.6% | 0.89 | 213.5 |
| Hawarden | Village | Loreburn No. 254 | July 16, 1909 | 50 | 52 | −3.8% | 1.12 | 44.6 |
| Hazenmore | Village | Pinto Creek No. 75 | August 20, 1913 | 75 | 65 | +15.4% | 0.68 | 110.3 |
| Hazlet | Village | Pittville No. 169 | January 1, 1963 | 90 | 106 | −15.1% | 0.55 | 163.6 |
| Heward | Village | Tecumseh No. 65 | November 21, 1904 | 30 | 44 | −31.8% | 0.92 | 32.6 |
| Hodgeville | Village | Lawtonia No. 135 | June 22, 1921 | 147 | 172 | −14.5% | 1.24 | 118.5 |
| Holdfast | Village | Sarnia No. 221 | October 5, 1911 | 173 | 247 | −30.0% | 1.32 | 131.1 |
| Hubbard | Village | Ituna Bon Accord No. 246 | June 11, 1910 | 45 | 35 | +28.6% | 1.07 | 42.1 |
| Hyas | Village | Clayton No. 333 | May 23, 1919 | 89 | 65 | +36.9% | 0.41 | 217.1 |
| Invermay | Village | Invermay No. 305 | September 1, 1908 | 272 | 273 | −0.4% | 1.20 | 226.7 |
| Jansen | Village | Wolverine No. 340 | October 19, 1908 | 111 | 96 | +15.6% | 0.87 | 127.6 |
| Kelliher | Village | Kellross No. 247 | April 27, 1909 | 244 | 217 | +12.4% | 2.57 | 94.9 |
| Kenaston | Village | McCraney No. 282 | July 18, 1910 | 292 | 282 | +3.5% | 1.14 | 256.1 |
| Kendal | Village | Montmartre No. 126 | February 17, 1919 | 59 | 83 | −28.9% | 0.62 | 95.2 |
| Kennedy | Village | Wawken No. 93 | November 5, 1907 | 232 | 216 | +7.4% | 1.57 | 147.8 |
| Kenosee Lake | Village | Wawken No. 93 | October 1, 1987 | 236 | 234 | +0.9% | 0.40 | 590.0 |
| Killaly | Village | McLeod No. 185 | April 28, 1909 | 58 | 65 | −10.8% | 2.64 | 22.0 |
| Kincaid | Village | Pinto Creek No. 75 | July 19, 1913 | 120 | 111 | +8.1% | 0.54 | 222.2 |
| Kinley | Village | Perdue No. 346 | January 7, 1909 | 60 | 60 | 0.0% | 1.18 | 50.8 |
| Kisbey | Village | Brock No. 64 | May 8, 1907 | 158 | 153 | +3.3% | 2.69 | 58.7 |
| Krydor | Village | Redberry No. 435 | August 25, 1914 | 15 | 15 | 0.0% | 0.94 | 16.0 |
| Laird | Village | Rosthern No. 403 | May 4, 1911 | 265 | 267 | −0.7% | 1.23 | 215.4 |
| Lake Lenore | Village | Lake Lenore No. 399 | April 28, 1921 | 289 | 284 | +1.8% | 0.97 | 297.9 |
| Lancer | Village | Miry Creek No. 229 | September 11, 1913 | 58 | 69 | −15.9% | 1.32 | 43.9 |
| Landis | Village | Reford No. 379 | May 17, 1909 | 133 | 152 | −12.5% | 0.84 | 158.3 |
| Lang | Village | Scott No. 98 | July 27, 1906 | 176 | 189 | −6.9% | 0.65 | 270.8 |
| Leask | Village | Leask No. 464 | September 3, 1912 | 379 | 399 | −5.0% | 0.73 | 519.2 |
| Lebret | Village | North Qu'Appelle No. 187 | October 14, 1912 | 226 | 221 | +2.3% | 1.24 | 182.3 |
| Leoville | Village | Spiritwood No. 496 | June 26, 1944 | 364 | 375 | −2.9% | 1.14 | 319.3 |
| Leross | Village | Kellross No. 247 | December 1, 1909 | 40 | 46 | −13.0% | 1.28 | 31.3 |
| Liberty | Village | Big Arm No. 251 | January 23, 1912 | 68 | 78 | −12.8% | 1.42 | 47.9 |
| Limerick | Village | Stonehenge No. 73 | July 10, 1913 | 114 | 115 | −0.9% | 0.61 | 186.9 |
| Lintlaw | Village | Hazel Dell No. 335 | December 14, 1921 | 150 | 172 | −12.8% | 1.24 | 121.0 |
| Lipton | Village | Lipton No. 217 | May 15, 1905 | 284 | 345 | −17.7% | 0.70 | 405.7 |
| Loon Lake | Village | Loon Lake No. 561 | January 1, 1950 | 281 | 288 | −2.4% | 0.74 | 379.7 |
| Loreburn | Village | Loreburn No. 254 | May 20, 1909 | 100 | 107 | −6.5% | 0.56 | 178.6 |
| Love | Village | Torch River No. 488 | June 2, 1945 | 50 | 50 | 0.0% | 0.40 | 125.0 |
| Lucky Lake | Village | Canaan No. 225 | November 23, 1920 | 270 | 289 | −6.6% | 0.82 | 329.3 |
| MacNutt | Village | Churchbridge No. 211 | February 22, 1913 | 50 | 65 | −23.1% | 0.92 | 54.3 |
| Macoun | Village | Cymri No. 36 | October 16, 1903 | 272 | 269 | +1.1% | 1.70 | 160.0 |
| Macrorie | Village | Fertile Valley No. 285 | February 8, 1912 | 65 | 68 | −4.4% | 0.72 | 90.3 |
| Major | Village | Prairiedale No. 321 | September 29, 1914 | 35 | 35 | 0.0% | 2.60 | 13.5 |
| Makwa | Village | Loon Lake No. 561 | June 1, 1965 | 78 | 84 | −7.1% | 0.58 | 134.5 |
| Mankota | Village | Mankota No. 45 | February 3, 1941 | 198 | 205 | −3.4% | 1.50 | 132.0 |
| Manor | Village | Moose Mountain No. 63 | April 15, 1902 | 305 | 295 | +3.4% | 2.58 | 118.2 |
| Marcelin | Village | Blaine Lake No. 434 | September 25, 1911 | 142 | 153 | −7.2% | 1.29 | 110.1 |
| Marengo | Village | Milton No. 292 | November 5, 1910 | 75 | 67 | +11.9% | 0.89 | 84.3 |
| Margo | Village | Sasman No. 336 | April 24, 1911 | 65 | 83 | −21.7% | 0.71 | 91.5 |
| Markinch | Village | Cupar No. 218 | February 16, 1911 | 55 | 58 | −5.2% | 0.68 | 80.9 |
| Marquis | Village | Marquis No. 191 | March 21, 1910 | 90 | 97 | −7.2% | 0.63 | 142.9 |
| Marsden | Village | Manitou Lake No. 442 | April 24, 1931 | 281 | 297 | −5.4% | 0.79 | 355.7 |
| Maryfield | Village | Maryfield No. 91 | August 21, 1907 | 311 | 348 | −10.6% | 2.57 | 121.0 |
| Maymont | Village | Mayfield No. 406 | June 24, 1907 | 163 | 138 | +18.1% | 0.54 | 301.9 |
| McLean | Village | South Qu'Appelle No. 157 | September 1, 1966 | 392 | 405 | −3.2% | 1.32 | 297.0 |
| McTaggart | Village | Weyburn No. 67 | October 5, 1909 | 125 | 121 | +3.3% | 0.75 | 166.7 |
| Meacham | Village | Colonsay No. 342 | June 19, 1912 | 96 | 99 | −3.0% | 1.26 | 76.2 |
| Meath Park | Village | Garden River No. 490 | May 23, 1938 | 169 | 175 | −3.4% | 0.53 | 318.9 |
| Medstead | Village | Medstead No. 497 | April 23, 1931 | 121 | 130 | −6.9% | 0.65 | 186.2 |
| Mendham | Village | Happyland No. 231 | April 1, 1930 | 25 | 30 | −16.7% | 0.59 | 42.4 |
| Meota | Village | Meota No. 468 | July 6, 1911 | 325 | 304 | +6.9% | 1.61 | 201.9 |
| Mervin | Village | Mervin No. 499 | March 17, 1920 | 159 | 159 | 0.0% | 0.69 | 230.4 |
| Middle Lake | Village | Three Lakes No. 400 | January 1, 1963 | 188 | 241 | −22.0% | 1.02 | 184.3 |
| Milden | Village | Milden No. 286 | July 20, 1911 | 153 | 167 | −8.4% | 0.96 | 159.4 |
| Minton | Village | Surprise Valley No. 9 | January 1, 1951 | 50 | 55 | −9.1% | 0.25 | 200.0 |
| Mistatim | Village | Bjorkdale No. 426 | July 1, 1952 | 30 | 101 | −70.3% | 0.51 | 58.8 |
| Montmartre | Village | Montmartre No. 126 | October 19, 1908 | 450 | 490 | −8.2% | 1.69 | 266.3 |
| Mortlach | Village | Wheatlands No. 163 | January 1, 1949 | 274 | 261 | +5.0% | 2.87 | 95.5 |
| Muenster | Village | St. Peter No. 369 | August 18, 1908 | 403 | 430 | −6.3% | 1.36 | 296.3 |
| Neilburg | Village | Hillsdale No. 440 | January 1, 1947 | 371 | 379 | −2.1% | 1.24 | 299.2 |
| Netherhill | Village | Kindersley No. 290 | April 28, 1910 | 25 | 25 | 0.0% | 0.77 | 32.5 |
| Neudorf | Village | McLeod No. 185 | April 25, 1905 | 272 | 263 | +3.4% | 1.94 | 140.2 |
| Neville | Village | Whiska Creek No. 106 | July 5, 1912 | 88 | 87 | +1.1% | 0.96 | 91.7 |
| North Portal | Village | Coalfields No. 4 | November 16, 1903 | 113 | 115 | −1.7% | 2.65 | 42.6 |
| Odessa | Village | Francis No. 127 | March 14, 1911 | 220 | 205 | +7.3% | 1.08 | 203.7 |
| Osage | Village | Fillmore No. 96 | May 8, 1906 | 25 | 20 | +25.0% | 0.62 | 40.3 |
| Paddockwood | Village | Paddockwood No. 520 | January 1, 1949 | 118 | 154 | −23.4% | 0.65 | 181.5 |
| Pangman | Village | Norton No. 69 | May 17, 1911 | 238 | 232 | +2.6% | 0.73 | 326.0 |
| Paradise Hill | Village | Frenchman Butte No. 501 | January 1, 1947 | 471 | 491 | −4.1% | 2.28 | 206.6 |
| Parkside | Village | Leask No. 464 | February 21, 1913 | 132 | 121 | +9.1% | 0.72 | 183.3 |
| Paynton | Village | Paynton No. 470 | May 2, 1907 | 120 | 148 | −18.9% | 0.82 | 146.3 |
| Pelly | Village | St. Philips No. 301 | May 4, 1911 | 255 | 285 | −10.5% | 0.96 | 265.6 |
| Pennant | Village | Riverside No. 168 | July 29, 1912 | 120 | 130 | −7.7% | 0.65 | 184.6 |
| Perdue | Village | Perdue No. 346 | July 15, 1909 | 313 | 334 | −6.3% | 1.03 | 303.9 |
| Pierceland | Village | Beaver River No. 622 | January 1, 1973 | 605 | 598 | +1.2% | 2.74 | 220.8 |
| Pilger | Village | Three Lakes No. 400 | January 1, 1969 | 65 | 65 | 0.0% | 0.49 | 132.7 |
| Pleasantdale | Village | Pleasantdale No. 398 | January 1, 1987 | 80 | 76 | +5.3% | 0.53 | 150.9 |
| Plenty | Village | Winslow No. 319 | March 25, 1911 | 128 | 164 | −22.0% | 0.61 | 209.8 |
| Plunkett | Village | Viscount No. 341 | December 28, 1921 | 60 | 60 | 0.0% | 0.67 | 89.6 |
| Prelate | Village | Happyland No. 231 | October 25, 1913 | 116 | 154 | −24.7% | 0.82 | 141.5 |
| Prud'homme | Village | Bayne No. 371 | November 15, 1922 | 177 | 167 | +6.0% | 0.79 | 224.1 |
| Punnichy | Village | Mount Hope No. 279 | October 22, 1909 | 212 | 213 | −0.5% | 0.68 | 311.8 |
| Quill Lake | Village | Lakeside No. 338 | December 8, 1906 | 377 | 387 | −2.6% | 1.32 | 285.6 |
| Quinton | Village | Mount Hope No. 279 | March 1, 1910 | 89 | 101 | −11.9% | 0.97 | 91.8 |
| Rama | Village | Invermay No. 305 | December 18, 1919 | 70 | 80 | −12.5% | 0.67 | 104.5 |
| Rhein | Village | Wallace No. 243 | March 10, 1913 | 149 | 170 | −12.4% | 1.08 | 138.0 |
| Richard | Village | Douglas No. 436 | October 11, 1916 | 25 | 20 | +25.0% | 0.72 | 34.7 |
| Richmound | Village | Enterprise No. 142 | May 5, 1947 | 118 | 147 | −19.7% | 0.48 | 245.8 |
| Ridgedale | Village | Connaught No. 457 | December 15, 1921 | 65 | 55 | +18.2% | 0.65 | 100.0 |
| Riverhurst | Village | Maple Bush No. 224 | June 22, 1916 | 152 | 130 | +16.9% | 1.01 | 150.5 |
| Roche Percee | Village | Coalfields No. 4 | January 12, 1909 | 75 | 110 | −31.8% | 2.87 | 26.1 |
| Ruddell | Village | Mayfield No. 406 | March 18, 1914 | 20 | 20 | 0.0% | 0.47 | 42.6 |
| Rush Lake | Village | Excelsior No. 166 | October 16, 1911 | 55 | 53 | +3.8% | 0.70 | 78.6 |
| Sceptre | Village | Clinworth No. 230 | April 30, 1913 | 78 | 94 | −17.0% | 1.33 | 58.6 |
| Sedley | Village | Francis No. 127 | August 3, 1907 | 367 | 358 | +2.5% | 1.34 | 273.9 |
| Semans | Village | Mount Hope No. 279 | December 14, 1908 | 180 | 196 | −8.2% | 1.08 | 166.7 |
| Senlac | Village | Senlac No. 411 | October 11, 1916 | 36 | 41 | −12.2% | 0.66 | 54.5 |
| Shamrock | Village | Shamrock No. 134 | January 1, 1960 | 20 | 20 | 0.0% | 0.79 | 25.3 |
| Sheho | Village | Insinger No. 275 | June 30, 1905 | 122 | 105 | +16.2% | 1.88 | 64.9 |
| Shell Lake | Village | Spiritwood No. 496 | October 18, 1940 | 189 | 175 | +8.0% | 1.39 | 136.0 |
| Silton | Village | McKillop No. 220 | July 2, 1914 | 95 | 71 | +33.8% | 1.06 | 89.6 |
| Simpson | Village | Wood Creek No. 281 | July 11, 1911 | 131 | 127 | +3.1% | 1.57 | 83.4 |
| Smeaton | Village | Torch River No. 488 | March 7, 1944 | 163 | 182 | −10.4% | 1.46 | 111.6 |
| Smiley | Village | Prairiedale No. 321 | November 26, 1913 | 25 | 60 | −58.3% | 0.62 | 40.3 |
| Spalding | Village | Spalding No. 368 | March 11, 1924 | 213 | 244 | −12.7% | 1.19 | 179.0 |
| Speers | Village | Douglas No. 436 | December 24, 1915 | 72 | 60 | +20.0% | 0.68 | 105.9 |
| Spy Hill | Village | Spy Hill No. 152 | April 22, 1910 | 173 | 168 | +3.0% | 1.15 | 150.4 |
| St. Benedict | Village | Three Lakes No. 400 | January 1, 1964 | 80 | 84 | −4.8% | 0.55 | 145.5 |
| St. Gregor | Village | St. Peter No. 369 | March 26, 1920 | 104 | 97 | +7.2% | 0.84 | 123.8 |
| St. Louis | Village | St. Louis No. 431 | May 19, 1959 | 432 | 415 | +4.1% | 0.97 | 445.4 |
| Stenen | Village | Clayton No. 333 | August 14, 1912 | 89 | 90 | −1.1% | 0.71 | 125.4 |
| Stewart Valley | Village | Saskatchewan Landing No. 167 | January 1, 1958 | 107 | 91 | +17.6% | 0.86 | 124.4 |
| Stockholm | Village | Fertile Belt No. 183 | June 30, 1905 | 329 | 352 | −6.5% | 1.63 | 201.8 |
| Storthoaks | Village | Storthoaks No. 31 | June 5, 1940 | 86 | 108 | −20.4% | 0.45 | 191.1 |
| Strongfield | Village | Loreburn No. 254 | May 3, 1912 | 55 | 40 | +37.5% | 0.65 | 84.6 |
| Success | Village | Riverside No. 168 | October 25, 1912 | 45 | 45 | 0.0% | 1.36 | 33.1 |
| Tantallon | Village | Spy Hill No. 152 | June 17, 1904 | 84 | 91 | −7.7% | 0.84 | 100.0 |
| Tessier | Village | Harris No. 316 | August 24, 1909 | 25 | 25 | 0.0% | 1.00 | 25.0 |
| Theodore | Village | Insinger No. 275 | July 5, 1907 | 315 | 323 | −2.5% | 1.51 | 208.6 |
| Togo | Village | Cote No. 271 | September 4, 1906 | 83 | 86 | −3.5% | 1.44 | 57.6 |
| Tompkins | Village | Gull Lake No. 139 | June 2, 1910 | 153 | 152 | +0.7% | 2.68 | 57.1 |
| Torquay | Village | Cambria No. 6 | December 11, 1923 | 215 | 255 | −15.7% | 1.35 | 159.3 |
| Tramping Lake | Village | Tramping Lake No. 380 | April 10, 1917 | 35 | 60 | −41.7% | 1.27 | 27.6 |
| Tugaske | Village | Huron No. 223 | May 7, 1909 | 79 | 75 | +5.3% | 0.75 | 105.3 |
| Tuxford | Village | Marquis No. 191 | July 19, 1907 | 103 | 113 | −8.8% | 0.68 | 151.5 |
| Val Marie | Village | Val Marie No. 17 | September 13, 1926 | 120 | 126 | −4.8% | 0.43 | 279.1 |
| Valparaiso | Village | Star City No. 428 | July 18, 1924 | 25 | 15 | +66.7% | 0.74 | 33.8 |
| Vanguard | Village | Whiska Creek No. 106 | July 8, 1912 | 184 | 134 | +37.3% | 1.86 | 98.9 |
| Vanscoy | Village | Vanscoy No. 345 | June 17, 1919 | 477 | 462 | +3.2% | 2.47 | 193.1 |
| Vibank | Village | Francis No. 127 | June 23, 1911 | 386 | 385 | +0.3% | 0.71 | 543.7 |
| Viscount | Village | Viscount No. 341 | December 17, 1908 | 282 | 232 | +21.6% | 1.49 | 189.3 |
| Waldeck | Village | Excelsior No. 166 | December 23, 1913 | 294 | 277 | +6.1% | 1.99 | 147.7 |
| Waldron | Village | Grayson No. 184 | July 17, 1909 | 15 | 15 | 0.0% | 1.38 | 10.9 |
| Waseca | Village | Eldon No. 471 | March 15, 1911 | 113 | 149 | −24.2% | 0.65 | 173.8 |
| Webb | Village | Webb No. 138 | June 18, 1910 | 71 | 50 | +42.0% | 1.23 | 57.7 |
| Weekes | Village | Porcupine No. 395 | January 13, 1947 | 50 | 40 | +25.0% | 0.53 | 94.3 |
| Weirdale | Village | Garden River No. 490 | April 1, 1948 | 55 | 50 | +10.0% | 1.20 | 45.8 |
| Weldon | Village | Kinistino No. 459 | January 24, 1914 | 160 | 197 | −18.8% | 1 | 160.0 |
| White Fox | Village | Torch River No. 488 | July 21, 1941 | 343 | 355 | −3.4% | 0.99 | 346.5 |
| Wilcox | Village | Bratt's Lake No. 129 | April 20, 1907 | 261 | 264 | −1.1% | 1.43 | 182.5 |
| Windthorst | Village | Chester No. 125 | August 21, 1907 | 194 | 211 | −8.1% | 1.34 | 144.8 |
| Wiseton | Village | Milden No. 286 | September 23, 1913 | 64 | 79 | −19.0% | 0.71 | 90.1 |
| Wood Mountain | Village | Old Post No. 43 | March 4, 1930 | 20 | 20 | 0.0% | 0.61 | 32.8 |
| Yarbo | Village | Langenburg No. 181 | July 1, 1964 | 48 | 57 | −15.8% | 0.76 | 63.2 |
| Young | Village | Morris No. 312 | June 7, 1910 | 253 | 244 | +3.7% | 2.54 | 99.6 |
| Zelma | Village | Bayne No. 371 | August 10, 1910 | 28 | 35 | −20.0% | 0.71 | 39.4 |
| Zenon Park | Village | Arborfield No. 456 | July 28, 1941 | 176 | 194 | −9.3% | 0.53 | 332.1 |
| Alice Beach | Resort village | Sarnia No. 221 | July 1, 1983 | 82 | 51 | +60.8% | 0.71 | 115.5 |
| Aquadeo | Resort village | Meota No. 468 | January 1, 1988 | 203 | 111 | +82.9% | 0.70 | 290.0 |
| Beaver Flat | Resort village | Excelsior No. 166 | April 1, 1981 | 82 | 72 | +13.9% | 0.89 | 92.1 |
| Big Shell | Resort village | Spiritwood No. 496 | August 1, 1982 | 64 | 48 | +33.3% | 0.93 | 68.8 |
| Bird's Point | Resort village | Fertile Belt No. 183 | September 1, 1981 | 150 | 112 | +33.9% | 0.59 | 254.2 |
| B-Say-Tah | Resort village | North Qu'Appelle No. 187 | August 6, 1915 | 177 | 156 | +13.5% | 1.02 | 173.5 |
| Candle Lake | Resort village | Paddockwood No. 520 | August 1, 1977 | 1,160 | 840 | +38.1% | 62.93 | 18.4 |
| Chitek Lake | Resort village | Big River No. 555 | July 1, 1978 | 300 | 138 | +117.4% | 2.57 | 116.7 |
| Chorney Beach | Resort village | Foam Lake No. 276 | January 1, 1991 | 51 | 42 | +21.4% | 0.23 | 221.7 |
| Cochin | Resort village | Meota No. 468 | January 1, 1988 | 219 | 148 | +48.0% | 1.32 | 165.9 |
| Coteau Beach | Resort village | Coteau No. 255 | August 1, 1982 | 170 | 48 | +254.2% | 0.70 | 242.9 |
| Echo Bay | Resort village | Spiritwood No. 496 | August 1, 1982 | 68 | 40 | +70.0% | 0.74 | 91.9 |
| Etters Beach | Resort village | Big Arm No. 251 | October 1, 1965 | 40 | 30 | +33.3% | 0.26 | 153.8 |
| Fort San | Resort village | North Qu'Appelle No. 187 | September 1, 1987 | 233 | 222 | +5.0% | 2.55 | 91.4 |
| Glen Harbour | Resort village | McKillop No. 220 | July 1, 1986 | 91 | 67 | +35.8% | 0.35 | 260.0 |
| Grandview Beach | Resort village | Sarnia No. 221 | July 4, 1960 | 118 | 35 | +237.1% | 0.25 | 472.0 |
| Greig Lake | Resort village | Meadow Lake No. 588 | January 1, 1983 | 24 | 10 | +140.0% | 0.10 | 240.0 |
| Island View | Resort village | McKillop No. 220 | January 1, 1994 | 134 | 74 | +81.1% | 0.45 | 297.8 |
| Kannata Valley | Resort village | Longlaketon No. 219 | September 1, 1966 | 126 | 88 | +43.2% | 0.63 | 200.0 |
| Katepwa | Resort village | Abernethy No. 186 | July 24, 2004 | 539 | 312 | +72.8% | 4.49 | 120.0 |
| Kivimaa-Moonlight Bay | Resort village | Mervin No. 499 | January 1, 1989 | 137 | 84 | +63.1% | 0.57 | 240.4 |
| Leslie Beach | Resort village | Foam Lake No. 276 | July 1, 1999 | 110 | 41 | +168.3% | 0.66 | 166.7 |
| Lumsden Beach | Resort village | Lumsden No. 189 | July 22, 1918 | 20[12] | 10 | +100.0% | 0.46 | 43.5 |
| Manitou Beach | Resort village | Morris No. 312 | August 11, 1919 | 364 | 314 | +15.9% | 2.28 | 159.6 |
| Melville Beach | Resort village | Grayson No. 184 | July 1, 1983 | 54 | 19 | +184.2% | 0.11 | 490.9 |
| Metinota | Resort village | Meota No. 468 | August 19, 1924 | 86 | 80 | +7.5% | 0.46 | 187.0 |
| Mistusinne | Resort village | Maple Bush No. 224 | August 1, 1980 | 118 | 77 | +53.2% | 1.92 | 61.5 |
| North Grove | Resort village | Dufferin No. 190 | January 1, 1989 | 175 | 132 | +32.6% | 3.72 | 47.0 |
| Pebble Baye | Resort village | Leask No. 464 | January 1, 1983 | 69 | 45 | +53.3% | 0.68 | 101.5 |
| Pelican Pointe | Resort village | McKillop No. 220 | January 1, 1987 | 38 | 28 | +35.7% | 0.12 | 316.7 |
| Saskatchewan Beach | Resort village | McKillop No. 220 | June 16, 1919 | 322 | 258 | +24.8% | 1.57 | 205.1 |
| Shields | Resort village | Dundurn No. 314 | January 1, 1981 | 351 | 288 | +21.9% | 0.75 | 468.0 |
| South Lake | Resort village | Marquis No. 191 | January 1, 1989 | 226 | 169 | +33.7% | 4.95 | 45.7 |
| Sun Valley | Resort village | Marquis No. 191 | January 1, 1985 | 154 | 118 | +30.5% | 2.03 | 75.9 |
| Sunset Cove | Resort village | McKillop No. 220 | January 1, 1983 | 21 | 18 | +16.7% | 0.17 | 123.5 |
| Thode | Resort village | Dundurn No. 314 | January 1, 1981 | 163 | 157 | +3.8% | 0.72 | 226.4 |
| Tobin Lake | Resort village | Moose Range No. 486 | August 1, 1973 | 139 | 89 | +56.2% | 2.29 | 60.7 |
| Turtle View | Resort village | Parkdale No. 498 | January 1, 2020 | NA | ||||
| Wakaw Lake | Resort village | Hoodoo No. 401 | October 21, 1959 | 66 | 72 | −8.3% | 0.61 | 108.2 |
| Wee Too Beach | Resort village | Sarnia No. 221 | January 1, 1986 | 75 | 79 | −5.1% | 0.17 | 441.2 |
| West End | Resort village | Fertile Belt No. 183 | June 15, 1983 | 41 | 37 | +10.8% | 0.37 | 110.8 |
| Sub-total cities | 689,475 | 656,168 | +5.1% | 776.63 | 887.8 | |||
| Sub-total towns | 145,995 | 146,488 | −0.3% | 512.52 | 284.9 | |||
| Sub-total villages | 40,447 | 41,424 | −2.4% | 288.17 | 140.4 | |||
| Sub-total resort villages | 6,578 | 4,571 | +43.9% | 105.87 | 62.1 | |||
| Total urban municipalities | 882,677 | 848,839 | +4.0% | 1,684.34 | 524.0 | |||
Rural municipalities
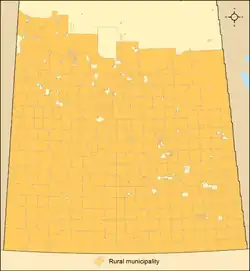
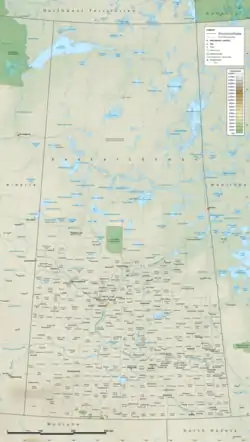
A rural municipality (RM) can be created by Saskatchewan's Minister of Municipal Relations by ministerial order via section 49 of The Municipalities Act.[6] Saskatchewan has 296 rural municipalities, which are located in the central and southern portions of the province.[2][13] The largest and smallest rural municipalities by population are the RM of Corman Park No. 344 and the RM of Glen McPherson No. 46 with 8,909 and 76.[3] The largest and smallest rural municipalities by land area are the RM of Hudson Bay No. 394 and the RM of Hillsborough No. 132 with 12,399.12 km2 (4,787.33 sq mi) and 434.18 km2 (167.64 sq mi).[3]
| Name[10] | Incorporation date[14] |
2021 Census of Population[3] | ||||
|---|---|---|---|---|---|---|
| Population (2021) |
Population (2016) |
Change |
Land area (km2) |
Population density (/km2) | ||
| Aberdeen No. 373 | December 13, 1909 | 1,461 | 1,379 | +5.9% | 671.82 | 2.2 |
| Abernethy No. 186 | December 11, 1911 | 337 | 362 | −6.9% | 763.11 | 0.4 |
| Antelope Park No. 322 | December 11, 1911 | 124 | 130 | −4.6% | 609.52 | 0.2 |
| Antler No. 61 | December 13, 1909 | 451 | 523 | −13.8% | 804.28 | 0.6 |
| Arborfield No. 456 | January 1, 1913 | 338 | 343 | −1.5% | 1,403.77 | 0.2 |
| Argyle No. 1 | December 19, 1912 | 245[12] | 290 | −15.5% | 567.05 | 0.4 |
| Arlington No. 79 | January 1, 1913 | 359 | 366 | −1.9% | 841.62 | 0.4 |
| Arm River No. 252 | December 13, 1909 | 258 | 250 | +3.2% | 721.58 | 0.4 |
| Auvergne No. 76 | January 1, 1913 | 381 | 412 | −7.5% | 846.86 | 0.4 |
| Baildon No. 131 | December 9, 1912 | 583 | 620 | −6.0% | 829.56 | 0.7 |
| Barrier Valley No. 397 | October 29, 1917 | 485 | 431 | +12.5% | 817.93 | 0.6 |
| Battle River No. 438 | December 12, 1910 | 1,029 | 1,074 | −4.2% | 1,056.77 | 1.0 |
| Bayne No. 371 | December 12, 1910 | 461 | 467 | −1.3% | 788.95 | 0.6 |
| Beaver River No. 622 | January 1, 1978 | 1,277 | 1,216 | +5.0% | 2,356.32 | 0.5 |
| Bengough No. 40 | January 1, 1913 | 305 | 281 | +8.5% | 1,008.64 | 0.3 |
| Benson No. 35 | December 13, 1909 | 450 | 472 | −4.7% | 808.53 | 0.6 |
| Big Arm No. 251 | December 11, 1911 | 184 | 191 | −3.7% | 689.35 | 0.3 |
| Big Quill No. 308 | December 13, 1909 | 520 | 534 | −2.6% | 730.34 | 0.7 |
| Big River No. 555 | October 1, 1977 | 994 | 889 | +11.8% | 2,484.13 | 0.4 |
| Big Stick No. 141 | December 11, 1911 | 148 | 136 | +8.8% | 831.87 | 0.2 |
| Biggar No. 347 | December 11, 1911 | 805 | 798 | +0.9% | 1,576.09 | 0.5 |
| Birch Hills No. 460 | December 11, 1911 | 658 | 656 | +0.3% | 547.08 | 1.2 |
| Bjorkdale No. 426 | January 1, 1913 | 906 | 851 | +6.5% | 1,438.66 | 0.6 |
| Blaine Lake No. 434 | December 9, 1912 | 301 | 281 | +7.1% | 771.86 | 0.4 |
| Blucher No. 343 | December 13, 1909 | 1,984 | 2,006 | −1.1% | 789.40 | 2.5 |
| Bone Creek No. 108 | December 11, 1911 | 362 | 394 | −8.1% | 834.81 | 0.4 |
| Bratt's Lake No. 129 | January 1, 1913 | 328 | 315 | +4.1% | 844.71 | 0.4 |
| Britannia No. 502 | December 13, 1909 | 2,061 | 2,153 | −4.3% | 915.11 | 2.3 |
| Brock No. 64 | December 12, 1910 | 252 | 267 | −5.6% | 784.64 | 0.3 |
| Brokenshell No. 68 | December 13, 1909 | 307 | 312 | −1.6% | 845.97 | 0.4 |
| Browning No. 34 | December 11, 1911 | 355 | 375 | −5.3% | 797.00 | 0.4 |
| Buchanan No. 304 | January 1, 1913 | 330 | 270 | +22.2% | 708.27 | 0.5 |
| Buckland No. 491 | December 11, 1911 | 3,277 | 3,375 | −2.9% | 787.35 | 4.2 |
| Buffalo No. 409 | December 13, 1909 | 420 | 506 | −17.0% | 1,204.97 | 0.3 |
| Calder No. 241 | January 1, 1913 | 344 | 370 | −7.0% | 790.93 | 0.4 |
| Caledonia No. 99 | December 13, 1909 | 225 | 245 | −8.2% | 846.76 | 0.3 |
| Cambria No. 6 | December 13, 1909 | 277 | 309 | −10.4% | 813.31 | 0.3 |
| Cana No. 214 | December 13, 1909 | 904 | 867 | +4.3% | 813.42 | 1.1 |
| Canaan No. 225 | January 1, 1913 | 145 | 140 | +3.6% | 549.95 | 0.3 |
| Canwood No. 494 | January 1, 1913 | 1,351 | 1,381 | −2.2% | 1,919.39 | 0.7 |
| Carmichael No. 109 | December 9, 1912 | 462 | 502 | −8.0% | 839.45 | 0.6 |
| Caron No. 162 | December 9, 1912 | 603 | 576 | +4.7% | 566.74 | 1.1 |
| Chaplin No. 164 | January 1, 1913 | 127 | 113 | +12.4% | 837.96 | 0.2 |
| Chester No. 125 | December 13, 1909 | 333 | 383 | −13.1% | 817.66 | 0.4 |
| Chesterfield No. 261 | December 9, 1912 | 419 | 481 | −12.9% | 1,962.21 | 0.2 |
| Churchbridge No. 211 | January 1, 1913 | 584 | 619 | −5.7% | 899.13 | 0.6 |
| Clayton No. 333 | January 1, 1913 | 631 | 597 | +5.7% | 1,380.68 | 0.5 |
| Clinworth No. 230 | December 9, 1912 | 168 | 154 | +9.1% | 1,436.33 | 0.1 |
| Coalfields No. 4 | January 1, 1913 | 330 | 368 | −10.3% | 818.16 | 0.4 |
| Colonsay No. 342 | December 13, 1909 | 260 | 269 | −3.3% | 548.46 | 0.5 |
| Connaught No. 457 | December 11, 1911 | 491 | 586 | −16.2% | 848.82 | 0.6 |
| Corman Park No. 344 | January 1, 1970 | 8,909 | 8,558 | +4.1% | 1,893.24 | 4.7 |
| Cote No. 271 | December 12, 1910 | 616 | 548 | +12.4% | 871.02 | 0.7 |
| Coteau No. 255 | December 12, 1910 | 401 | 475 | −15.6% | 895.72 | 0.4 |
| Coulee No. 136 | December 12, 1910 | 669 | 563 | +18.8% | 840.54 | 0.8 |
| Craik No. 222 | December 9, 1912 | 272 | 259 | +5.0% | 868.48 | 0.3 |
| Cupar No. 218 | December 13, 1909 | 516 | 503 | +2.6% | 905.53 | 0.6 |
| Cut Knife No. 439 | December 13, 1909 | 415 | 364 | +14.0% | 651.33 | 0.6 |
| Cymri No. 36 | December 13, 1909 | 568 | 549 | +3.5% | 816.38 | 0.7 |
| Deer Forks No. 232 | January 1, 1913 | 208 | 209 | −0.5% | 736.87 | 0.3 |
| Douglas No. 436 | December 13, 1909 | 342 | 350 | −2.3% | 814.37 | 0.4 |
| Duck Lake No. 463 | January 1, 1913 | 1,010 | 955 | +5.8% | 1,034.52 | 1.0 |
| Dufferin No. 190 | December 9, 1912 | 454 | 559 | −18.8% | 949.88 | 0.5 |
| Dundurn No. 314 | December 13, 1909 | 2,101 | 2,404 | −12.6% | 799.97 | 2.6 |
| Eagle Creek No. 376 | December 13, 1909 | 643 | 595 | +8.1% | 822.29 | 0.8 |
| Edenwold No. 158 | December 9, 1912 | 4,466 | 4,490 | −0.5% | 848.84 | 5.3 |
| Elcapo No. 154 | December 12, 1910 | 392 | 488 | −19.7% | 824.30 | 0.5 |
| Eldon No. 471 | December 13, 1909 | 700 | 750 | −6.7% | 991.15 | 0.7 |
| Elfros No. 307 | December 13, 1909 | 373 | 391 | −4.6% | 687.56 | 0.5 |
| Elmsthorpe No. 100 | December 12, 1910 | 195 | 226 | −13.7% | 824.15 | 0.2 |
| Emerald No. 277 | December 12, 1910 | 370 | 405 | −8.6% | 807.18 | 0.5 |
| Enfield No. 194 | December 13, 1909 | 268 | 226 | +18.6% | 1,003.93 | 0.3 |
| Enniskillen No. 3 | December 13, 1909 | 422 | 459 | −8.1% | 820.04 | 0.5 |
| Enterprise No. 142 | April 18, 1913 | 110 | 110 | 0.0% | 998.47 | 0.1 |
| Estevan No. 5 | December 12, 1910 | 1,279 | 1,370 | −6.6% | 772.00 | 1.7 |
| Excel No. 71 | January 1, 1913 | 411 | 391 | +5.1% | 1,093.31 | 0.4 |
| Excelsior No. 166 | December 13, 1909 | 808 | 806 | +0.2% | 1,196.48 | 0.7 |
| Eye Hill No. 382 | December 12, 1910 | 552 | 590 | −6.4% | 775.85 | 0.7 |
| Eyebrow No. 193 | December 13, 1909 | 220 | 195 | +12.8% | 830.73 | 0.3 |
| Fertile Belt No. 183 | January 1, 1913 | 727 | 781 | −6.9% | 1,001.93 | 0.7 |
| Fertile Valley No. 285 | December 13, 1909 | 604 | 539 | +12.1% | 1,010.19 | 0.6 |
| Fillmore No. 96 | December 13, 1909 | 224 | 223 | +0.4% | 815.57 | 0.3 |
| Fish Creek No. 402 | January 1, 1913 | 364 | 345 | +5.5% | 583.95 | 0.6 |
| Flett's Springs No. 429 | December 13, 1909 | 656 | 732 | −10.4% | 838.98 | 0.8 |
| Foam Lake No. 276 | December 12, 1910 | 532 | 529 | +0.6% | 1,284.41 | 0.4 |
| Fox Valley No. 171 | October 29, 1913 | 344 | 330 | +4.2% | 1,253.40 | 0.3 |
| Francis No. 127 | December 13, 1909 | 701 | 674 | +4.0% | 1,077.36 | 0.7 |
| Frenchman Butte No. 501 | January 1, 1954 | 1,250 | 1,494 | −16.3% | 1,902.15 | 0.7 |
| Frontier No. 19 | January 1, 1913 | 347 | 326 | +6.4% | 1,631.39 | 0.2 |
| Garden River No. 490 | January 1, 1913 | 647 | 671 | −3.6% | 656.60 | 1.0 |
| Garry No. 245 | January 1, 1913 | 370 | 364 | +1.6% | 790.20 | 0.5 |
| Glen Bain No. 105 | December 11, 1911 | 195 | 180 | +8.3% | 827.17 | 0.2 |
| Glen McPherson No. 46 | January 1, 1913 | 76 | 72 | +5.6% | 845.13 | 0.1 |
| Glenside No. 377 | December 13, 1909 | 206 | 248 | −16.9% | 883.96 | 0.2 |
| Golden West No. 95 | December 13, 1909 | 289 | 291 | −0.7% | 781.59 | 0.4 |
| Good Lake No. 274 | January 1, 1913 | 930 | 747 | +24.5% | 773.54 | 1.2 |
| Grandview No. 349 | December 11, 1911 | 230 | 348 | −33.9% | 709.49 | 0.3 |
| Grant No. 372 | December 13, 1909 | 525 | 466 | +12.7% | 659.69 | 0.8 |
| Grass Lake No. 381 | December 13, 1909 | 389 | 399 | −2.5% | 772.90 | 0.5 |
| Grassy Creek No. 78 | January 1, 1913 | 341 | 364 | −6.3% | 831.45 | 0.4 |
| Gravelbourg No. 104 | December 9, 1912 | 317 | 372 | −14.8% | 824.45 | 0.4 |
| Grayson No. 184 | January 1, 1913 | 547 | 512 | +6.8% | 862.80 | 0.6 |
| Great Bend No. 405 | December 12, 1910 | 381 | 509 | −25.1% | 825.90 | 0.5 |
| Griffin No. 66 | December 13, 1909 | 430 | 438 | −1.8% | 801.27 | 0.5 |
| Gull Lake No. 139 | January 1, 1913 | 185 | 201 | −8.0% | 828.48 | 0.2 |
| Happy Valley No. 10 | January 1, 1913 | 125 | 139 | −10.1% | 806.93 | 0.2 |
| Happyland No. 231 | January 1, 1913 | 285 | 249 | +14.5% | 1,269.18 | 0.2 |
| Harris No. 316 | December 12, 1910 | 205 | 193 | +6.2% | 807.34 | 0.3 |
| Hart Butte No. 11 | January 1, 1913 | 263 | 252 | +4.4% | 839.22 | 0.3 |
| Hazel Dell No. 335 | January 1, 1913 | 511 | 515 | −0.8% | 1,358.45 | 0.4 |
| Hazelwood No. 94 | January 1, 1913 | 244 | 230 | +6.1% | 714.41 | 0.3 |
| Heart's Hill No. 352 | November 15, 1910 | 234 | 244 | −4.1% | 826.01 | 0.3 |
| Hillsborough No. 132 | January 1, 1913 | 97 | 101 | −4.0% | 434.18 | 0.2 |
| Hillsdale No. 440 | January 1, 1913 | 528 | 553 | −4.5% | 1,014.77 | 0.5 |
| Hoodoo No. 401 | January 1, 1913 | 802 | 675 | +18.8% | 786.69 | 1.0 |
| Hudson Bay No. 394 | May 1, 1977 | 1,145 | 1,092 | +4.9% | 12,399.12 | 0.1 |
| Humboldt No. 370 | January 1, 1913 | 961 | 935 | +2.8% | 780.28 | 1.2 |
| Huron No. 223 | December 12, 1910 | 205 | 198 | +3.5% | 830.68 | 0.2 |
| Indian Head No. 156 | August 6, 1884 | 362 | 336 | +7.7% | 745.38 | 0.5 |
| Insinger No. 275 | January 1, 1913 | 305 | 315 | −3.2% | 808.55 | 0.4 |
| Invergordon No. 430 | December 11, 1911 | 563 | 565 | −0.4% | 844.71 | 0.7 |
| Invermay No. 305 | December 11, 1911 | 269 | 325 | −17.2% | 694.14 | 0.4 |
| Ituna Bon Accord No. 246 | January 1, 1913 | 327 | 374 | −12.6% | 788.73 | 0.4 |
| Kellross No. 247 | December 13, 1909 | 396 | 395 | +0.3% | 809.22 | 0.5 |
| Kelvington No. 366 | January 1, 1913 | 366 | 398 | −8.0% | 853.13 | 0.4 |
| Key West No. 70 | December 12, 1910 | 251 | 255 | −1.6% | 786.65 | 0.3 |
| Keys No. 303 | January 1, 1913 | 548 | 416 | +31.7% | 656.49 | 0.8 |
| Kindersley No. 290 | December 12, 1910 | 1,003 | 1,049 | −4.4% | 2,164.53 | 0.5 |
| King George No. 256 | December 11, 1911 | 178 | 226 | −21.2% | 820.32 | 0.2 |
| Kingsley No. 124 | December 12, 1910 | 396 | 444 | −10.8% | 828.77 | 0.5 |
| Kinistino No. 459 | December 11, 1911 | 604 | 554 | +9.0% | 921.69 | 0.7 |
| Lac Pelletier No. 107 | January 1, 1913 | 563 | 546 | +3.1% | 841.37 | 0.7 |
| Lacadena No. 228 | December 12, 1910 | 787 | 535 | +47.1% | 1,896.92 | 0.4 |
| Laird No. 404 | December 12, 1910 | 1,304 | 1,387 | −6.0% | 725.42 | 1.8 |
| Lajord No. 128 | December 13, 1909 | 985 | 1,232 | −20.0% | 945.10 | 1.0 |
| Lake Alma No. 8 | May 5, 1913 | 269 | 272 | −1.1% | 785.50 | 0.3 |
| Lake Johnston No. 102 | December 9, 1912 | 140 | 170 | −17.6% | 555.80 | 0.3 |
| Lake Lenore No. 399 | January 1, 1913 | 506 | 587 | −13.8% | 714.17 | 0.7 |
| Lake of the Rivers No. 72 | December 11, 1911 | 252 | 279 | −9.7% | 665.26 | 0.4 |
| Lakeland No. 521 | August 1, 1977 | 1,300 | 915 | +42.1% | 488.65 | 2.7 |
| Lakeside No. 338 | December 12, 1910 | 396 | 415 | −4.6% | 653.88 | 0.6 |
| Lakeview No. 337 | December 13, 1909 | 366 | 368 | −0.5% | 709.10 | 0.5 |
| Langenburg No. 181 | January 1, 1913 | 561 | 557 | +0.7% | 656.42 | 0.9 |
| Last Mountain Valley No. 250 | December 13, 1909 | 339 | 275 | +23.3% | 858.96 | 0.4 |
| Laurier No. 38 | December 13, 1909 | 253 | 296 | −14.5% | 816.25 | 0.3 |
| Lawtonia No. 135 | December 12, 1910 | 356 | 346 | +2.9% | 843.24 | 0.4 |
| Leask No. 464 | December 9, 1912 | 857 | 681 | +25.8% | 1,195.54 | 0.7 |
| Leroy No. 339 | January 1, 1913 | 457 | 502 | −9.0% | 831.54 | 0.5 |
| Lipton No. 217 | December 11, 1911 | 388 | 381 | +1.8% | 805.35 | 0.5 |
| Livingston No. 331 | January 1, 1913 | 281 | 281 | 0.0% | 1,326.24 | 0.2 |
| Lomond No. 37 | December 11, 1911 | 275 | 296 | −7.1% | 825.60 | 0.3 |
| Lone Tree No. 18 | December 8, 1913 | 140 | 150 | −6.7% | 821.40 | 0.2 |
| Longlaketon No. 219 | December 12, 1910 | 1,096 | 1,016 | +7.9% | 1,022.45 | 1.1 |
| Loon Lake No. 561 | January 1, 1978 | 836 | 756 | +10.6% | 3,148.06 | 0.3 |
| Loreburn No. 254 | December 12, 1910 | 380 | 327 | +16.2% | 958.42 | 0.4 |
| Lost River No. 313 | December 11, 1911 | 252 | 242 | +4.1% | 549.96 | 0.5 |
| Lumsden No. 189 | December 9, 1912 | 1,968 | 1,938 | +1.5% | 816.17 | 2.4 |
| Manitou Lake No. 442 | December 12, 1910 | 505 | 573 | −11.9% | 839.29 | 0.6 |
| Mankota No. 45 | January 1, 1913 | 289 | 292 | −1.0% | 1,693.17 | 0.2 |
| Maple Bush No. 224 | December 13, 1909 | 213 | 192 | +10.9% | 818.05 | 0.3 |
| Maple Creek No. 111 | December 10, 1917 | 1,167 | 1,063 | +9.8% | 3,180.10 | 0.4 |
| Mariposa No. 350 | December 12, 1910 | 291 | 205 | +42.0% | 635.16 | 0.5 |
| Marquis No. 191 | December 11, 1911 | 303 | 312 | −2.9% | 781.48 | 0.4 |
| Marriott No. 317 | December 12, 1910 | 349 | 366 | −4.6% | 832.54 | 0.4 |
| Martin No. 122 | January 1, 1913 | 254 | 289 | −12.1% | 542.27 | 0.5 |
| Maryfield No. 91 | December 9, 1912 | 258 | 324 | −20.4% | 748.67 | 0.3 |
| Mayfield No. 406 | December 13, 1909 | 391 | 377 | +3.7% | 780.54 | 0.5 |
| McCraney No. 282 | December 13, 1909 | 280 | 310 | −9.7% | 944.47 | 0.3 |
| McKillop No. 220 | December 13, 1909 | 897 | 732 | +22.5% | 663.90 | 1.4 |
| McLeod No. 185 | January 1, 1913 | 401 | 365 | +9.9% | 872.52 | 0.5 |
| Meadow Lake No. 588 | February 1, 1976 | 2,553 | 2,476 | +3.1% | 6,231.27 | 0.4 |
| Medstead No. 497 | January 1, 1913 | 489 | 508 | −3.7% | 1,195.14 | 0.4 |
| Meeting Lake No. 466 | January 1, 1913 | 335 | 319 | +5.0% | 1,043.34 | 0.3 |
| Meota No. 468 | December 13, 1909 | 1,110 | 933 | +19.0% | 642.11 | 1.7 |
| Mervin No. 499 | January 1, 1913 | 1,711 | 1,256 | +36.2% | 1,581.66 | 1.1 |
| Milden No. 286 | December 12, 1910 | 280 | 327 | −14.4% | 732.95 | 0.4 |
| Milton No. 292 | December 11, 1911 | 249 | 266 | −6.4% | 672.17 | 0.4 |
| Miry Creek No. 229 | January 1, 1913 | 378 | 370 | +2.2% | 1,227.72 | 0.3 |
| Monet No. 257 | December 13, 1909 | 432 | 445 | −2.9% | 1,587.99 | 0.3 |
| Montmartre No. 126 | December 13, 1909 | 350 | 483 | −27.5% | 817.75 | 0.4 |
| Montrose No. 315 | December 13, 1909 | 647 | 712 | −9.1% | 897.57 | 0.7 |
| Moose Creek No. 33 | December 12, 1910 | 306 | 379 | −19.3% | 828.74 | 0.4 |
| Moose Jaw No. 161 | December 11, 1911 | 1,207 | 1,143 | +5.6% | 777.62 | 1.6 |
| Moose Mountain No. 63 | December 11, 1911 | 489 | 492 | −0.6% | 718.23 | 0.7 |
| Moose Range No. 486 | December 11, 1916 | 942 | 1,000 | −5.8% | 2,423.98 | 0.4 |
| Moosomin No. 121 | January 1, 1913 | 541 | 603 | −10.3% | 545.78 | 1.0 |
| Morris No. 312 | December 13, 1909 | 263 | 290 | −9.3% | 842.62 | 0.3 |
| Morse No. 165 | December 11, 1911 | 396 | 427 | −7.3% | 1,232.65 | 0.3 |
| Mount Hope No. 279 | December 11, 1911 | 531 | 531 | 0.0% | 1,624.57 | 0.3 |
| Mount Pleasant No. 2 | December 11, 1911 | 345[12] | 414 | −16.7% | 772.71 | 0.4 |
| Mountain View No. 318 | December 13, 1909 | 358 | 337 | +6.2% | 847.02 | 0.4 |
| Newcombe No. 260 | December 11, 1911 | 356 | 342 | +4.1% | 1,094.64 | 0.3 |
| Nipawin No. 487 | December 9, 1912 | 958 | 1,004 | −4.6% | 879.63 | 1.1 |
| North Battleford No. 437 | December 12, 1910 | 687 | 725 | −5.2% | 792.18 | 0.9 |
| North Qu'Appelle No. 187 | December 12, 1910 | 918 | 855 | +7.4% | 489.53 | 1.9 |
| Norton No. 69 | December 13, 1909 | 233 | 233 | 0.0% | 808.81 | 0.3 |
| Oakdale No. 320 | December 13, 1909 | 216 | 253 | −14.6% | 826.79 | 0.3 |
| Old Post No. 43 | January 1, 1967 | 352 | 377 | −6.6% | 1,757.50 | 0.2 |
| Orkney No. 244 | January 1, 1913 | 1,883 | 1,875 | +0.4% | 770.05 | 2.4 |
| Paddockwood No. 520 | January 1, 1978 | 1,071 | 900 | +19.0% | 2,450.94 | 0.4 |
| Parkdale No. 498 | January 1, 1913 | 725 | 621 | +16.7% | 1,375.62 | 0.5 |
| Paynton No. 470 | January 1, 1913 | 238 | 255 | −6.7% | 588.62 | 0.4 |
| Pense No. 160 | January 1, 1913 | 441 | 508 | −13.2% | 840.18 | 0.5 |
| Perdue No. 346 | December 13, 1909 | 471 | 445 | +5.8% | 818.49 | 0.6 |
| Piapot No. 110 | December 8, 1913 | 280 | 302 | −7.3% | 1,942.87 | 0.1 |
| Pinto Creek No. 75 | January 1, 1913 | 251 | 288 | −12.8% | 838.82 | 0.3 |
| Pittville No. 169 | January 1, 1913 | 201 | 208 | −3.4% | 1,256.42 | 0.2 |
| Pleasant Valley No. 288 | December 11, 1911 | 301 | 302 | −0.3% | 822.47 | 0.4 |
| Pleasantdale No. 398 | December 11, 1911 | 599 | 596 | +0.5% | 755.60 | 0.8 |
| Ponass Lake No. 367 | January 1, 1913 | 416 | 422 | −1.4% | 795.56 | 0.5 |
| Poplar Valley No. 12 | January 1, 1913 | 190 | 195 | −2.6% | 765.28 | 0.2 |
| Porcupine No. 395 | February 28, 1944 | 736 | 803 | −8.3% | 2,316.38 | 0.3 |
| Prairie Rose No. 309 | December 12, 1910 | 195 | 220 | −11.4% | 837.66 | 0.2 |
| Prairiedale No. 321 | December 13, 1909 | 246 | 247 | −0.4% | 556.20 | 0.4 |
| Preeceville No. 334 | January 1, 1913 | 966 | 919 | +5.1% | 1,368.92 | 0.7 |
| Prince Albert No. 461 | December 9, 1912 | 3,438 | 3,562 | −3.5% | 1,010.10 | 3.4 |
| Progress No. 351 | December 12, 1910 | 265 | 268 | −1.1% | 788.45 | 0.3 |
| Reciprocity No. 32 | December 11, 1911 | 351 | 344 | +2.0% | 707.95 | 0.5 |
| Redberry No. 435 | January 1, 1913 | 372 | 342 | +8.8% | 1,003.09 | 0.4 |
| Redburn No. 130 | January 1, 1913 | 253 | 250 | +1.2% | 845.89 | 0.3 |
| Reford No. 379 | December 12, 1910 | 222 | 257 | −13.6% | 695.85 | 0.3 |
| Reno No. 51 | December 11, 1911 | 343 | 379 | −9.5% | 3,424.73 | 0.1 |
| Riverside No. 168 | January 1, 1913 | 436 | 477 | −8.6% | 1,307.46 | 0.3 |
| Rocanville No. 151 | December 9, 1912 | 544 | 507 | +7.3% | 748.04 | 0.7 |
| Rodgers No. 133 | December 9, 1912 | 105 | 90 | +16.7% | 697.18 | 0.2 |
| Rosedale No. 283 | December 13, 1909 | 542 | 526 | +3.0% | 923.87 | 0.6 |
| Rosemount No. 378 | December 12, 1910 | 175 | 201 | −12.9% | 561.28 | 0.3 |
| Rosthern No. 403 | December 9, 1912 | 2,473 | 2,300 | +7.5% | 944.28 | 2.6 |
| Round Hill No. 467 | December 11, 1911 | 394 | 361 | +9.1% | 809.51 | 0.5 |
| Round Valley No. 410 | December 13, 1909 | 384 | 423 | −9.2% | 795.72 | 0.5 |
| Rudy No. 284 | December 13, 1909 | 475 | 466 | +1.9% | 807.31 | 0.6 |
| Saltcoats No. 213 | December 9, 1912 | 743 | 712 | +4.4% | 824.85 | 0.9 |
| Sarnia No. 221 | December 13, 1909 | 326 | 322 | +1.2% | 863.89 | 0.4 |
| Saskatchewan Landing No. 167 | January 1, 1913 | 434 | 415 | +4.6% | 792.73 | 0.5 |
| Sasman No. 336 | January 1, 1913 | 813 | 765 | +6.3% | 984.26 | 0.8 |
| Scott No. 98 | December 13, 1909 | 215 | 195 | +10.3% | 846.58 | 0.3 |
| Senlac No. 411 | January 1, 1913 | 198 | 216 | −8.3% | 1,007.30 | 0.2 |
| Shamrock No. 134 | December 9, 1912 | 194 | 205 | −5.4% | 761.86 | 0.3 |
| Shellbrook No. 493 | January 1, 1913 | 1,581 | 1,587 | −0.4% | 1,213.96 | 1.3 |
| Sherwood No. 159 | December 11, 1911 | 1,219 | 974 | +25.2% | 656.66 | 1.9 |
| Silverwood No. 123 | October 31, 1911 | 355 | 410 | −13.4% | 827.96 | 0.4 |
| Sliding Hills No. 273 | January 1, 1913 | 438 | 421 | +4.0% | 820.70 | 0.5 |
| Snipe Lake No. 259 | December 11, 1911 | 410 | 396 | +3.5% | 1,615.91 | 0.3 |
| Souris Valley No. 7 | December 13, 1909 | 220 | 249 | −11.6% | 804.48 | 0.3 |
| South Qu'Appelle No. 157 | August 6, 1884 | 1,231 | 1,275 | −3.5% | 877.75 | 1.4 |
| Spalding No. 368 | December 11, 1911 | 420 | 453 | −7.3% | 811.15 | 0.5 |
| Spiritwood No. 496 | December 9, 1929 | 1,245 | 1,223 | +1.8% | 2,371.04 | 0.5 |
| Spy Hill No. 152 | December 11, 1911 | 383 | 323 | +18.6% | 646.54 | 0.6 |
| St. Andrews No. 287 | December 12, 1910 | 461 | 522 | −11.7% | 807.82 | 0.6 |
| St. Louis No. 431 | January 1, 1913 | 1,029 | 1,086 | −5.2% | 777.51 | 1.3 |
| St. Peter No. 369 | December 11, 1911 | 723 | 773 | −6.5% | 827.39 | 0.9 |
| St. Philips No. 301 | January 1, 1913 | 200 | 220 | −9.1% | 647.80 | 0.3 |
| Stanley No. 215 | January 1, 1913 | 508 | 505 | +0.6% | 824.95 | 0.6 |
| Star City No. 428 | January 1, 1913 | 811 | 918 | −11.7% | 822.81 | 1.0 |
| Stonehenge No. 73 | December 11, 1911 | 385 | 380 | +1.3% | 956.43 | 0.4 |
| Storthoaks No. 31 | December 11, 1911 | 281[12] | 292 | −3.8% | 551.21 | 0.5 |
| Surprise Valley No. 9 | January 1, 1913 | 211 | 217 | −2.8% | 802.64 | 0.3 |
| Sutton No. 103 | December 11, 1911 | 230 | 240 | −4.2% | 792.29 | 0.3 |
| Swift Current No. 137 | December 12, 1910 | 1,995 | 1,932 | +3.3% | 1,100.47 | 1.8 |
| Tecumseh No. 65 | December 13, 1909 | 255 | 271 | −5.9% | 798.92 | 0.3 |
| Terrell No. 101 | January 1, 1913 | 210 | 241 | −12.9% | 837.04 | 0.3 |
| The Gap No. 39 | December 12, 1903 | 181 | 199 | −9.0% | 795.76 | 0.2 |
| Three Lakes No. 400 | January 1, 1913 | 725 | 598 | +21.2% | 770.76 | 0.9 |
| Tisdale No. 427 | December 9, 1912 | 885 | 911 | −2.9% | 843.02 | 1.0 |
| Torch River No. 488 | January 1, 1950 | 1,219 | 1,471 | −17.1% | 5,145.75 | 0.2 |
| Touchwood No. 248 | December 12, 1910 | 373 | 343 | +8.7% | 684.57 | 0.5 |
| Tramping Lake No. 380 | December 12, 1910 | 402 | 375 | +7.2% | 605.12 | 0.7 |
| Tullymet No. 216 | January 1, 1913 | 183 | 200 | −8.5% | 555.62 | 0.3 |
| Turtle River No. 469 | December 9, 1912 | 307 | 339 | −9.4% | 655.72 | 0.5 |
| Usborne No. 310 | December 13, 1909 | 511 | 529 | −3.4% | 806.11 | 0.6 |
| Val Marie No. 17 | January 1, 1969 | 425 | 413 | +2.9% | 3,059.22 | 0.1 |
| Vanscoy No. 345 | December 13, 1909 | 2,799 | 2,840 | −1.4% | 861.10 | 3.3 |
| Victory No. 226 | December 8, 1919 | 434 | 380 | +14.2% | 1,360.62 | 0.3 |
| Viscount No. 341 | December 13, 1909 | 320 | 338 | −5.3% | 828.55 | 0.4 |
| Wallace No. 243 | December 11, 1911 | 881 | 852 | +3.4% | 814.69 | 1.1 |
| Walpole No. 92 | December 12, 1910 | 292 | 326 | −10.4% | 832.36 | 0.4 |
| Waverley No. 44 | February 1, 1913 | 295 | 336 | −12.2% | 1,425.78 | 0.2 |
| Wawken No. 93 | January 1, 1913 | 614 | 571 | +7.5% | 743.50 | 0.8 |
| Webb No. 138 | December 13, 1909 | 567 | 541 | +4.8% | 1,101.92 | 0.5 |
| Wellington No. 97 | December 13, 1909 | 274 | 371 | −26.1% | 831.16 | 0.3 |
| Weyburn No. 67 | December 13, 1909 | 1,103 | 1,064 | +3.7% | 808.50 | 1.4 |
| Wheatlands No. 163 | December 13, 1909 | 157 | 149 | +5.4% | 818.63 | 0.2 |
| Whiska Creek No. 106 | January 1, 1913 | 512 | 465 | +10.1% | 845.65 | 0.6 |
| White Valley No. 49 | January 1, 1913 | 352 | 478 | −26.4% | 2,001.56 | 0.2 |
| Willner No. 253 | January 1, 1913 | 293 | 255 | +14.9% | 836.21 | 0.4 |
| Willow Bunch No. 42 | November 21, 1912 | 285 | 306 | −6.9% | 1,037.04 | 0.3 |
| Willow Creek No. 458 | December 9, 1912 | 683 | 630 | +8.4% | 838.86 | 0.8 |
| Willowdale No. 153 | January 1, 1913 | 248 | 294 | −15.6% | 594.03 | 0.4 |
| Wilton No. 472 | December 13, 1909 | 1,473 | 1,629 | −9.6% | 1,022.90 | 1.4 |
| Winslow No. 319 | December 13, 1909 | 344 | 344 | 0.0% | 814.35 | 0.4 |
| Wise Creek No. 77 | January 1, 1913 | 188 | 205 | −8.3% | 822.49 | 0.2 |
| Wolseley No. 155 | December 13, 1909 | 366 | 372 | −1.6% | 758.46 | 0.5 |
| Wolverine No. 340 | December 13, 1909 | 511 | 480 | +6.5% | 828.06 | 0.6 |
| Wood Creek No. 281 | December 13, 1909 | 205 | 224 | −8.5% | 829.78 | 0.2 |
| Wood River No. 74 | December 9, 1912 | 466 | 433 | +7.6% | 824.84 | 0.6 |
| Wreford No. 280 | December 12, 1910 | 140 | 135 | +3.7% | 793.30 | 0.2 |
| Total rural municipalities | 176,316 | 176,499 | −0.1% | 304,528.21 | 0.6 | |
Northern municipalities
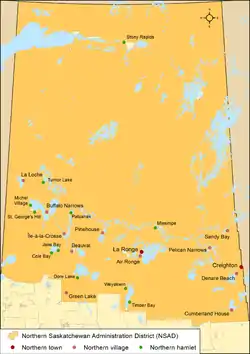
Saskatchewan has 24 northern municipalities, which includes the sub-types of northern towns, northern villages and northern hamlets,[2] that are located within the Northern Saskatchewan Administration District (NSAD).[15] Administration of northern towns, northern villages and northern hamlets is regulated by The Northern Municipalities Act.[7] Under this act:
- a northern town may be formed from a northern village if it has a permanent resident population of at least 500;
- a northern village may be formed from a northern hamlet if it has a permanent resident population of at least 100 and contains at least 50 separate dwelling units or business premises; and
- a northern hamlet may be formed from an unincorporated northern settlement if it has a permanent population of at least 50 and contains at least 25 separate dwelling units or business premises.
Saskatchewan has 2 northern towns, 11 northern villages and 11 northern hamlets.[2] The largest and smallest northern municipalities by population are La Ronge (a northern town) and Michel Village (a northern hamlet) with 2,521 and 37.[3] The largest and smallest northern municipalities by land area are Green Lake and Black Point with 121.18 km2 (46.79 sq mi) and 0.69 km2 (0.27 sq mi).[3]
| Name[10] | Status | Incorporation date[16] |
2021 Census of Population[3] | ||||
|---|---|---|---|---|---|---|---|
| Population (2021) |
Population (2016) |
Change |
Land area (km2) |
Population density (/km2) | |||
| Creighton | Northern town | October 1, 1983 | 1,203 | 1,429 | −15.8% | 12.92 | 93.1 |
| La Ronge | Northern town | May 3, 1905 | 2,521 | 2,688 | −6.2% | 16.71 | 150.9 |
| Air Ronge | Northern village | July 13, 1977 | 1,365 | 1,199 | +13.8% | 6.00 | 227.5 |
| Beauval | Northern village | November 14, 1969 | 685 | 640 | +7.0% | 14.72 | 46.5 |
| Buffalo Narrows | Northern village | April 15, 1965 | 1,014 | 1,110 | −8.6% | 68.04 | 14.9 |
| Cumberland House | Northern village | April 15, 1965 | 540 | 791 | −31.7% | 16.11 | 33.5 |
| Denare Beach | Northern village | October 1, 1983 | 699 | 709 | −1.4% | 6.40 | 109.2 |
| Green Lake | Northern village | August 20, 1973 | 411 | 429 | −4.2% | 121.18 | 3.4 |
| Île-à-la-Crosse | Northern village | April 15, 1965 | 1,425 | 1,296 | +10.0% | 23.30 | 61.2 |
| La Loche | Northern village | November 19, 1968 | 2,514 | 2,444 | +2.9% | 15.47 | 162.5 |
| Pelican Narrows | Northern village | October 1, 1983 | 123 | 178 | −30.9% | 2.40 | 51.3 |
| Pinehouse | Northern village | July 6, 1979 | 1,013 | 1,074 | −5.7% | 6.77 | 149.6 |
| Sandy Bay | Northern village | April 15, 1965 | 671 | 572 | +17.3% | 11.42 | 58.8 |
| Black Point | Northern hamlet | March 26, 2008 | 39 | 43 | −9.3% | 0.69 | 56.5 |
| Cole Bay | Northern hamlet | November 1, 1983 | 194 | 170 | +14.1% | 4.86 | 39.9 |
| Dore Lake | Northern hamlet | January 11, 1985 | 37 | 30 | +23.3% | 7.94 | 4.7 |
| Jans Bay | Northern hamlet | October 1, 1983 | 116 | 152 | −23.7% | 6.09 | 19.0 |
| Michel Village | Northern hamlet | November 1, 1983 | 37 | 86 | −57.0% | 3.81 | 9.7 |
| Patuanak | Northern hamlet | December 1, 1983 | 63 | 73 | −13.7% | 1.09 | 57.8 |
| St. George's Hill | Northern hamlet | December 1, 1983 | 77 | 131 | −41.2% | 1.68 | 45.8 |
| Stony Rapids | Northern hamlet | April 1, 1992 | 219 | 262 | −16.4% | 4.24 | 51.7 |
| Timber Bay | Northern hamlet | October 1, 1983 | 81 | 82 | −1.2% | 5.99 | 13.5 |
| Turnor Lake | Northern hamlet | October 1, 1984 | 154 | 149 | +3.4% | 5.07 | 30.4 |
| Weyakwin | Northern hamlet | December 1, 1983 | 100 | 102 | −2.0% | 5.27 | 19.0 |
| Sub-total northern towns | 3,724 | 4,117 | −9.5% | 29.63 | 125.7 | ||
| Sub-total northern villages | 10,460 | 10,442 | +0.2% | 291.81 | 35.8 | ||
| Sub-total northern hamlets | 1,117 | 1,280 | −12.7% | 46.73 | 23.9 | ||
| Total northern municipalities | 15,301 | 15,839 | −3.4% | 368.17 | 41.6 | ||
See also
Notes
- The remaining 5.2% of Saskatchewan's population resides on Indian reserves, Indian settlements, the vast unincorporated portions of the Northern Saskatchewan Administration District and other unincorporated areas. Together, they occupy the remaining 151.5% of the province's land mass.[3]
- This refers to the rural municipality that surrounds the urban municipality.
References
- "Population and dwelling counts, for Canada, provinces and territories, 2021 and 2016 censuses – 100% data". Statistics Canada. March 14, 2022. Retrieved March 14, 2022.
- "Types of Municipalities". Saskatchewan Ministry of Government Relations. Retrieved June 7, 2020.
- "Population and dwelling counts: Canada, provinces and territories, and census subdivisions (municipalities), Saskatchewan". Statistics Canada. February 9, 2022. Retrieved February 17, 2022.
- "Municipal System – History and Types". Saskatchewan Municipal Relations. Archived from the original on October 19, 2013. Retrieved December 4, 2013.
- "The Cities Act" (PDF) (PDF). Government of Saskatchewan. pp. 9, 32 and 34. Retrieved December 17, 2012.
- "The Municipalities Act" (PDF) (PDF). Government of Saskatchewan. pp. 11 and 45 46. Retrieved December 12, 2012.
- "The Northern Municipalities Act" (PDF) (PDF). Saskatchewan Queen's Printer. pp. 9 and 15 16. Retrieved February 9, 2008.
- "Programs & Services". Saskatchewan Municipal Relations. Archived from the original on October 19, 2013. Retrieved December 10, 2013.
- "Village or Resort Village Incorporation". Saskatchewan.ca. Retrieved 16 July 2019.
- "Search for Municipal Information". Saskatchewan Ministry of Municipal Relations. Archived from the original on March 10, 2014. Retrieved December 12, 2012.
- "Urban Municipality Incorporations" (PDF). Saskatchewan Ministry of Government Relations. p. 11. Archived from the original on October 15, 2014. Retrieved December 11, 2013.
{{cite web}}: CS1 maint: bot: original URL status unknown (link) - "Population and dwelling count amendments, 2021 Census". Statistics Canada. July 13, 2022. Retrieved July 16, 2022.
- "Southern and Central Saskatchewan, Canada: Rural Municipalities". Saskatchewan Department of Government Relations and Aboriginal Affairs (Municipal Relations Branch). 2002. Archived from the original on October 19, 2013. Retrieved December 12, 2012.
- "Rural Municipality Incorporations (Alphabetical)". Saskatchewan Ministry of Municipal Affairs. Archived from the original on April 21, 2011. Retrieved June 29, 2014.
{{cite web}}: CS1 maint: bot: original URL status unknown (link) - "The Northern Saskatchewan Administration District Boundaries Regulations" (PDF) (PDF). Saskatchewan Queen's Printer. Retrieved February 9, 2008.
- "Northern Communities Incorporation Dates" (PDF). Saskatchewan Ministry of Municipal Affairs. Archived from the original on December 20, 2013. Retrieved December 20, 2013.
External links
| |||||||||||||||||||||||||||||