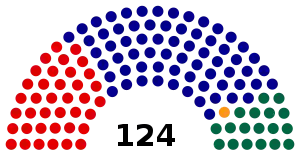
Results of the 1977 Australian federal election (House of Representatives)
This is a list of electoral division results for the Australian 1977 federal election.[1]
Overall
- This section is an excerpt from 1977 Australian federal election § House of Representatives results
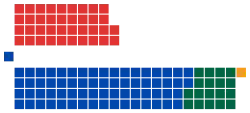
| Party | Votes | % | Swing | Seats | Change | ||
|---|---|---|---|---|---|---|---|
| Liberal–NCP coalition | 3,811,340 | 48.11 | –4.95 | 86 | –5 | ||
| Liberal | 3,017,896 | 38.09 | −3.71 | 67 | −1 | ||
| National Country | 776,982 | 9.81 | −1.44 | 18 | −4 | ||
| Country Liberal | 16,462 | 0.21 | +0.00 | 1 | 0 | ||
| Labor | 3,141,051 | 39.65 | −3.20 | 38 | +2 | ||
| Democrats | 743,365 | 9.38 | +9.38 | 0 | 0 | ||
| Democratic Labor | 113,271 | 1.43 | +0.11 | 0 | 0 | ||
| Progress | 47,567 | 0.60 | –0.18 | 0 | 0 | ||
| Communist | 14,098 | 0.18 | +0.06 | 0 | 0 | ||
| Socialist | 1,895 | 0.02 | +0.02 | 0 | 0 | ||
| Independents | 50,267 | 0.63 | –0.19 | 0 | 0 | ||
| Total | 7,922,854 | 124 | −3 | ||||
| Two-party-preferred (estimated) | |||||||
| Liberal–NCP coalition | Win | 54.60 | −1.10 | 86 | –5 | ||
| Labor | 45.40 | +1.10 | 38 | +2 | |||
New South Wales
| ||||||||||||||||||||||||||||||||||
All 43 NSW seats in the House of Representatives 22 seats needed for a majority | ||||||||||||||||||||||||||||||||||
|---|---|---|---|---|---|---|---|---|---|---|---|---|---|---|---|---|---|---|---|---|---|---|---|---|---|---|---|---|---|---|---|---|---|---|
| ||||||||||||||||||||||||||||||||||
.jpg.webp)

Banks
- This section is an excerpt from Electoral results for the Division of Banks § 1977
| Party | Candidate | Votes | % | ±% | |
|---|---|---|---|---|---|
| Labor | Vince Martin | 33,452 | 48.6 | −4.8 | |
| Liberal | Paul Hinton | 25,942 | 37.7 | −4.5 | |
| Democrats | Montague Greene | 9,453 | 13.7 | +13.7 | |
| Total formal votes | 58,847 | 97.6 | −0.3 | ||
| Informal votes | 1,693 | 2.4 | +0.3 | ||
| Turnout | 60,540 | 96.4 | −0.3 | ||
| Two-party-preferred result | |||||
| Labor | Vince Martin | 37,330 | 54.2 | −0.6 | |
| Liberal | Paul Hinton | 31,517 | 45.8 | +0.6 | |
| Labor hold | Swing | −0.6 | |||
Barton
- This section is an excerpt from Electoral results for the Division of Barton § 1977
| Party | Candidate | Votes | % | ±% | |
|---|---|---|---|---|---|
| Liberal | Jim Bradfield | 32,128 | 48.4 | −4.1 | |
| Labor | Ron Cunningham | 27,204 | 41.0 | −4.1 | |
| Democrats | Phil White | 5,650 | 8.5 | +8.5 | |
| Independent | Charles Bellchambers | 1,404 | 2.1 | +2.1 | |
| Total formal votes | 66,386 | 98.0 | |||
| Informal votes | 1,322 | 2.0 | |||
| Turnout | 67,708 | 95.7 | |||
| Two-party-preferred result | |||||
| Liberal | Jim Bradfield | 36,842 | 54.0 | +0.1 | |
| Labor | Ron Cunningham | 30,544 | 46.0 | −0.1 | |
| Liberal hold | Swing | +0.1 | |||
Bennelong
- This section is an excerpt from Electoral results for the Division of Bennelong § 1977
| Party | Candidate | Votes | % | ±% | |
|---|---|---|---|---|---|
| Liberal | John Howard | 37,080 | 56.2 | −1.1 | |
| Labor | Noel Welsman | 19,794 | 30.0 | −8.6 | |
| Democrats | Bruce Irwin | 8,544 | 13.0 | +13.0 | |
| Progress | David Rennie | 556 | 0.8 | +0.8 | |
| Total formal votes | 65,974 | 98.2 | |||
| Informal votes | 1,215 | 1.8 | |||
| Turnout | 67,189 | 95.7 | |||
| Two-party-preferred result | |||||
| Liberal | John Howard | 63.4 | +3.8 | ||
| Labor | Noel Welsman | 36.6 | −3.8 | ||
| Liberal hold | Swing | +3.8 | |||
Berowra
- This section is an excerpt from Electoral results for the Division of Berowra § 1977
| Party | Candidate | Votes | % | ±% | |
|---|---|---|---|---|---|
| Liberal | Harry Edwards | 39,350 | 62.9 | −4.7 | |
| Labor | Michael Jones | 15,325 | 24.5 | −4.3 | |
| Democrats | Johannes van Aggele | 7,207 | 11.5 | +11.5 | |
| Progress | George Simpson | 686 | 1.1 | −2.5 | |
| Total formal votes | 62,568 | 98.3 | |||
| Informal votes | 1,069 | 1.7 | |||
| Turnout | 63,637 | 96.2 | |||
| Two-party-preferred result | |||||
| Liberal | Harry Edwards | 69.6 | −0.9 | ||
| Labor | Michael Jones | 30.4 | +0.9 | ||
| Liberal hold | Swing | −0.9 | |||
Blaxland
- This section is an excerpt from Electoral results for the Division of Blaxland § 1977
| Party | Candidate | Votes | % | ±% | |
|---|---|---|---|---|---|
| Labor | Paul Keating | 36,109 | 54.2 | −3.1 | |
| Liberal | Salvatore Napoli | 21,978 | 33.0 | −7.3 | |
| Democrats | Steven Suli | 4,500 | 6.8 | +6.8 | |
| Independent | William Haggerty | 3,974 | 6.0 | +6.0 | |
| Total formal votes | 66,561 | 96.3 | |||
| Informal votes | 2,541 | 3.7 | |||
| Turnout | 69,102 | 95.1 | |||
| Two-party-preferred result | |||||
| Labor | Paul Keating | 61.6 | +3.8 | ||
| Liberal | Salvatore Napoli | 38.4 | −3.8 | ||
| Labor hold | Swing | +3.8 | |||
Bradfield
- This section is an excerpt from Electoral results for the Division of Bradfield § 1977
| Party | Candidate | Votes | % | ±% | |
|---|---|---|---|---|---|
| Liberal | David Connolly | 49,052 | 72.6 | −5.8 | |
| Labor | Pauline Kibble | 9,578 | 14.2 | −3.5 | |
| Democrats | Donald Marrable | 7,378 | 10.9 | +10.9 | |
| Progress | Christopher Brown | 1,518 | 2.2 | −1.7 | |
| Total formal votes | 67,526 | 98.7 | |||
| Informal votes | 913 | 1.3 | |||
| Turnout | 68,439 | 95.2 | |||
| Two-party-preferred result | |||||
| Liberal | David Connolly | 79.7 | −1.0 | ||
| Labor | Pauline Kibble | 30.3 | +1.0 | ||
| Liberal hold | Swing | −1.0 | |||
Calare
- This section is an excerpt from Electoral results for the Division of Calare § 1977
| Party | Candidate | Votes | % | ±% | |
|---|---|---|---|---|---|
| Labor | David Simmons | 26,799 | 40.5 | −0.9 | |
| National Country | Sandy Mackenzie | 20,893 | 31.6 | −1.4 | |
| Liberal | James Ashton | 13,509 | 20.4 | −5.2 | |
| Democrats | Darvell Baird | 4,986 | 7.5 | +7.5 | |
| Total formal votes | 66,187 | 98.4 | |||
| Informal votes | 1,081 | 1.6 | |||
| Turnout | 67,268 | 96.4 | |||
| Two-party-preferred result | |||||
| National Country | Sandy Mackenzie | 36,529 | 55.2 | +0.5 | |
| Labor | David Simmons | 29,658 | 44.8 | −0.5 | |
| National Country hold | Swing | +0.5 | |||
Chifley
- This section is an excerpt from Electoral results for the Division of Chifley § 1977
| Party | Candidate | Votes | % | ±% | |
|---|---|---|---|---|---|
| Labor | John Armitage | 39,168 | 60.0 | −3.5 | |
| Liberal | Richard Taylor | 17,745 | 27.2 | −9.3 | |
| Democrats | Alfred Tozer | 6,414 | 9.8 | +9.8 | |
| Communist | Jack Mundey | 1,910 | 2.9 | +2.9 | |
| Total formal votes | 65,237 | 96.6 | |||
| Informal votes | 2,307 | 3.4 | |||
| Turnout | 67,544 | 95.9 | |||
| Two-party-preferred result | |||||
| Labor | John Armitage | 67.5 | +4.0 | ||
| Liberal | Richard Taylor | 38.5 | −4.0 | ||
| Labor hold | Swing | +4.0 | |||
Cook
- This section is an excerpt from Electoral results for the Division of Cook § 1977
| Party | Candidate | Votes | % | ±% | |
|---|---|---|---|---|---|
| Liberal | Don Dobie | 35,648 | 51.6 | −4.4 | |
| Labor | Ray Thorburn | 25,511 | 36.9 | −3.6 | |
| Democrats | Walter Day | 7,162 | 10.4 | +10.4 | |
| Progress | Henry Soper | 791 | 1.1 | −0.4 | |
| Total formal votes | 69,112 | 98.5 | |||
| Informal votes | 1,024 | 1.5 | |||
| Turnout | 70,136 | 96.6 | |||
| Two-party-preferred result | |||||
| Liberal | Don Dobie | 58.3 | +0.5 | ||
| Labor | Ray Thorburn | 41.7 | −0.5 | ||
| Liberal hold | Swing | +0.5 | |||
Cowper
- This section is an excerpt from Electoral results for the Division of Cowper § 1977
| Party | Candidate | Votes | % | ±% | |
|---|---|---|---|---|---|
| National Country | Ian Robinson | 41,015 | 63.9 | +2.5 | |
| Labor | Colin Clague | 23,221 | 36.1 | +1.5 | |
| Total formal votes | 64,236 | 98.1 | |||
| Informal votes | 1,231 | 1.9 | |||
| Turnout | 65,467 | 95.9 | |||
| National Country hold | Swing | +0.5 | |||
Cunningham
- This section is an excerpt from Electoral results for the Division of Cunningham § 1977
| Party | Candidate | Votes | % | ±% | |
|---|---|---|---|---|---|
| Labor | Stewart West | 36,559 | 53.5 | −8.2 | |
| Liberal | Thomas Griffin | 21,419 | 31.3 | −5.1 | |
| Democrats | Ross Sampson | 7,388 | 10.8 | +10.8 | |
| Independent | Noel Dennett | 1,583 | 2.3 | +2.3 | |
| Communist | Mervyn Nixon | 1,073 | 1.6 | +1.6 | |
| Independent | Rudolph Dezelin | 375 | 0.5 | +0.5 | |
| Total formal votes | 68,397 | 97.2 | |||
| Informal votes | 1,957 | 2.8 | |||
| Turnout | 70,354 | 95.5 | |||
| Two-party-preferred result | |||||
| Labor | Stewart West | 60.7 | −1.6 | ||
| Liberal | Thomas Griffin | 39.3 | +1.6 | ||
| Labor hold | Swing | −1.6 | |||
Dundas
- This section is an excerpt from Electoral results for the Division of Dundas § 1977
| Party | Candidate | Votes | % | ±% | |
|---|---|---|---|---|---|
| Liberal | Philip Ruddock | 36,427 | 53.8 | -4.4 | |
| Labor | Russell Rollason | 22,980 | 33.9 | -4.9 | |
| Democrats | Brendan Mohide | 6,484 | 9.6 | +9.6 | |
| Progress | Malcolm McKinnon | 1,824 | 2.7 | +2.7 | |
| Total formal votes | 67,715 | 98.0 | |||
| Informal votes | 1,395 | 2.0 | |||
| Turnout | 69,110 | 95.5 | |||
| Two-party-preferred result | |||||
| Liberal | Philip Ruddock | 60.1 | +0.1 | ||
| Labor | Russell Rollason | 39.9 | -0.1 | ||
| Liberal notional hold | Swing | +0.1 | |||
Eden-Monaro
- This section is an excerpt from Electoral results for the Division of Eden-Monaro § 1977
| Party | Candidate | Votes | % | ±% | |
|---|---|---|---|---|---|
| Liberal | Murray Sainsbury | 33,517 | 51.7 | +16.4 | |
| Labor | Brian Maguire | 25,243 | 38.9 | -4.6 | |
| Democrats | Norma Helmers | 5,587 | 8.6 | +8.6 | |
| Independent | Michael Le Grand | 530 | 0.8 | +0.8 | |
| Total formal votes | 64,877 | 98.4 | |||
| Informal votes | 1,041 | 1.6 | |||
| Turnout | 65,918 | 96.6 | |||
| Two-party-preferred result | |||||
| Liberal | Murray Sainsbury | 55.9 | +0.4 | ||
| Labor | Brian Maguire | 44.1 | -0.4 | ||
| Liberal hold | Swing | +0.4 | |||
Farrer
- This section is an excerpt from Electoral results for the Division of Farrer § 1977
| Party | Candidate | Votes | % | ±% | |
|---|---|---|---|---|---|
| Liberal | Wal Fife | 40,187 | 61.9 | +11.5 | |
| Labor | Donald Fleming | 19,400 | 29.9 | +0.2 | |
| Democrats | Margaret Healey | 3,962 | 6.1 | +6.1 | |
| Independent | Thomas Guy | 718 | 1.1 | +1.1 | |
| Progress | Maureen Nathan | 643 | 1.0 | +0.1 | |
| Total formal votes | 64,910 | 98.1 | |||
| Informal votes | 1,230 | 1.9 | |||
| Turnout | 66,140 | 94.9 | |||
| Two-party-preferred result | |||||
| Liberal | Wal Fife | 66.4 | -0.7 | ||
| Labor | Donald Fleming | 33.6 | +0.7 | ||
| Liberal hold | Swing | -0.7 | |||
Grayndler
- This section is an excerpt from Electoral results for the Division of Grayndler § 1977
| Party | Candidate | Votes | % | ±% | |
|---|---|---|---|---|---|
| Labor | Frank Stewart | 36,299 | 57.7 | +6.0 | |
| Liberal | Bill Vasseleou | 20,980 | 33.4 | -6.6 | |
| Democrats | Christine Townend | 4,558 | 7.2 | +7.2 | |
| Socialist | Frank Vouros | 1,048 | 1.7 | +1.7 | |
| Total formal votes | 62,885 | 96.7 | |||
| Informal votes | 2,145 | 3.3 | |||
| Turnout | 65,030 | 92.0 | |||
| Two-party-preferred result | |||||
| Labor | Frank Stewart | 62.2 | +6.8 | ||
| Liberal | Bill Vasseleou | 37.8 | -6.8 | ||
| Labor hold | Swing | +6.8 | |||
Gwydir
- This section is an excerpt from Electoral results for the Division of Gwydir § 1977
| Party | Candidate | Votes | % | ±% | |
|---|---|---|---|---|---|
| National Country | Ralph Hunt | 37,600 | 59.0 | +0.2 | |
| Labor | Francis Fish | 20,831 | 32.7 | -7.0 | |
| Democrats | Heather Howe | 2,866 | 4.5 | +4.5 | |
| Progress | Brian Allen | 1,743 | 2.7 | +2.7 | |
| Independent | Lyall Munro | 654 | 1.0 | +1.0 | |
| Total formal votes | 63,694 | 97.9 | |||
| Informal votes | 1,362 | 2.1 | |||
| Turnout | 65,056 | 95.8 | |||
| Two-party-preferred result | |||||
| National Country | Ralph Hunt | 63.3 | +3.0 | ||
| Labor | Francis Fish | 36.7 | -3.0 | ||
| National Country hold | Swing | +3.0 | |||
Hughes
- This section is an excerpt from Electoral results for the Division of Hughes § 1977
| Party | Candidate | Votes | % | ±% | |
|---|---|---|---|---|---|
| Labor | Les Johnson | 34,659 | 51.7 | -4.9 | |
| Liberal | Henry Halliwell | 22,229 | 33.1 | -10.3 | |
| Democrats | Kenneth Johnson | 10,212 | 15.2 | -4.9 | |
| Total formal votes | 67,100 | 97.9 | |||
| Informal votes | 1,410 | 2.1 | |||
| Turnout | 68,510 | 95.5 | |||
| Two-party-preferred result | |||||
| Labor | Les Johnson | 59.3 | +2.7 | ||
| Liberal | Henry Halliwell | 40.7 | -2.7 | ||
| Labor hold | Swing | +2.7 | |||
Hume
- This section is an excerpt from Electoral results for the Division of Hume § 1977
| Party | Candidate | Votes | % | ±% | |
|---|---|---|---|---|---|
| National Country | Stephen Lusher | 37,521 | 57.0 | +3.2 | |
| Labor | George Brenner | 25,266 | 38.4 | −1.4 | |
| Democrats | Mark Richard | 2,986 | 4.5 | +4.5 | |
| Total formal votes | 65,773 | 98.8 | |||
| Informal votes | 815 | 1.2 | |||
| Turnout | 66,588 | 96.1 | |||
| Two-party-preferred result | |||||
| National Country | Stephen Lusher | 59.3 | −0.9 | ||
| Labor | George Brenner | 40.7 | +0.9 | ||
| National Country hold | Swing | −0.9 | |||
Hunter
- This section is an excerpt from Electoral results for the Division of Hunter § 1977
| Party | Candidate | Votes | % | ±% | |
|---|---|---|---|---|---|
| Labor | Bert James | 42,076 | 60.7 | -5.8 | |
| Liberal | Oliver Fennell | 19,299 | 27.8 | -5.7 | |
| Democrats | Elisabeth Kirkby | 7,944 | 11.5 | +11.5 | |
| Total formal votes | 69,319 | 98.0 | |||
| Informal votes | 1,383 | 2.0 | |||
| Turnout | 70,702 | 96.3 | |||
| Two-party-preferred result | |||||
| Labor | Bert James | 66.5 | +0.0 | ||
| Liberal | Oliver Fennell | 32.5 | +0.0 | ||
| Labor hold | Swing | +0.0 | |||
Kingsford Smith
- This section is an excerpt from Electoral results for the Division of Kingsford Smith § 1977
| Party | Candidate | Votes | % | ±% | |
|---|---|---|---|---|---|
| Labor | Lionel Bowen | 42,222 | 64.4 | +0.8 | |
| Liberal | Collin O'Neill | 19,377 | 29.6 | -4.3 | |
| Democrats | Edward Ward | 3,974 | 6.1 | +6.1 | |
| Total formal votes | 65,573 | 96.7 | |||
| Informal votes | 2,213 | 3.3 | |||
| Turnout | 67,786 | 94.2 | |||
| Two-party-preferred result | |||||
| Labor | Lionel Bowen | 67.5 | +2.6 | ||
| Liberal | Collin O'Neill | 32.5 | -2.6 | ||
| Labor hold | Swing | +2.6 | |||
Lowe
- This section is an excerpt from Electoral results for the Division of Lowe § 1977
| Party | Candidate | Votes | % | ±% | |
|---|---|---|---|---|---|
| Liberal | Sir William McMahon | 35,044 | 52.8 | -3.4 | |
| Labor | Dick Hall | 35,044 | 39.2 | -0.7 | |
| Democrats | Frederick Tross | 3,764 | 5.7 | +5.7 | |
| Independent | Charles Bingle | 1,553 | 2.3 | +2.3 | |
| Total formal votes | 66,413 | 97.3 | |||
| Informal votes | 1,840 | 2.7 | |||
| Turnout | 68,253 | 93.5 | |||
| Two-party-preferred result | |||||
| Liberal | Sir William McMahon | 56.3 | -1.6 | ||
| Labor | Dick Hall | 43.7 | +1.6 | ||
| Liberal hold | Swing | -1.6 | |||
Lyne
- This section is an excerpt from Electoral results for the Division of Lyne § 1977
| Party | Candidate | Votes | % | ±% | |
|---|---|---|---|---|---|
| National Country | Philip Lucock | 36,678 | 55.8 | −3.3 | |
| Labor | Noel Unicomb | 22,308 | 34.0 | +2.1 | |
| Democrats | Allen Edwards | 6,687 | 10.2 | +10.2 | |
| Total formal votes | 65,673 | 98.6 | |||
| Informal votes | 916 | 1.4 | |||
| Turnout | 66,589 | 97.1 | |||
| Two-party-preferred result | |||||
| National Country | Philip Lucock | 61.4 | −2.2 | ||
| Labor | Noel Unicomb | 38.6 | +2.2 | ||
| National Country hold | Swing | −2.2 | |||
Macarthur
- This section is an excerpt from Electoral results for the Division of Macarthur § 1977
| Party | Candidate | Votes | % | ±% | |
|---|---|---|---|---|---|
| Liberal | Michael Baume | 32,209 | 48.4 | -2.9 | |
| Labor | John Kerin | 29,686 | 44.6 | -0.4 | |
| Democrats | William Speirs | 4,034 | 6.1 | +6.1 | |
| Progress | Victor Thomas | 603 | 0.9 | -1.8 | |
| Total formal votes | 66,532 | 98.5 | |||
| Informal votes | 1,012 | 1.5 | |||
| Turnout | 67,544 | 96.3 | |||
| Two-party-preferred result | |||||
| Liberal | Michael Baume | 34,557 | 51.9 | -2.2 | |
| Labor | John Kerin | 31,975 | 48.1 | +2.2 | |
| Liberal hold | Swing | -2.2 | |||
Mackellar
- This section is an excerpt from Electoral results for the Division of Mackellar § 1977
| Party | Candidate | Votes | % | ±% | |
|---|---|---|---|---|---|
| Liberal | Jim Carlton | 36,064 | 55.4 | -7.4 | |
| Labor | John Barclay | 18,329 | 28.2 | -1.9 | |
| Democrats | Robert Williams | 7,262 | 11.2 | +11.2 | |
| Independent | Ronald Davis | 1,604 | 2.5 | +2.5 | |
| Progress | John Booth | 1,000 | 1.5 | -3.5 | |
| Independent | Barry Geyle | 621 | 1.0 | +1.0 | |
| Independent | Thomas Mellor | 185 | 0.3 | +0.3 | |
| Total formal votes | 65,065 | 97.5 | |||
| Informal votes | 1,682 | 2.5 | |||
| Turnout | 66.747 | 93.1 | |||
| Two-party-preferred result | |||||
| Liberal | Jim Carlton | 64.3 | -2.7 | ||
| Labor | John Barclay | 35.7 | +2.7 | ||
| Liberal hold | Swing | -2.7 | |||
Macquarie
- This section is an excerpt from Electoral results for the Division of Macquarie § 1977
| Party | Candidate | Votes | % | ±% | |
|---|---|---|---|---|---|
| Liberal | Reg Gillard | 28,299 | 41.8 | -11.1 | |
| Labor | Ross Free | 26,651 | 39.4 | -4.6 | |
| Democrats | Peter Monaghan | 7,328 | 10.8 | +10.8 | |
| Independent | Michael Barratt | 4,849 | 7.2 | +7.2 | |
| Progress | Alyn Foster | 513 | 0.8 | -1.1 | |
| Total formal votes | 67,640 | 97.7 | |||
| Informal votes | 1,622 | 2.3 | |||
| Turnout | 69,262 | 94.6 | |||
| Two-party-preferred result | |||||
| Liberal | Reg Gillard | 34,966 | 51.7 | -2.6 | |
| Labor | Ross Free | 32,674 | 48.3 | +2.6 | |
| Liberal hold | Swing | -2.6 | |||
Mitchell
- This section is an excerpt from Electoral results for the Division of Mitchell § 1977
| Party | Candidate | Votes | % | ±% | |
|---|---|---|---|---|---|
| Liberal | Alan Cadman | 39,454 | 60.4 | -5.8 | |
| Labor | Ellen Thompson | 17,733 | 27.1 | -4.0 | |
| Democrats | Michael Hartnell | 5,988 | 9.2 | +9.2 | |
| Independent | Ronald Allan | 1,817 | 2.8 | +2.8 | |
| Progress | Dimitar Mikusalev | 353 | 0.5 | -0.7 | |
| Total formal votes | 65,345 | 98.0 | |||
| Informal votes | 1,331 | 2.0 | |||
| Turnout | 66,676 | 95.5 | |||
| Two-party-preferred result | |||||
| Liberal | Alan Cadman | 67.2 | -1.0 | ||
| Labor | Ellen Thompson | 32.8 | +1.0 | ||
| Liberal hold | Swing | -1.0 | |||
New England
- This section is an excerpt from Electoral results for the Division of New England § 1977
| Party | Candidate | Votes | % | ±% | |
|---|---|---|---|---|---|
| National Country | Ian Sinclair | 37,601 | 59.3 | -4.1 | |
| Labor | Selby Dean | 19,941 | 31.4 | -1.2 | |
| Democrats | Bradley Mulligan | 5,919 | 9.3 | +9.3 | |
| Total formal votes | 63,461 | 98.5 | |||
| Informal votes | 979 | 1.5 | |||
| Turnout | 64,440 | 95.4 | |||
| Two-party-preferred result | |||||
| National Country | Ian Sinclair | 64.0 | -0.9 | ||
| Labor | Selby Dean | 36.0 | +0.9 | ||
| National Country hold | Swing | -0.9 | |||
Newcastle
- This section is an excerpt from Electoral results for the Division of Newcastle1977
| Party | Candidate | Votes | % | ±% | |
|---|---|---|---|---|---|
| Labor | Charles Jones | 38,620 | 57.3 | -2.8 | |
| Liberal | Elaine Samuels | 22,485 | 33.4 | -4.7 | |
| Democrats | Ian Hay | 3,546 | 5.3 | +5.3 | |
| Communist | Darrell Dawson | 2,763 | 4.1 | +2.2 | |
| Total formal votes | 67,414 | 97.7 | |||
| Informal votes | 1,606 | 2.3 | |||
| Turnout | 69,020 | 96.6 | |||
| Two-party-preferred result | |||||
| Labor | Charles Jones | 63.7 | +1.9 | ||
| Liberal | Elaine Samuels | 36.3 | -1.9 | ||
| Labor hold | Swing | +1.9 | |||
North Sydney
- This section is an excerpt from Electoral results for the Division of North Sydney § 1977
| Party | Candidate | Votes | % | ±% | |
|---|---|---|---|---|---|
| Liberal | Bill Graham | 38,176 | 58.6 | -5.2 | |
| Labor | Maurice May | 17,111 | 26.2 | -6.5 | |
| Democrats | John Pierce | 7,153 | 11.0 | +11.0 | |
| Progress | Peter Corrie | 1,672 | 2.6 | -0.2 | |
| Independent | John Maher | 1,073 | 1.6 | +1.6 | |
| Total formal votes | 65,185 | 97.7 | |||
| Informal votes | 1,503 | 2.3 | |||
| Turnout | 66,688 | 92.7 | |||
| Two-party-preferred result | |||||
| Liberal | Bill Graham | 67.3 | +0.9 | ||
| Labor | Maurice May | 32.7 | -0.9 | ||
| Liberal hold | Swing | +0.9 | |||
Parramatta
- This section is an excerpt from Electoral results for the Division of Parramatta § 1977
| Party | Candidate | Votes | % | ±% | |
|---|---|---|---|---|---|
| Labor | John Brown | 34,405 | 52.0 | -0.1 | |
| Liberal | Douglas Cox | 26,315 | 39.8 | -5.2 | |
| Democrats | Peter Lukunic | 5,397 | 8.2 | +8.2 | |
| Total formal votes | 66,117 | 97.0 | |||
| Informal votes | 2,062 | 3.0 | |||
| Turnout | 68,179 | 95.3 | |||
| Two-party-preferred result | |||||
| Labor | John Brown | 56.1 | +3.6 | ||
| Liberal | Douglas Cox | 43.9 | -3.6 | ||
| Labor notional hold | Swing | +3.6 | |||
Paterson
- This section is an excerpt from Electoral results for the Division of Paterson § 1977
| Party | Candidate | Votes | % | ±% | |
|---|---|---|---|---|---|
| National Country | Frank O'Keefe | 36,740 | 57.6 | +0.9 | |
| Labor | Kerry Scott | 21,862 | 34.3 | -6.6 | |
| Democrats | Paul Baker | 4,250 | 6.7 | +6.7 | |
| Independent | William O'Donnell | 923 | 1.4 | +1.4 | |
| Total formal votes | 63,775 | 98.2 | |||
| Informal votes | 1,188 | 1.8 | |||
| Turnout | 64,963 | 95.7 | |||
| Two-party-preferred result | |||||
| National Country | Frank O'Keefe | 62.2 | +3.8 | ||
| Labor | Kerry Scott | 37.8 | -3.8 | ||
| National Country hold | Swing | +3.8 | |||
Phillip
- This section is an excerpt from Electoral results for the Division of Phillip § 1977
| Party | Candidate | Votes | % | ±% | |
|---|---|---|---|---|---|
| Liberal | Jack Birney | 31,517 | 48.0 | -1.2 | |
| Labor | Joe Riordan | 28,876 | 44.0 | -4.3 | |
| Democrats | Alan Needham | 4,664 | 7.1 | +7.1 | |
| Independent | Barry Elliott | 581 | 0.9 | +0.9 | |
| Total formal votes | 65,638 | 97.8 | |||
| Informal votes | 1,508 | 2.2 | |||
| Turnout | 67,146 | 91.1 | |||
| Two-party-preferred result | |||||
| Liberal | Jack Birney | 34,127 | 52.0 | +0.8 | |
| Labor | Joe Riordan | 31,511 | 48.0 | -0.8 | |
| Liberal hold | Swing | +0.8 | |||
Prospect
- This section is an excerpt from Electoral results for the Division of Prospect § 1977
| Party | Candidate | Votes | % | ±% | |
|---|---|---|---|---|---|
| Labor | Dick Klugman | 34,933 | 54.6 | -5.4 | |
| Liberal | Alan Byers | 21,591 | 33.8 | -4.3 | |
| Democrats | Laurence Bourke | 7,421 | 11.6 | +11.6 | |
| Total formal votes | 63,945 | 95.9 | |||
| Informal votes | 2,731 | 4.1 | |||
| Turnout | 66,676 | 94.1 | |||
| Two-party-preferred result | |||||
| Labor | Dick Klugman | 59.9 | -1.2 | ||
| Liberal | Alan Byers | 40.1 | +1.2 | ||
| Labor hold | Swing | -1.2 | |||
Reid
- This section is an excerpt from Electoral results for the Division of Reid § 1977
| Party | Candidate | Votes | % | ±% | |
|---|---|---|---|---|---|
| Labor | Tom Uren | 38,667 | 58.5 | -3.3 | |
| Liberal | Terence Shanahan | 21,246 | 32.1 | -1.2 | |
| Democrats | Frederick Bluck | 6,216 | 9.4 | +9.4 | |
| Total formal votes | 66,129 | 96.7 | |||
| Informal votes | 2,224 | 3.3 | |||
| Turnout | 68,353 | 95.2 | |||
| Two-party-preferred result | |||||
| Labor | Tom Uren | 62.7 | +0.1 | ||
| Liberal | Terence Shanahan | 37.3 | -0.1 | ||
| Labor hold | Swing | +0.1 | |||
Richmond
- This section is an excerpt from Electoral results for the Division of Richmond § 1977
| Party | Candidate | Votes | % | ±% | |
|---|---|---|---|---|---|
| National Country | Doug Anthony | 40,869 | 61.4 | +0.1 | |
| Labor | Josephine Maxwell | 21,170 | 31.8 | -2.8 | |
| Democrats | Bernard Walrut | 3,611 | 5.4 | +5.4 | |
| Independent | John Mallett | 941 | 1.4 | +1.4 | |
| Total formal votes | 66,591 | 98.9 | |||
| Informal votes | 754 | 1.1 | |||
| Turnout | 67,345 | 95.8 | |||
| Two-party-preferred result | |||||
| National Country | Doug Anthony | 64.8 | +1.2 | ||
| Labor | Josephine Maxwell | 35.2 | -1.2 | ||
| National Country hold | Swing | +1.2 | |||
Riverina
- This section is an excerpt from Electoral results for the Division of Riverina § 1977
| Party | Candidate | Votes | % | ±% | |
|---|---|---|---|---|---|
| Labor | John FitzPatrick | 31,237 | 48.8 | -3.6 | |
| National Country | John Sullivan | 31,134 | 48.7 | +1.1 | |
| Independent | Rodney Lawrence | 1,580 | 2.5 | +2.5 | |
| Total formal votes | 74,962 | 98.2 | |||
| Informal votes | 1,159 | 1.8 | |||
| Turnout | 65,110 | 94.4 | |||
| Two-party-preferred result | |||||
| Labor | John FitzPatrick | 32,049 | 50.1 | -2.3 | |
| National Country | John Sullivan | 31,902 | 49.9 | +2.3 | |
| Labor notional hold | Swing | -2.3 | |||
Robertson
- This section is an excerpt from Electoral results for the Division of Robertson § 1977
| Party | Candidate | Votes | % | ±% | |
|---|---|---|---|---|---|
| Labor | Barry Cohen | 32,341 | 46.7 | -1.5 | |
| Liberal | Malcolm Brooks | 29,825 | 43.1 | -6.2 | |
| Democrats | Trevor Willsher | 7,095 | 10.2 | +10.2 | |
| Total formal votes | 69,261 | 98.5 | |||
| Informal votes | 1,085 | 1.5 | |||
| Turnout | 70,346 | 96.1 | |||
| Two-party-preferred result | |||||
| Labor | Barry Cohen | 36,229 | 52.3 | +3.0 | |
| Liberal | Malcolm Brooks | 33,032 | 47.7 | -3.0 | |
| Labor notional gain from Liberal | Swing | +3.0 | |||
Shortland
- This section is an excerpt from Electoral results for the Division of Shortland § 1977
| Party | Candidate | Votes | % | ±% | |
|---|---|---|---|---|---|
| Labor | Peter Morris | 37,406 | 54.5 | -4.5 | |
| Liberal | Richard Bevan | 24,178 | 35.2 | -3.0 | |
| Democrats | Lionel Lambkin | 7,058 | 10.3 | +10.3 | |
| Total formal votes | 68,642 | 98.0 | |||
| Informal votes | 1,415 | 2.0 | |||
| Turnout | 70,057 | 96.0 | |||
| Two-party-preferred result | |||||
| Labor | Peter Morris | 59.7 | -0.7 | ||
| Liberal | Richard Bevan | 40.3 | +0.7 | ||
| Labor hold | Swing | -0.7 | |||
St George
- This section is an excerpt from Electoral results for the Division of St George § 1977
| Party | Candidate | Votes | % | ±% | |
|---|---|---|---|---|---|
| Liberal | Maurice Neil | 32,078 | 47.9 | -1.1 | |
| Labor | Tony Whitlam | 30,227 | 45.1 | -3.6 | |
| Democrats | Ronald Kirkwood | 4,243 | 6.3 | +6.3 | |
| Progress | David Kriss | 441 | 0.7 | -1.6 | |
| Total formal votes | 66,989 | 97.4 | |||
| Informal votes | 1,784 | 2.6 | |||
| Turnout | 68,773 | 95.4 | |||
| Two-party-preferred result | |||||
| Liberal | Maurice Neil | 34,827 | 52.0 | +2.0 | |
| Labor | Tony Whitlam | 32,162 | 48.0 | -2.0 | |
| Liberal hold | Swing | +2.0 | |||
Sydney
- This section is an excerpt from Electoral results for the Division of Sydney § 1977
| Party | Candidate | Votes | % | ±% | |
|---|---|---|---|---|---|
| Labor | Les McMahon | 39,307 | 63.2 | -0.9 | |
| Liberal | Andrew Morrison | 14,158 | 22.7 | -5.1 | |
| Communist | Aileen Beaver | 3,935 | 6.3 | +0.7 | |
| Democrats | Judith Roberts | 3,428 | 5.5 | +5.5 | |
| Socialist | Harry Black | 847 | 1.4 | +1.4 | |
| Independent | Naomi Mayers | 560 | 0.9 | +0.9 | |
| Total formal votes | 62,235 | 95.7 | |||
| Informal votes | 2,773 | 4.3 | |||
| Turnout | 65,008 | 90.5 | |||
| Two-party-preferred result | |||||
| Labor | Les McMahon | 73.4 | +3.3 | ||
| Liberal | Andrew Morrison | 26.6 | -3.3 | ||
| Labor hold | Swing | +3.3 | |||
Warringah
- This section is an excerpt from Electoral results for the Division of Warringah § 1977
| Party | Candidate | Votes | % | ±% | |
|---|---|---|---|---|---|
| Liberal | Michael MacKellar | 40,984 | 62.9 | −4.4 | |
| Labor | Christopher Osborne | 16,102 | 24.7 | −6.8 | |
| Democrats | Anita Stiller | 6,385 | 9.8 | +9.8 | |
| Progress | Stephen Keliher | 1,677 | 2.6 | +2.6 | |
| Total formal votes | 65,148 | 98.0 | |||
| Informal votes | 1,326 | 2.0 | |||
| Turnout | 66,474 | 94.6 | |||
| Two-party-preferred result | |||||
| Liberal | Michael MacKellar | 70.2 | +2.2 | ||
| Labor | Christopher Osborne | 29.8 | −2.2 | ||
| Liberal hold | Swing | +2.2 | |||
Wentworth
- This section is an excerpt from Electoral results for the Division of Wentworth § 1977
| Party | Candidate | Votes | % | ±% | |
|---|---|---|---|---|---|
| Liberal | Bob Ellicott | 35,980 | 57.5 | -0.4 | |
| Labor | Michael Winters | 19,638 | 31.4 | -5.3 | |
| Democrats | Joan Kersey | 5,069 | 8.1 | +8.1 | |
| Progress | John Curvers | 1,909 | 3.0 | -0.9 | |
| Total formal votes | 62,596 | 97.5 | |||
| Informal votes | 1,608 | 2.5 | |||
| Turnout | 64,204 | 90.1 | |||
| Two-party-preferred result | |||||
| Liberal | Bob Ellicott | 64.4 | +2.6 | ||
| Labor | Michael Winters | 35.6 | -2.6 | ||
| Liberal hold | Swing | +2.6 | |||
Werriwa
- This section is an excerpt from Electoral results for the Division of Werriwa § 1977
| Party | Candidate | Votes | % | ±% | |
|---|---|---|---|---|---|
| Labor | Gough Whitlam | 37,262 | 55.5 | −0.7 | |
| Liberal | Jonas Abromas | 22,787 | 33.9 | −6.4 | |
| Democrats | Keith Olson | 6,035 | 9.0 | +9.0 | |
| Independent | Ross May | 1,079 | 1.6 | +1.6 | |
| Total formal votes | 67,163 | 96.7 | |||
| Informal votes | 2,205 | 3.2 | |||
| Turnout | 69,368 | 95.5 | |||
| Two-party-preferred result | |||||
| Labor | Gough Whitlam | 60.2 | +2.0 | ||
| Liberal | Jonas Abromas | 39.8 | −2.0 | ||
| Labor hold | Swing | +2.0 | |||
Victoria
| ||||||||||||||||||||||||||||||||||
All 33 Victorian seats in the House of Representatives 17 seats needed for a majority | ||||||||||||||||||||||||||||||||||
|---|---|---|---|---|---|---|---|---|---|---|---|---|---|---|---|---|---|---|---|---|---|---|---|---|---|---|---|---|---|---|---|---|---|---|
| ||||||||||||||||||||||||||||||||||
Balaclava
- This section is an excerpt from Electoral results for the Division of Balaclava § 1977
| Party | Candidate | Votes | % | ±% | |
|---|---|---|---|---|---|
| Liberal | Ian Macphee | 33,304 | 50.6 | −7.0 | |
| Labor | Robert Steele | 19,065 | 29.0 | −5.1 | |
| Democrats | Zelma Furey | 10,129 | 15.4 | +15.4 | |
| Democratic Labor | Peter Lawlor | 3,321 | 5.0 | +1.0 | |
| Total formal votes | 65,819 | 97.4 | |||
| Informal votes | 1,774 | 2.6 | |||
| Turnout | 67,593 | 94.6 | |||
| Two-party-preferred result | |||||
| Liberal | Ian Macphee | 63.3 | +0.8 | ||
| Labor | Robert Steele | 36.7 | −0.8 | ||
| Liberal hold | Swing | +0.8 | |||
Ballaarat
- This section is an excerpt from Electoral results for the Division of Ballarat § 1977
| Party | Candidate | Votes | % | ±% | |
|---|---|---|---|---|---|
| Liberal | Jim Short | 30,480 | 48.0 | −1.5 | |
| Labor | Norman Baker | 23,487 | 37.0 | −3.5 | |
| Democrats | Graham Gough | 6,298 | 9.9 | +9.9 | |
| Democratic Labor | William Griffin | 3,202 | 5.0 | −2.2 | |
| Total formal votes | 63,467 | 98.0 | |||
| Informal votes | 1,318 | 2.0 | |||
| Turnout | 64,785 | 96.9 | |||
| Two-party-preferred result | |||||
| Liberal | Jim Short | 57.5 | +0.0 | ||
| Labor | Norman Baker | 42.5 | −0.0 | ||
| Liberal hold | Swing | +0.0 | |||
Batman
- This section is an excerpt from Electoral results for the Division of Batman § 1977
| Party | Candidate | Votes | % | ±% | |
|---|---|---|---|---|---|
| Labor | Brian Howe | 31,538 | 47.3 | −4.6 | |
| Liberal | Gillford Brown | 24,932 | 37.4 | −3.3 | |
| Democrats | Mario Piraino | 6,644 | 10.0 | +10.0 | |
| Democratic Labor | Phillip Lorenz | 3,559 | 5.3 | −2.1 | |
| Total formal votes | 66,673 | 96.5 | |||
| Informal votes | 2,392 | 3.5 | |||
| Turnout | 69,065 | 95.7 | |||
| Two-party-preferred result | |||||
| Labor | Brian Howe | 35,581 | 53.4 | +0.9 | |
| Liberal | Gillford Brown | 31,092 | 46.6 | −0.9 | |
| Labor hold | Swing | +0.9 | |||
Bendigo
- This section is an excerpt from Electoral results for the Division of Bendigo § 1977
| Party | Candidate | Votes | % | ±% | |
|---|---|---|---|---|---|
| Liberal | John Bourchier | 30,072 | 48.0 | −1.3 | |
| Labor | Dennis Muldoon | 21,620 | 34.5 | −7.0 | |
| Democrats | Ian Price | 7,905 | 12.6 | +12.6 | |
| Democratic Labor | Paul Brennan | 3,005 | 4.8 | +0.3 | |
| Total formal votes | 62,602 | 98.1 | |||
| Informal votes | 1,210 | 1.9 | |||
| Turnout | 63,812 | 95.8 | |||
| Two-party-preferred result | |||||
| Liberal | John Bourchier | 58.5 | +0.8 | ||
| Labor | Dennis Muldoon | 41.5 | −0.8 | ||
| Liberal hold | Swing | +0.8 | |||
Bruce
- This section is an excerpt from Electoral results for the Division of Bruce § 1977
| Party | Candidate | Votes | % | ±% | |
|---|---|---|---|---|---|
| Liberal | Billy Snedden | 33,913 | 50.4 | −7.3 | |
| Labor | Timothy Burke | 20,927 | 31.1 | −5.3 | |
| Democrats | John Sutcliffe | 10,199 | 15.2 | +15.2 | |
| Democratic Labor | John Mulholland | 2,237 | 3.3 | +0.3 | |
| Total formal votes | 67,276 | 97.9 | |||
| Informal votes | 1,418 | 2.1 | |||
| Turnout | 68,694 | 96.9 | |||
| Two-party-preferred result | |||||
| Liberal | Billy Snedden | 61.0 | −0.6 | ||
| Labor | Timothy Burke | 39.0 | +0.6 | ||
| Liberal hold | Swing | −0.6 | |||
Burke
- This section is an excerpt from Electoral results for the Division of Burke (1969–2004) § 1977
| Party | Candidate | Votes | % | ±% | |
|---|---|---|---|---|---|
| Labor | Keith Johnson | 32,248 | 50.4 | −0.7 | |
| Liberal | Mihaly Lengyel | 20,680 | 32.3 | −7.8 | |
| Democrats | Eric Spencer | 7,122 | 11.1 | +11.1 | |
| Democratic Labor | Colin Walsh | 3,963 | 6.2 | +0.9 | |
| Total formal votes | 64,013 | 96.5 | |||
| Informal votes | 2,341 | 3.5 | |||
| Turnout | 66,354 | 95.8 | |||
| Two-party-preferred result | |||||
| Labor | Keith Johnson | 56.6 | +2.7 | ||
| Liberal | Mihaly Lengyel | 43.4 | −2.7 | ||
| Labor hold | Swing | +2.7 | |||
Casey
- This section is an excerpt from Electoral results for the Division of Casey § 1977
| Party | Candidate | Votes | % | ±% | |
|---|---|---|---|---|---|
| Liberal | Peter Falconer | 29,896 | 48.3 | −5.9 | |
| Labor | Peter Watson | 18,772 | 30.3 | −9.4 | |
| Democrats | Malcolm Whittle | 10,314 | 16.7 | +16.7 | |
| Democratic Labor | Francis Feltham | 1,761 | 2.8 | −0.3 | |
| Independent | Martin Hetherich | 694 | 1.1 | +1.1 | |
| Independent | Stanley Hillman | 343 | 0.6 | +0.6 | |
| Independent | Henry Leggett | 151 | 0.2 | +0.2 | |
| Total formal votes | 61,931 | 97.0 | |||
| Informal votes | 1,917 | 3.0 | |||
| Turnout | 63,848 | 95.8 | |||
| Two-party-preferred result | |||||
| Liberal | Peter Falconer | 60.2 | +1.5 | ||
| Labor | Peter Watson | 39.8 | −1.5 | ||
| Liberal hold | Swing | +1.5 | |||
Chisholm
- This section is an excerpt from Electoral results for the Division of Chisholm § 1977
| Party | Candidate | Votes | % | ±% | |
|---|---|---|---|---|---|
| Liberal | Tony Staley | 31,808 | 46.5 | −8.9 | |
| Labor | Helen Mayer | 21,548 | 31.5 | −5.8 | |
| Democrats | Robert Caulfield | 11,739 | 17.2 | +17.2 | |
| Democratic Labor | Joe Stanley | 3,299 | 4.8 | −0.2 | |
| Total formal votes | 68,394 | 97.9 | |||
| Informal votes | 1,501 | 2.1 | |||
| Turnout | 69,895 | 95.2 | |||
| Two-party-preferred result | |||||
| Liberal | Tony Staley | 58.9 | −1.9 | ||
| Labor | Helen Mayer | 41.1 | +1.9 | ||
| Liberal hold | Swing | −1.9 | |||
Corangamite
- This section is an excerpt from Electoral results for the Division of Corangamite § 1977
| Party | Candidate | Votes | % | ±% | |
|---|---|---|---|---|---|
| Liberal | Tony Street | 37,163 | 58.5 | −5.3 | |
| Labor | Shirley Ambrose | 16,786 | 26.4 | −4.4 | |
| Democrats | Kathleen May | 6,275 | 9.9 | +9.9 | |
| Democratic Labor | Francis O'Brien | 2,756 | 4.3 | +0.3 | |
| Independent | Neil McDonald | 548 | 0.9 | +0.9 | |
| Total formal votes | 63,528 | 98.3 | |||
| Informal votes | 1,101 | 1.7 | |||
| Turnout | 64,629 | 97.7 | |||
| Two-party-preferred result | |||||
| Liberal | Tony Street | 67.8 | −0.2 | ||
| Labor | Shirley Ambrose | 32.2 | +0.2 | ||
| Liberal hold | Swing | −0.2 | |||
Corio
- This section is an excerpt from Electoral results for the Division of Corio § 1977
| Party | Candidate | Votes | % | ±% | |
|---|---|---|---|---|---|
| Labor | Gordon Scholes | 31,612 | 48.4 | −0.6 | |
| Liberal | Clive Bubb | 26,330 | 40.3 | −5.9 | |
| Democrats | Guenter Sahr | 4,740 | 7.3 | +7.3 | |
| Democratic Labor | James Jordan | 2,685 | 4.1 | +0.2 | |
| Total formal votes | 65,367 | 97.3 | |||
| Informal votes | 1,794 | 2.7 | |||
| Turnout | 67,161 | 96.2 | |||
| Two-party-preferred result | |||||
| Labor | Gordon Scholes | 34,588 | 52.9 | +2.9 | |
| Liberal | Clive Bubb | 30,779 | 47.1 | −2.9 | |
| Labor hold | Swing | +2.9 | |||
Deakin
- This section is an excerpt from Electoral results for the Division of Deakin § 1977
| Party | Candidate | Votes | % | ±% | |
|---|---|---|---|---|---|
| Liberal | Alan Jarman | 32,378 | 46.1 | -6.3 | |
| Labor | Neville Gay | 22,730 | 32.4 | -7.6 | |
| Democrats | Alan Teed | 11,451 | 16.3 | +16.3 | |
| Democratic Labor | Daniel Condon | 3,670 | 5.2 | +1.0 | |
| Total formal votes | 70,229 | 97.6 | |||
| Informal votes | 1,710 | 2.4 | |||
| Turnout | 71,939 | 96.4 | |||
| Two-party-preferred result | |||||
| Liberal | Alan Jarman | 40,316 | 57.4 | -0.4 | |
| Labor | Neville Gay | 29,913 | 42.6 | +0.4 | |
| Liberal hold | Swing | -0.4 | |||
Diamond Valley
- This section is an excerpt from Electoral results for the Division of Diamond Valley § 1977
| Party | Candidate | Votes | % | ±% | |
|---|---|---|---|---|---|
| Liberal | Neil Brown | 31,674 | 48.5 | -7.7 | |
| Labor | Jean Downing | 20,355 | 31.2 | -6.9 | |
| Democrats | Ronald Goldman | 10,561 | 16.2 | +16.2 | |
| Democratic Labor | Christopher Curtis | 2,672 | 4.1 | +1.0 | |
| Total formal votes | 65,262 | 98.2 | |||
| Informal votes | 1,173 | 1.8 | |||
| Turnout | 66,435 | 96.7 | |||
| Two-party-preferred result | |||||
| Liberal | Neil Brown | 60.3 | +0.0 | ||
| Labor | Jean Downing | 39.7 | -0.0 | ||
| Liberal hold | Swing | +0.0 | |||
Flinders
- This section is an excerpt from Electoral results for the Division of Flinders § 1977
| Party | Candidate | Votes | % | ±% | |
|---|---|---|---|---|---|
| Liberal | Phillip Lynch | 32,897 | 50.5 | -9.4 | |
| Labor | Geoffrey Eastwood | 19,401 | 29.8 | -5.5 | |
| Democrats | Harold Fraser | 10,070 | 15.5 | +15.5 | |
| Democratic Labor | John Cass | 2,089 | 3.2 | +1.1 | |
| Independent | Monty Hollow | 639 | 1.0 | +1.0 | |
| Total formal votes | 65,096 | 97.7 | |||
| Informal votes | 1,553 | 2.3 | |||
| Turnout | 66,649 | 95.7 | |||
| Two-party-preferred result | |||||
| Liberal | Phillip Lynch | 60.7 | -1.9 | ||
| Labor | Geoffrey Eastwood | 39.3 | +1.9 | ||
| Liberal hold | Swing | -1.9 | |||
Gellibrand
- This section is an excerpt from Electoral results for the Division of Gellibrand § 1977
| Party | Candidate | Votes | % | ±% | |
|---|---|---|---|---|---|
| Labor | Ralph Willis | 38,433 | 58.3 | −3.1 | |
| Liberal | Anton Zajc | 15,241 | 23.1 | −6.6 | |
| Democratic Labor | Bert Bailey | 6,606 | 10.0 | +1.0 | |
| Democrats | June Smith | 5,663 | 8.6 | +8.6 | |
| Total formal votes | 65,943 | 95.2 | |||
| Informal votes | 3,295 | 4.8 | |||
| Turnout | 69,238 | 95.6 | |||
| Two-party-preferred result | |||||
| Labor | Ralph Willis | 64.5 | +2.3 | ||
| Liberal | Anton Zajc | 35.5 | −2.3 | ||
| Labor hold | Swing | +2.3 | |||
Gippsland
- This section is an excerpt from Electoral results for the Division of Gippsland § 1977
| Party | Candidate | Votes | % | ±% | |
|---|---|---|---|---|---|
| National Country | Peter Nixon | 35,778 | 58.0 | -6.7 | |
| Labor | William Switzer | 14,634 | 23.7 | -4.9 | |
| Democrats | Thomas Reid | 6,424 | 10.4 | +10.4 | |
| Democratic Labor | Robert McMahon | 3,003 | 4.9 | -1.9 | |
| Independent | Bruce Ingle | 1,884 | 3.1 | +3.1 | |
| Total formal votes | 61,723 | 97.6 | |||
| Informal votes | 1,501 | 2.4 | |||
| Turnout | 63,224 | 95.8 | |||
| Two-party-preferred result | |||||
| National Country | Peter Nixon | 69.7 | -1.2 | ||
| Labor | William Switzer | 30.3 | +1.2 | ||
| National Country hold | Swing | -1.2 | |||
Henty
- This section is an excerpt from Electoral results for the Division of Henty § 1977
| Party | Candidate | Votes | % | ±% | |
|---|---|---|---|---|---|
| Liberal | Ken Aldred | 29,660 | 45.0 | -6.5 | |
| Labor | Joan Child | 27,325 | 41.5 | -2.3 | |
| Democrats | Fred Ingamells | 6,509 | 9.9 | +9.9 | |
| Democratic Labor | Terry Farrell | 2,061 | 3.1 | -0.4 | |
| Independent | Tony Dear | 359 | 0.5 | +0.5 | |
| Total formal votes | 65,914 | 97.1 | |||
| Informal votes | 1,946 | 2.9 | |||
| Turnout | 67,860 | 95.8 | |||
| Two-party-preferred result | |||||
| Liberal | Ken Aldred | 34,736 | 52.7 | -2.5 | |
| Labor | Joan Child | 31,178 | 47.3 | +2.5 | |
| Liberal hold | Swing | -2.5 | |||
Higgins
- This section is an excerpt from Electoral results for the Division of Higgins § 1977
| Party | Candidate | Votes | % | ±% | |
|---|---|---|---|---|---|
| Liberal | Roger Shipton | 36,504 | 55.2 | −5.5 | |
| Labor | Ann Jackson | 17,308 | 26.2 | −6.4 | |
| Democrats | Jim Thornley | 8,292 | 12.5 | +12.5 | |
| Democratic Labor | Martin Cahill | 3,998 | 6.0 | +1.2 | |
| Total formal votes | 66,102 | 97.8 | |||
| Informal votes | 1,481 | 2.2 | |||
| Turnout | 67,583 | 94.5 | |||
| Two-party-preferred result | |||||
| Liberal | Roger Shipton | 66.0 | +1.1 | ||
| Labor | Ann Jackson | 34.0 | −1.1 | ||
| Liberal hold | Swing | +1.1 | |||
Holt
- This section is an excerpt from Electoral results for the Division of Holt § 1977
| Party | Candidate | Votes | % | ±% | |
|---|---|---|---|---|---|
| Liberal | William Yates | 27,200 | 43.0 | -7.6 | |
| Labor | Michael Duffy | 25,411 | 40.2 | -3.9 | |
| Democrats | Brian Stockton | 8,077 | 12.8 | +12.8 | |
| Democratic Labor | Kevin Leydon | 2,566 | 4.1 | -1.2 | |
| Total formal votes | 63,254 | 97.0 | |||
| Informal votes | 1,950 | 3.0 | |||
| Turnout | 65,204 | 95.1 | |||
| Two-party-preferred result | |||||
| Liberal | William Yates | 32,790 | 51.8 | -2.2 | |
| Labor | Michael Duffy | 30,464 | 48.2 | +2.2 | |
| Liberal hold | Swing | -2.2 | |||
Hotham
- This section is an excerpt from Electoral results for the Division of Hotham § 1977
| Party | Candidate | Votes | % | ±% | |
|---|---|---|---|---|---|
| Liberal | Roger Johnston | 27,663 | 40.4 | −11.7 | |
| Labor | Tony Ross | 26,144 | 38.1 | −5.6 | |
| Democrats | Kenneth Weaver | 12,587 | 18.4 | +18.4 | |
| Democratic Labor | Edward Woods | 2,153 | 3.1 | −0.2 | |
| Total formal votes | 68,547 | 97.0 | |||
| Informal votes | 2,099 | 3.0 | |||
| Turnout | 70,646 | 95.8 | |||
| Two-party-preferred result | |||||
| Liberal | Roger Johnston | 35,450 | 51.7 | −3.8 | |
| Labor | Tony Ross | 33,097 | 48.3 | +3.8 | |
| Liberal hold | Swing | −3.8 | |||
Indi
- This section is an excerpt from Electoral results for the Division of Indi § 1977
| Party | Candidate | Votes | % | ±% | |
|---|---|---|---|---|---|
| National Country | Mac Holten | 21,832 | 35.9 | −25.6 | |
| Liberal | Ewen Cameron | 15,924 | 26.2 | +26.2 | |
| Labor | John Dennis | 15,316 | 25.2 | −0.7 | |
| Democrats | Neil Savage | 4,333 | 7.1 | +7.1 | |
| Democratic Labor | Christopher Cody | 3,407 | 5.6 | −0.7 | |
| Total formal votes | 60,812 | 97.1 | |||
| Informal votes | 1,784 | 2.9 | |||
| Turnout | 62,596 | 96.2 | |||
| Two-party-preferred result | |||||
| Liberal | Ewen Cameron | 33,483 | 55.1 | +55.1 | |
| National Country | Mac Holten | 27,329 | 44.9 | −22.3 | |
| Liberal gain from National Country | Swing | +22.3 | |||
Isaacs
- This section is an excerpt from Electoral results for the Division of Isaacs § 1977
| Party | Candidate | Votes | % | ±% | |
|---|---|---|---|---|---|
| Liberal | Bill Burns | 29,857 | 44.4 | −6.8 | |
| Labor | Kenneth Williams | 23,275 | 34.6 | −8.2 | |
| Democrats | Francis McLeod | 11,427 | 17.0 | +17.0 | |
| Democratic Labor | Ralph Cleary | 2,741 | 4.1 | +0.8 | |
| Total formal votes | 67,300 | 97.7 | |||
| Informal votes | 1,550 | 2.3 | |||
| Turnout | 68,850 | 95.9 | |||
| Two-party-preferred result | |||||
| Liberal | Bill Burns | 38,595 | 57.3 | +2.4 | |
| Labor | Kenneth Williams | 28,705 | 42.7 | −2.4 | |
| Liberal hold | Swing | +2.4 | |||
Kooyong
- This section is an excerpt from Electoral results for the Division of Kooyong § 1977
| Party | Candidate | Votes | % | ±% | |
|---|---|---|---|---|---|
| Liberal | Andrew Peacock | 36,791 | 55.6 | −6.0 | |
| Labor | John Wilkinson | 16,988 | 25.7 | −4.6 | |
| Democrats | Michael McBride | 8,176 | 12.4 | +12.4 | |
| Democratic Labor | Bernie Gaynor | 4,209 | 6.4 | +0.5 | |
| Total formal votes | 66,164 | 97.9 | |||
| Informal votes | 1,388 | 2.1 | |||
| Turnout | 67,552 | 93.6 | |||
| Two-party-preferred result | |||||
| Liberal | Andrew Peacock | 67.7 | −0.2 | ||
| Labor | John Wilkinson | 32.3 | +0.2 | ||
| Liberal hold | Swing | −0.2 | |||
La Trobe
- This section is an excerpt from Electoral results for the Division of La Trobe § 1977
| Party | Candidate | Votes | % | ±% | |
|---|---|---|---|---|---|
| Liberal | Marshall Baillieu | 26,060 | 41.6 | −8.9 | |
| Labor | Tony Lamb | 25,250 | 40.3 | −3.2 | |
| Democrats | Andrew McCann | 8,827 | 14.1 | +14.1 | |
| Democratic Labor | James Penna | 1,410 | 2.3 | +0.0 | |
| Independent | Cornelus Hellema | 1,099 | 1.8 | −0.4 | |
| Total formal votes | 62,646 | 97.3 | |||
| Informal votes | 1,725 | 2.7 | |||
| Turnout | 64,371 | 95.9 | |||
| Two-party-preferred result | |||||
| Liberal | Marshall Baillieu | 31,845 | 50.8 | −3.5 | |
| Labor | Tony Lamb | 30,801 | 49.2 | +3.5 | |
| Liberal hold | Swing | −3.5 | |||
Lalor
- This section is an excerpt from Electoral results for the Division of Lalor § 1977
| Party | Candidate | Votes | % | ±% | |
|---|---|---|---|---|---|
| Labor | Barry Jones | 31,693 | 50.5 | −7.1 | |
| Liberal | Harley Dickinson | 17,633 | 28.1 | −7.0 | |
| Democrats | Charles Skidmore | 6,196 | 9.9 | +9.9 | |
| Democratic Labor | Denis Bilston | 5,502 | 8.8 | +1.6 | |
| Independent | Rosalba Vicari | 1,002 | 1.6 | +1.6 | |
| Independent | Jeffrey Day | 729 | 1.2 | +1.2 | |
| Total formal votes | 62,755 | 94.6 | |||
| Informal votes | 3,561 | 5.4 | |||
| Turnout | 66,316 | 96.4 | |||
| Two-party-preferred result | |||||
| Labor | Barry Jones | 57.6 | −1.6 | ||
| Liberal | Harley Dickinson | 42.4 | +1.6 | ||
| Labor hold | Swing | −1.6 | |||
Mallee
- This section is an excerpt from Electoral results for the Division of Mallee § 1977
| Party | Candidate | Votes | % | ±% | |
|---|---|---|---|---|---|
| National Country | Peter Fisher | 29,613 | 48.3 | −20.2 | |
| Liberal | Warwick Hincksman | 14,581 | 23.8 | +23.8 | |
| Labor | Geoffrey Ferns | 13,362 | 21.8 | −3.2 | |
| Democratic Labor | John Cotter | 3,707 | 6.1 | −0.4 | |
| Total formal votes | 61,263 | 97.5 | |||
| Informal votes | 1,546 | 2.5 | |||
| Turnout | 62,809 | 96.6 | |||
| Two-party-preferred result | |||||
| National Country | Peter Fisher | 73.3 | −0.2 | ||
| Labor | Geoffrey Ferns | 26.7 | +0.2 | ||
| National Country hold | Swing | −0.2 | |||
Maribyrnong
- This section is an excerpt from Electoral results for the Division of Maribyrnong § 1977
| Party | Candidate | Votes | % | ±% | |
|---|---|---|---|---|---|
| Labor | Moss Cass | 27,927 | 43.6 | -4.1 | |
| Liberal | Philip Fitzherbert | 23,560 | 36.7 | -7.1 | |
| Democrats | Alan Brass | 8,651 | 13.5 | +13.5 | |
| Democratic Labor | Alan Tait | 3,982 | 6.2 | +0.6 | |
| Total formal votes | 64,120 | 96.8 | |||
| Informal votes | 2,137 | 3.2 | |||
| Turnout | 66,257 | 97.0 | |||
| Two-party-preferred result | |||||
| Labor | Moss Cass | 33,313 | 52.0 | +1.7 | |
| Liberal | Philip Fitzherbert | 30,807 | 48.0 | -1.7 | |
| Labor hold | Swing | +1.7 | |||
McMillan
- This section is an excerpt from Electoral results for the Division of McMillan § 1977
| Party | Candidate | Votes | % | ±% | |
|---|---|---|---|---|---|
| Liberal | Barry Simon | 27,650 | 44.5 | +11.9 | |
| Labor | Richard Elkington | 21,999 | 35.4 | -4.2 | |
| Democrats | Ronald Dent | 8,844 | 14.2 | +14.2 | |
| Democratic Labor | Brian Handley | 3,010 | 4.8 | +0.9 | |
| Independent | Norman Holyoak | 667 | 1.1 | +1.1 | |
| Total formal votes | 62,170 | 97.1 | |||
| Informal votes | 1,847 | 2.9 | |||
| Turnout | 64,017 | 96.3 | |||
| Two-party-preferred result | |||||
| Liberal | Barry Simon | 34,077 | 54.8 | -1.9 | |
| Labor | Richard Elkington | 28,093 | 45.2 | +1.9 | |
| Liberal hold | Swing | -1.9 | |||
Melbourne
- This section is an excerpt from Electoral results for the Division of Melbourne § 1977
| Party | Candidate | Votes | % | ±% | |
|---|---|---|---|---|---|
| Labor | Ted Innes | 33,806 | 54.1 | -5.1 | |
| Liberal | Robert Fallshaw | 14,751 | 23.6 | -4.4 | |
| Democratic Labor | Desmond Burke | 6,868 | 11.0 | +1.9 | |
| Democrats | Veronica Schwarz | 5,576 | 8.9 | +8.9 | |
| Communist | Roger Wilson | 1,537 | 2.5 | +1.1 | |
| Total formal votes | 62,538 | 95.3 | |||
| Informal votes | 3,069 | 4.7 | |||
| Turnout | 65,607 | 90.9 | |||
| Two-party-preferred result | |||||
| Labor | Ted Innes | 61.8 | -0.9 | ||
| Liberal | Robert Fallshaw | 38.2 | +0.9 | ||
| Labor hold | Swing | -0.9 | |||
Melbourne Ports
- This section is an excerpt from Electoral results for the Division of Melbourne Ports § 1977
| Party | Candidate | Votes | % | ±% | |
|---|---|---|---|---|---|
| Labor | Clyde Holding | 31,308 | 50.0 | -5.5 | |
| Liberal | Daniel Hill | 20,627 | 33.0 | -5.0 | |
| Democrats | Valina Rainer | 6,147 | 9.8 | +9.8 | |
| Democratic Labor | Gordon Haberman | 4,495 | 7.2 | +4.5 | |
| Total formal votes | 62,577 | 96.1 | |||
| Informal votes | 2,567 | 3.9 | |||
| Turnout | 65,144 | 90.9 | |||
| Two-party-preferred result | |||||
| Labor | Clyde Holding | 55.5 | -2.8 | ||
| Liberal | Daniel Hill | 44.5 | +2.8 | ||
| Labor hold | Swing | -2.8 | |||
Murray
- This section is an excerpt from Electoral results for the Division of Murray § 1977
| Party | Candidate | Votes | % | ±% | |
|---|---|---|---|---|---|
| National Country | Bruce Lloyd | 32,809 | 52.7 | -17.1 | |
| Labor | Graeme Macartney | 10,573 | 17.0 | -7.3 | |
| Liberal | Robert Love | 9,230 | 14.9 | +14.9 | |
| Democrats | George Murray | 6,612 | 10.6 | +10.6 | |
| Democratic Labor | Patrick Payne | 2,915 | 4.7 | -1.1 | |
| Total formal votes | 62,139 | 97.3 | |||
| Informal votes | 1,749 | 2.7 | |||
| Turnout | 63,888 | 96.8 | |||
| Two-party-preferred result | |||||
| National Country | Bruce Lloyd | 76.2 | +1.1 | ||
| Labor | Graeme Macartney | 23.8 | -1.1 | ||
| National Country hold | Swing | +1.1 | |||
Scullin
- This section is an excerpt from Electoral results for the Division of Scullin § 1977
| Party | Candidate | Votes | % | ±% | |
|---|---|---|---|---|---|
| Labor | Harry Jenkins | 32,303 | 51.8 | -2.0 | |
| Liberal | Gerard Clarke | 20,849 | 33.5 | -4.7 | |
| Democrats | George Samargis | 5,835 | 9.4 | +9.4 | |
| Democratic Labor | Bernard McGrath | 3,330 | 5.3 | +0.2 | |
| Total formal votes | 62,317 | 96.4 | |||
| Informal votes | 2,314 | 3.6 | |||
| Turnout | 64,631 | 96.4 | |||
| Two-party-preferred result | |||||
| Labor | Harry Jenkins | 57.0 | +1.2 | ||
| Liberal | Gerard Clarke | 43.0 | -1.2 | ||
| Labor hold | Swing | +1.2 | |||
Wannon
- This section is an excerpt from Electoral results for the Division of Wannon § 1977
| Party | Candidate | Votes | % | ±% | |
|---|---|---|---|---|---|
| Liberal | Malcolm Fraser | 35,640 | 56.7 | -2.8 | |
| Labor | Andrew Frost | 19,483 | 31.0 | -4.2 | |
| Democratic Labor | John Casanova | 4,125 | 6.6 | +1.3 | |
| Democrats | Thelma Trayling | 3,617 | 5.8 | +5.8 | |
| Total formal votes | 62,865 | 98.5 | |||
| Informal votes | 968 | 1.5 | |||
| Turnout | 63,833 | 97.2 | |||
| Two-party-preferred result | |||||
| Liberal | Malcolm Fraser | 65.6 | +1.2 | ||
| Labor | Andrew Frost | 34.4 | -1.2 | ||
| Liberal hold | Swing | +1.2 | |||
Wills
- This section is an excerpt from Electoral results for the Division of Wills § 1977
| Party | Candidate | Votes | % | ±% | |
|---|---|---|---|---|---|
| Labor | Gordon Bryant | 38,456 | 57.6 | -0.5 | |
| Liberal | Thomas Burrowes | 17,597 | 26.4 | -8.4 | |
| Democrats | Vernon Weaver | 5,703 | 8.5 | +8.5 | |
| Democratic Labor | John Flint | 4,964 | 7.4 | +0.3 | |
| Total formal votes | 66,703 | 96.1 | |||
| Informal votes | 2,702 | 3.9 | |||
| Turnout | 69,442 | 94.5 | |||
| Two-party-preferred result | |||||
| Labor | Gordon Bryant | 62.6 | +3.8 | ||
| Liberal | Thomas Burrowes | 37.4 | -3.8 | ||
| Labor hold | Swing | +3.8 | |||
Queensland
| ||||||||||||||||||||||||||||||||||
All 19 Queensland seats in the House of Representatives 10 seats needed for a majority | ||||||||||||||||||||||||||||||||||
|---|---|---|---|---|---|---|---|---|---|---|---|---|---|---|---|---|---|---|---|---|---|---|---|---|---|---|---|---|---|---|---|---|---|---|
| ||||||||||||||||||||||||||||||||||
Bowman
- This section is an excerpt from Electoral results for the Division of Bowman § 1977
| Party | Candidate | Votes | % | ±% | |
|---|---|---|---|---|---|
| Liberal | David Jull | 31,544 | 50.0 | +3.0 | |
| Labor | Len Keogh | 25,078 | 39.7 | −2.3 | |
| Democrats | Bryan Grehan | 5,452 | 8.6 | +8.6 | |
| Progress | Martin Gant | 1,018 | 1.6 | +1.6 | |
| Total formal votes | 63,092 | 98.6 | |||
| Informal votes | 875 | 1.4 | |||
| Turnout | 63,967 | 95.3 | |||
| Two-party-preferred result | |||||
| Liberal | David Jull | 56.3 | −1.0 | ||
| Labor | Len Keogh | 43.7 | +1.0 | ||
| Liberal hold | Swing | −1.0 | |||
Brisbane
- This section is an excerpt from Electoral results for the Division of Brisbane § 1977
| Party | Candidate | Votes | % | ±% | |
|---|---|---|---|---|---|
| Liberal | Peter Johnson | 29,821 | 47.1 | −1.5 | |
| Labor | Manfred Cross | 26,103 | 41.3 | +0.5 | |
| Democrats | Joan Hadley | 6,299 | 10.0 | +10.0 | |
| Progress | John Steele | 1,038 | 1.6 | −0.2 | |
| Total formal votes | 63,261 | 98.4 | |||
| Informal votes | 1,022 | 1.6 | |||
| Turnout | 64,283 | 94.6 | |||
| Two-party-preferred result | |||||
| Liberal | Peter Johnson | 33,676 | 53.2 | −5.2 | |
| Labor | Manfred Cross | 29,585 | 46.8 | +5.2 | |
| Liberal hold | Swing | −5.2 | |||
Capricornia
- This section is an excerpt from Electoral results for the Division of Capricornia § 1977
| Party | Candidate | Votes | % | ±% | |
|---|---|---|---|---|---|
| Labor | Doug Everingham | 29,996 | 48.9 | +2.0 | |
| National Country | Colin Carige | 25,314 | 41.3 | +13.6 | |
| Liberal | Douglas Cuddy | 3,606 | 5.9 | −19.5 | |
| Democrats | Edward Batey | 2,217 | 3.6 | +3.6 | |
| Progress | Ronald Kitching | 207 | 0.3 | +0.3 | |
| Total formal votes | 61,340 | 98.7 | |||
| Informal votes | 784 | 1.3 | |||
| Turnout | 62,124 | 96.0 | |||
| Two-party-preferred result | |||||
| Labor | Doug Everingham | 51.2 | +2.7 | ||
| National Country | Colin Carige | 48.8 | −2.7 | ||
| Labor gain from National Country | Swing | +3.1 | |||
Darling Downs
- This section is an excerpt from Electoral results for the Division of Darling Downs § 1977
| Party | Candidate | Votes | % | ±% | |
|---|---|---|---|---|---|
| National Country | Tom McVeigh | 42,630 | 68.1 | +1.2 | |
| Labor | Robert Lingard | 18,505 | 29.6 | -3.5 | |
| Progress | David Proud | 1,482 | 2.4 | +2.4 | |
| Total formal votes | 62,617 | 98.9 | |||
| Informal votes | 677 | 1.1 | |||
| Turnout | 63,294 | 94.8 | |||
| Two-party-preferred result | |||||
| National Country | Tom McVeigh | 70.3 | +3.4 | ||
| Labor | Robert Lingard | 29.7 | -3.4 | ||
| National Country hold | Swing | +3.4 | |||
Dawson
- This section is an excerpt from Electoral results for the Division of Dawson § 1977
| Party | Candidate | Votes | % | ±% | |
|---|---|---|---|---|---|
| National Country | Ray Braithwaite | 34,624 | 55.9 | +3.1 | |
| Labor | Michael Goldsborough | 25,923 | 41.9 | -3.9 | |
| Progress | Frank Paull | 1,377 | 2.2 | +2.2 | |
| Total formal votes | 61,924 | 98.9 | |||
| Informal votes | 687 | 1.1 | |||
| Turnout | 62,611 | 94.9 | |||
| Two-party-preferred result | |||||
| National Country | Ray Braithwaite | 57.9 | +4.3 | ||
| Labor | Michael Goldsborough | 42.1 | -4.3 | ||
| National hold | Swing | +4.3 | |||
Fadden
- This section is an excerpt from Electoral results for the Division of Fadden § 1977
| Party | Candidate | Votes | % | ±% | |
|---|---|---|---|---|---|
| Labor | Clem Jones | 23,869 | 38.4 | +2.6 | |
| Liberal | Don Cameron | 20,909 | 33.6 | -22.3 | |
| National Country | James Shapcott | 10,910 | 17.5 | +12.5 | |
| Democrats | Janice Barber | 5,559 | 8.9 | +8.9 | |
| Independent | Melody Bond | 717 | 1.2 | +1.2 | |
| Progress | Peter Gautrey | 206 | 0.3 | +0.3 | |
| Total formal votes | 62,170 | 97.9 | |||
| Informal votes | 1,322 | 2.1 | |||
| Turnout | 63,492 | 94.8 | |||
| Two-party-preferred result | |||||
| Liberal | Don Cameron | 34,811 | 56.0 | -6.5 | |
| Labor | Clem Jones | 27,359 | 44.0 | +6.5 | |
| Liberal notional hold | Swing | -6.5 | |||
Fisher
- This section is an excerpt from Electoral results for the Division of Fisher § 1977
| Party | Candidate | Votes | % | ±% | |
|---|---|---|---|---|---|
| National Country | Evan Adermann | 37,247 | 59.6 | -6.4 | |
| Labor | Fay Price | 18,187 | 29.1 | -1.9 | |
| Democrats | Gillian Newman | 6,110 | 9.8 | +9.8 | |
| Progress | Gregory Gaffney | 983 | 1.6 | -1.4 | |
| Total formal votes | 62,527 | 98.6 | |||
| Informal votes | 861 | 1.4 | |||
| Turnout | 63,388 | 95.7 | |||
| Two-party-preferred result | |||||
| National Country | Evan Adermann | 65.9 | -2.5 | ||
| Labor | Fay Price | 34.1 | +2.5 | ||
| National Country hold | Swing | -2.5 | |||
Griffith
- This section is an excerpt from Electoral results for the Division of Griffith § 1977
| Party | Candidate | Votes | % | ±% | |
|---|---|---|---|---|---|
| Labor | Ben Humphreys | 28,736 | 47.0 | -1.1 | |
| Liberal | Ronald Palmer | 20,471 | 33.5 | -16.6 | |
| National Country | Stan Fas | 5,935 | 9.7 | +9.7 | |
| Democrats | Thomas Martin | 4,857 | 7.9 | +7.9 | |
| Independent | William Kenney | 591 | 1.0 | +1.0 | |
| Progress | Barrie Rundle | 514 | 0.8 | -1.0 | |
| Total formal votes | 61,104 | 96.8 | |||
| Informal votes | 2,025 | 3.2 | |||
| Turnout | 63,129 | 92.8 | |||
| Two-party-preferred result | |||||
| Labor | Ben Humphreys | 53.5 | +5.0 | ||
| Liberal | Ronald Palmer | 46.5 | -5.0 | ||
| Labor gain from Liberal | Swing | +5.0 | |||
Herbert
- This section is an excerpt from Electoral results for the Division of Herbert § 1977
| Party | Candidate | Votes | % | ±% | |
|---|---|---|---|---|---|
| Labor | Ted Lindsay | 22,668 | 37.0 | -5.5 | |
| Liberal | Gordon Dean | 20,559 | 33.5 | -24.0 | |
| National Country | Charles Arnold | 12,357 | 20.2 | +20.2 | |
| Democrats | Kenneth Kipping | 4,799 | 7.8 | +7.8 | |
| Independent | Grahame Wells | 418 | 0.7 | +0.7 | |
| Progress | Coral Finlay | 250 | 0.4 | +0.4 | |
| Independent | Peter Dunn | 236 | 0.4 | +0.4 | |
| Total formal votes | 61,287 | 98.4 | |||
| Informal votes | 1,014 | 1.6 | |||
| Turnout | 62,301 | 94.5 | |||
| Two-party-preferred result | |||||
| Liberal | Gordon Dean | 35,353 | 57.7 | +0.2 | |
| Labor | Ted Lindsay | 25,934 | 42.3 | -0.2 | |
| Liberal hold | Swing | +0.2 | |||
Kennedy
- This section is an excerpt from Electoral results for the Division of Kennedy § 1977
| Party | Candidate | Votes | % | ±% | |
|---|---|---|---|---|---|
| National Country | Bob Katter, Sr. | 33,453 | 61.4 | -2.1 | |
| Labor | Robert Gleeson | 17,814 | 32.7 | -2.0 | |
| Democrats | Raymond Oldham | 1,744 | 3.2 | +3.2 | |
| Progress | Vrettos Cominos | 987 | 1.8 | +0.0 | |
| Democrats | Marelle Hicks | 521 | 1.0 | +1.0 | |
| Total formal votes | 54,519 | 98.4 | |||
| Informal votes | 913 | 1.6 | |||
| Turnout | 55,432 | 92.9 | |||
| Two-party-preferred result | |||||
| National Country | Bob Katter, Sr. | 64.2 | -0.7 | ||
| Labor | Robert Gleeson | 35.8 | +0.7 | ||
| National Country hold | Swing | -0.7 | |||
Leichhardt
- This section is an excerpt from Electoral results for the Division of Leichhardt § 1977
| Party | Candidate | Votes | % | ±% | |
|---|---|---|---|---|---|
| National Country | David Thomson | 27,684 | 47.3 | +9.1 | |
| Labor | Bill Wood | 27,078 | 46.3 | -0.2 | |
| Democrats | James Foster | 3,785 | 6.5 | +6.5 | |
| Total formal votes | 58,547 | 98.6 | |||
| Informal votes | 846 | 1.4 | |||
| Turnout | 59,393 | 93.1 | |||
| Two-party-preferred result | |||||
| National Country | David Thomson | 29,803 | 50.9 | -1.5 | |
| Labor | Bill Wood | 28,744 | 49.1 | +1.5 | |
| National Country hold | Swing | -1.5 | |||
Lilley
- This section is an excerpt from Electoral results for the Division of Lilley § 1977
| Party | Candidate | Votes | % | ±% | |
|---|---|---|---|---|---|
| Liberal | Kevin Cairns | 30,542 | 48.6 | -3.3 | |
| Labor | Elaine Darling | 24,661 | 39.2 | -2.0 | |
| Democrats | Albert Mayne | 5,302 | 8.4 | +8.4 | |
| Independent | Frank Andrews | 1,970 | 3.1 | +3.1 | |
| Progress | Gary Sturgess | 386 | 0.6 | +0.6 | |
| Total formal votes | 62,861 | 98.3 | |||
| Informal votes | 1,056 | 1.7 | |||
| Turnout | 63,917 | 95.2 | |||
| Two-party-preferred result | |||||
| Liberal | Kevin Cairns | 56.0 | -1.2 | ||
| Labor | Elaine Darling | 44.0 | +1.2 | ||
| Liberal hold | Swing | -1.2 | |||
Maranoa
- This section is an excerpt from Electoral results for the Division of Maranoa § 1977
| Party | Candidate | Votes | % | ±% | |
|---|---|---|---|---|---|
| National Country | James Corbett | 41,466 | 68.7 | -1.9 | |
| Labor | John Kidman | 14,320 | 23.7 | -1.8 | |
| Democrats | Betty Whitworth | 2,012 | 3.3 | +3.3 | |
| Independent | Christopher Caldwell | 1,663 | 2.8 | +2.8 | |
| Progress | Maurice Fountain | 879 | 1.5 | -2.4 | |
| Total formal votes | 60,340 | 98.5 | |||
| Informal votes | 925 | 1.5 | |||
| Turnout | 61,265 | 95.3 | |||
| Two-party-preferred result | |||||
| National Country | James Corbett | 73.6 | -0.1 | ||
| Labor | John Kidman | 26.4 | +0.1 | ||
| National Country hold | Swing | -0.1 | |||
McPherson
- This section is an excerpt from Electoral results for the Division of McPherson § 1977
| Party | Candidate | Votes | % | ±% | |
|---|---|---|---|---|---|
| Liberal | Eric Robinson | 37,962 | 60.1 | -4.3 | |
| Labor | Jon Guerson | 17,419 | 27.6 | -4.5 | |
| Democrats | Leonard Fairman | 5,819 | 9.2 | +9.2 | |
| Independent | William Aabraham-Steer | 964 | 1.5 | +1.5 | |
| Progress | Neva Maxim | 951 | 1.5 | -2.0 | |
| Total formal votes | 63,115 | 98.2 | |||
| Informal votes | 1,138 | 1.8 | |||
| Turnout | 64,253 | 94.5 | |||
| Two-party-preferred result | |||||
| Liberal | Eric Robinson | 66.3 | -0.1 | ||
| Labor | Jon Guerson | 33.7 | +0.1 | ||
| Liberal hold | Swing | -0.1 | |||
Moreton
- This section is an excerpt from Electoral results for the Division of Moreton § 1977
| Party | Candidate | Votes | % | ±% | |
|---|---|---|---|---|---|
| Liberal | James Killen | 34,231 | 56.0 | -6.1 | |
| Labor | Barbara Robson | 20,864 | 34.1 | -1.6 | |
| Democrats | Dirk Plooy | 4,278 | 7.0 | +7.0 | |
| Independent | Graham Bell | 915 | 1.5 | +1.5 | |
| Progress | Frederick Drake | 887 | 1.4 | +1.4 | |
| Total formal votes | 61,175 | 98.5 | |||
| Informal votes | 903 | 1.5 | |||
| Turnout | 62,078 | 95.0 | |||
| Two-party-preferred result | |||||
| Liberal | James Killen | 62.0 | -0.7 | ||
| Labor | Barbara Robson | 38.0 | +0.7 | ||
| Liberal hold | Swing | -0.7 | |||
Oxley
- This section is an excerpt from Electoral results for the Division of Oxley § 1977
| Party | Candidate | Votes | % | ±% | |
|---|---|---|---|---|---|
| Labor | Bill Hayden | 36,084 | 55.0 | +4.8 | |
| Liberal | Robert Walker | 24,306 | 37.0 | +14.3 | |
| Democrats | Rowlynd Jones | 4,446 | 6.8 | +6.8 | |
| Progress | Neil Russell | 784 | 1.2 | -1.0 | |
| Total formal votes | 65,620 | 98.6 | |||
| Informal votes | 910 | 1.4 | |||
| Turnout | 66,530 | 95.6 | |||
| Two-party-preferred result | |||||
| Labor | Bill Hayden | 58.5 | +4.7 | ||
| Liberal | Robert Walker | 41.5 | +41.5 | ||
| Labor hold | Swing | +4.7 | |||
Petrie
- This section is an excerpt from Electoral results for the Division of Petrie § 1977
| Party | Candidate | Votes | % | ±% | |
|---|---|---|---|---|---|
| Liberal | John Hodges | 33,853 | 52.8 | -9.7 | |
| Labor | Gerard Molloy | 21,774 | 34.0 | -3.5 | |
| Democrats | Leslie Mundt | 7,648 | 11.9 | +11.9 | |
| Progress | Rodney Jeanneret | 823 | 1.3 | +1.3 | |
| Total formal votes | 64,098 | 98.7 | |||
| Informal votes | 819 | 1.3 | |||
| Turnout | 64,917 | 96.0 | |||
| Two-party-preferred result | |||||
| Liberal | John Hodges | 59.9 | -2.6 | ||
| Labor | Gerard Molloy | 40.1 | +2.6 | ||
| Liberal hold | Swing | -2.6 | |||
Ryan
- This section is an excerpt from Electoral results for the Division of Ryan § 1977
| Party | Candidate | Votes | % | ±% | |
|---|---|---|---|---|---|
| Liberal | John Moore | 38,331 | 61.0 | +17.8 | |
| Labor | Gailene Harrison | 20,866 | 33.2 | +1.3 | |
| Progress | Jili Boughen | 3,617 | 5.8 | +5.8 | |
| Total formal votes | 62,814 | 98.7 | |||
| Informal votes | 798 | 1.3 | |||
| Turnout | 63,612 | 95.0 | |||
| Two-party-preferred result | |||||
| Liberal | John Moore | 63.4 | -3.1 | ||
| Labor | Gailene Harrison | 36.6 | +3.1 | ||
| Liberal hold | Swing | -3.1 | |||
Wide Bay
- This section is an excerpt from Electoral results for the Division of Wide Bay § 1977
| Party | Candidate | Votes | % | ±% | |
|---|---|---|---|---|---|
| National Country | Clarrie Millar | 33,252 | 53.2 | -4.5 | |
| Labor | Frederick Faircloth | 23,276 | 36.8 | -2.5 | |
| Democrats | Douglas Mackenzie | 6,321 | 10.0 | +10.0 | |
| Total formal votes | 63,252 | 99.0 | |||
| Informal votes | 637 | 1.0 | |||
| Turnout | 63,889 | 95.9 | |||
| Two-party-preferred result | |||||
| National Country | Clarrie Millar | 58.2 | -1.1 | ||
| Labor | Frederick Faircloth | 41.8 | +1.1 | ||
| National Country hold | Swing | -1.1 | |||
South Australia
| ||||||||||||||||||||||||||||||||||
All 11 SA seats in the House of Representatives 6 seats needed for a majority | ||||||||||||||||||||||||||||||||||
|---|---|---|---|---|---|---|---|---|---|---|---|---|---|---|---|---|---|---|---|---|---|---|---|---|---|---|---|---|---|---|---|---|---|---|
| ||||||||||||||||||||||||||||||||||
Adelaide
- This section is an excerpt from Electoral results for the Division of Adelaide § 1977
| Party | Candidate | Votes | % | ±% | |
|---|---|---|---|---|---|
| Labor | Chris Hurford | 35,786 | 50.9 | +0.9 | |
| Liberal | George Basisovs | 26,974 | 38.3 | −4.2 | |
| Democrats | Geoffrey Stewart | 7,610 | 10.8 | +10.8 | |
| Total formal votes | 70,370 | 96.3 | |||
| Informal votes | 2,728 | 3.7 | |||
| Turnout | 73,098 | 93.9 | |||
| Two-party-preferred result | |||||
| Labor | Chris Hurford | 56.3 | +3.0 | ||
| Liberal | George Basisovs | 43.7 | −3.0 | ||
| Labor hold | Swing | +3.0 | |||
Barker
- This section is an excerpt from Electoral results for the Division of Barker § 1977
| Party | Candidate | Votes | % | ±% | |
|---|---|---|---|---|---|
| Liberal | James Porter | 43,129 | 63.4 | +3.9 | |
| Labor | Neil Richardson | 18,968 | 27.9 | −1.7 | |
| Democrats | Rodney Roberts | 5,952 | 8.7 | +8.7 | |
| Total formal votes | 68,049 | 97.2 | |||
| Informal votes | 1,980 | 2.8 | |||
| Turnout | 70,029 | 95.4 | |||
| Two-party-preferred result | |||||
| Liberal | James Porter | 67.8 | −0.5 | ||
| Labor | Rodney Roberts | 32.2 | +0.5 | ||
| Liberal hold | Swing | −0.5 | |||
Bonython
- This section is an excerpt from Electoral results for the Division of Bonython § 1977
| Party | Candidate | Votes | % | ±% | |
|---|---|---|---|---|---|
| Labor | Neal Blewett | 33,772 | 50.5 | +2.1 | |
| Liberal | Brian Marsden | 20,595 | 30.8 | −8.9 | |
| Democrats | John Longhurst | 12,457 | 18.6 | +18.6 | |
| Total formal votes | 66,824 | 96.0 | |||
| Informal votes | 2,814 | 4.0 | |||
| Turnout | 69,638 | 94.4 | |||
| Two-party-preferred result | |||||
| Labor | Neal Blewett | 59.8 | +6.1 | ||
| Liberal | Brian Marsden | 40.2 | −6.1 | ||
| Labor hold | Swing | +6.1 | |||
Boothby
- This section is an excerpt from Electoral results for the Division of Boothby § 1977
| Party | Candidate | Votes | % | ±% | |
|---|---|---|---|---|---|
| Liberal | John McLeay | 40,358 | 57.4 | −3.5 | |
| Labor | Mark Pickhaver | 18,117 | 25.8 | −2.2 | |
| Democrats | George Nimmo | 11,795 | 16.8 | +16.8 | |
| Total formal votes | 70,270 | 97.7 | |||
| Informal votes | 1,627 | 2.3 | |||
| Turnout | 71,897 | 95.0 | |||
| Two-party-preferred result | |||||
| Liberal | John McLeay | 65.8 | −3.5 | ||
| Labor | Mark Pickhaver | 34.2 | +3.5 | ||
| Liberal hold | Swing | −3.5 | |||
Grey
- This section is an excerpt from Electoral results for the Division of Grey § 1977
| Party | Candidate | Votes | % | ±% | |
|---|---|---|---|---|---|
| Labor | Laurie Wallis | 31,221 | 46.7 | +0.7 | |
| Liberal | John Oswald | 26,166 | 39.2 | -10.6 | |
| National Country | John Henderson | 6,065 | 9.1 | +9.1 | |
| Democrats | Ronald Moulds | 3,331 | 5.0 | +5.0 | |
| Total formal votes | 66,783 | 96.9 | |||
| Informal votes | 2,152 | 3.1 | |||
| Turnout | 68,935 | 94.8 | |||
| Two-party-preferred result | |||||
| Labor | Laurie Wallis | 33,424 | 50.0 | +2.9 | |
| Liberal | John Oswald | 33,359 | 50.0 | -2.9 | |
| Labor notional gain from Liberal | Swing | +2.9 | |||
Hawker
- This section is an excerpt from Electoral results for the Division of Hawker § 1977
| Party | Candidate | Votes | % | ±% | |
|---|---|---|---|---|---|
| Labor | Ralph Jacobi | 31,685 | 44.8 | -2.2 | |
| Liberal | Steele Hall | 31,062 | 44.0 | -2.4 | |
| Democrats | Bruce Miels | 7,190 | 10.2 | +10.2 | |
| Independent | Warren Wallace | 724 | 1.0 | +1.0 | |
| Total formal votes | 70,661 | 97.0 | |||
| Informal votes | 2,206 | 3.0 | |||
| Turnout | 72,867 | 94.3 | |||
| Two-party-preferred result | |||||
| Labor | Ralph Jacobi | 35,760 | 50.6 | +2.0 | |
| Liberal | Steele Hall | 34,901 | 49.4 | -2.0 | |
| Labor notional gain from Liberal | Swing | +2.0 | |||
Ralph Jacobi (Labor) was the sitting member, however the effect of the 1977 redistribution was to give the Liberals a notional majority of 1.4%.[5]
Hindmarsh
- This section is an excerpt from Electoral results for the Division of Hindmarsh § 1977
| Party | Candidate | Votes | % | ±% | |
|---|---|---|---|---|---|
| Labor | Clyde Cameron | 38,976 | 55.2 | +0.8 | |
| Liberal | Gregory Molfetas | 22,962 | 32.5 | -6.8 | |
| Democrats | James Evans | 8,628 | 12.2 | +12.2 | |
| Total formal votes | 70,566 | 95.8 | |||
| Informal votes | 3,061 | 4.2 | |||
| Turnout | 73,627 | 95.4 | |||
| Two-party-preferred result | |||||
| Labor | Clyde Cameron | 61.3 | +5.0 | ||
| Liberal | Gregory Molfetas | 38.7 | -5.0 | ||
| Labor hold | Swing | +5.0 | |||
Kingston
- This section is an excerpt from Electoral results for the Division of Kingston § 1977
| Party | Candidate | Votes | % | ±% | |
|---|---|---|---|---|---|
| Liberal | Grant Chapman | 31,254 | 45.3 | -3.0 | |
| Labor | Richard Gun | 28,919 | 41.9 | +0.0 | |
| Democrats | Christopher Harte | 8,810 | 12.8 | +12.8 | |
| Total formal votes | 68,983 | 97.6 | |||
| Informal votes | 1,697 | 2.4 | |||
| Turnout | 70,680 | 96.2 | |||
| Two-party-preferred result | |||||
| Liberal | Grant Chapman | 35,732 | 51.8 | -4.8 | |
| Labor | Richard Gun | 33,251 | 48.2 | +4.8 | |
| Liberal hold | Swing | -4.8 | |||
Port Adelaide
- This section is an excerpt from Electoral results for the Division of Port Adelaide § 1977
| Party | Candidate | Votes | % | ±% | |
|---|---|---|---|---|---|
| Labor | Mick Young | 40,497 | 60.0 | -0.1 | |
| Liberal | Jean Lawrie | 20,506 | 30.4 | -4.7 | |
| Democrats | David Wade | 4,906 | 7.3 | +7.3 | |
| Communist | Donald Sutherland | 1,575 | 2.3 | +2.3 | |
| Total formal votes | 67,484 | 94.5 | |||
| Informal votes | 3,914 | 5.5 | |||
| Turnout | 71,398 | 94.7 | |||
| Two-party-preferred result | |||||
| Labor | Mick Young | 65.7 | +4.4 | ||
| Liberal | Jean Lawrie | 34.3 | -4.4 | ||
| Labor hold | Swing | +4.4 | |||
Sturt
- This section is an excerpt from Electoral results for the Division of Sturt § 1977
| Party | Candidate | Votes | % | ±% | |
|---|---|---|---|---|---|
| Liberal | Ian Wilson | 35,300 | 51.0 | -3.7 | |
| Labor | Ann Pengelly | 24,639 | 35.6 | -2.2 | |
| Democrats | Dean Bendall | 9,335 | 13.5 | +13.5 | |
| Total formal votes | 69,274 | 96.9 | |||
| Informal votes | 2,235 | 3.1 | |||
| Turnout | 71,509 | 95.6 | |||
| Two-party-preferred result | |||||
| Liberal | Ian Wilson | 57.3 | -2.5 | ||
| Labor | Ann Pengelly | 35.6 | +2.5 | ||
| Liberal hold | Swing | -2.5 | |||
Wakefield
- This section is an excerpt from Electoral results for the Division of Wakefield § 1977
| Party | Candidate | Votes | % | ±% | |
|---|---|---|---|---|---|
| Liberal | Geoffrey Giles | 42,077 | 61.9 | -4.7 | |
| Labor | Denis Crisp | 20,303 | 29.9 | +4.2 | |
| Democrats | Kenneth Maguire | 5,564 | 8.2 | +8.2 | |
| Total formal votes | 67,944 | 97.1 | |||
| Informal votes | 2,047 | 2.9 | |||
| Turnout | 69,991 | 96.2 | |||
| Two-party-preferred result | |||||
| Liberal | Geoffrey Giles | 66.0 | -6.4 | ||
| Labor | Denis Crisp | 34.0 | +6.4 | ||
| Liberal hold | Swing | -6.4 | |||
Western Australia
| ||||||||||||||||||||||||||||||||||
All 10 WA seats in the House of Representatives 5 seats needed for a majority | ||||||||||||||||||||||||||||||||||
|---|---|---|---|---|---|---|---|---|---|---|---|---|---|---|---|---|---|---|---|---|---|---|---|---|---|---|---|---|---|---|---|---|---|---|
| ||||||||||||||||||||||||||||||||||
Canning
- This section is an excerpt from Electoral results for the Division of Canning § 1977
| Party | Candidate | Votes | % | ±% | |
|---|---|---|---|---|---|
| Liberal | Mel Bungey | 29,503 | 48.2 | +3.8 | |
| Labor | Charles Savage | 16,491 | 26.9 | -8.1 | |
| National Country | Marie Dilley | 7,447 | 12.2 | -8.3 | |
| Democrats | Velibor Debeljakovic | 6,206 | 10.1 | +10.1 | |
| Progress | Douglas Joyce | 822 | 1.3 | +1.3 | |
| Independent | John English | 725 | 1.2 | +1.2 | |
| Total formal votes | 61,194 | 96.2 | |||
| Informal votes | 2,389 | 3.8 | |||
| Turnout | 63,583 | 95.5 | |||
| Two-party-preferred result | |||||
| Liberal | Mel Bungey | 66.3 | +3.1 | ||
| Labor | Charles Savage | 33.7 | -3.1 | ||
| Liberal hold | Swing | +3.1 | |||
Curtin
- This section is an excerpt from Electoral results for the Division of Curtin § 1977
| Party | Candidate | Votes | % | ±% | |
|---|---|---|---|---|---|
| Liberal | Victor Garland | 38,988 | 58.8 | −7.5 | |
| Labor | Patricia Giles | 16,207 | 24.4 | −9.3 | |
| Democrats | Richard Bunting | 9,522 | 14.4 | +14.4 | |
| Progress | James MacDonald | 1,628 | 2.5 | +2.5 | |
| Total formal votes | 66,345 | 97.6 | |||
| Informal votes | 1,654 | 2.4 | |||
| Turnout | 67,999 | 93.3 | |||
| Two-party-preferred result | |||||
| Liberal | Victor Garland | 68.8 | +2.5 | ||
| Labor | Patricia Giles | 31.2 | −2.5 | ||
| Liberal hold | Swing | +2.5 | |||
Forrest
- This section is an excerpt from Electoral results for the Division of Forrest § 1977
| Party | Candidate | Votes | % | ±% | |
|---|---|---|---|---|---|
| Liberal | Peter Drummond | 30,723 | 48.4 | -8.1 | |
| Labor | Allan Drake-Brockman | 17,640 | 27.8 | -5.0 | |
| National Country | John Gardiner | 8,183 | 12.9 | +3.6 | |
| Democrats | Donald Stewart | 4,466 | 7.0 | +7.0 | |
| Progress | Reginald Crabb | 2,495 | 3.9 | +3.9 | |
| Total formal votes | 63,507 | 96.8 | |||
| Informal votes | 2,114 | 3.2 | |||
| Turnout | 65,621 | 96.2 | |||
| Two-party-preferred result | |||||
| Liberal | Peter Drummond | 65.7 | +0.1 | ||
| Labor | Allan Drake-Brockman | 34.3 | -0.1 | ||
| Liberal hold | Swing | +0.1 | |||
Fremantle
- This section is an excerpt from Electoral results for the Division of Fremantle § 1977
| Party | Candidate | Votes | % | ±% | |
|---|---|---|---|---|---|
| Labor | John Dawkins | 29,700 | 45.1 | -6.5 | |
| Liberal | Peter Ramshaw | 27,372 | 41.6 | -6.8 | |
| Democrats | John Kernott | 6,491 | 9.9 | +9.9 | |
| Communist | Vic Slater | 1,305 | 2.0 | +2.0 | |
| Progress | David Lavater | 957 | 1.5 | +1.5 | |
| Total formal votes | 65,825 | 96.7 | |||
| Informal votes | 2,235 | 3.3 | |||
| Turnout | 68,060 | 95.3 | |||
| Two-party-preferred result | |||||
| Labor | John Dawkins | 34,113 | 51.8 | +0.2 | |
| Liberal | Peter Ramshaw | 31,712 | 48.2 | -0.2 | |
| Labor hold | Swing | +0.2 | |||
Kalgoorlie
- This section is an excerpt from Electoral results for the Division of Kalgoorlie § 1977
| Party | Candidate | Votes | % | ±% | |
|---|---|---|---|---|---|
| Liberal | Mick Cotter | 27,512 | 49.3 | -4.4 | |
| Labor | Brian Conway | 20,862 | 37.4 | -5.8 | |
| Democrats | Edwin Routley | 3,534 | 6.3 | +6.3 | |
| National Country | Squire Fletcher | 2,399 | 4.3 | +4.3 | |
| Progress | Graham Mills | 1,529 | 2.7 | -0.4 | |
| Total formal votes | 55,836 | 96.8 | |||
| Informal votes | 1,855 | 3.2 | |||
| Turnout | 57,691 | 90.5 | |||
| Two-party-preferred result | |||||
| Liberal | Mick Cotter | 58.5 | +2.3 | ||
| Labor | Brian Conway | 41.5 | -2.3 | ||
| Liberal hold | Swing | +2.3 | |||
Moore
- This section is an excerpt from Electoral results for the Division of Moore § 1977
| Party | Candidate | Votes | % | ±% | |
|---|---|---|---|---|---|
| Liberal | John Hyde | 29,516 | 47.8 | -6.4 | |
| Labor | James Hansen | 14,707 | 23.8 | -8.6 | |
| Democrats | Patricia Edward | 7,540 | 12.2 | +12.2 | |
| National Country | Roy Clarke | 7,530 | 12.2 | -1.2 | |
| Progress | Maurice Brockwell | 2,426 | 3.9 | +3.9 | |
| Total formal votes | 61,719 | 96.7 | |||
| Informal votes | 2,116 | 3.3 | |||
| Turnout | 63,835 | 94.9 | |||
| Two-party-preferred result | |||||
| Liberal | John Hyde | 67.9 | +2.4 | ||
| Labor | James Hansen | 32.1 | -2.4 | ||
| Liberal hold | Swing | +2.4 | |||
Perth
- This section is an excerpt from Electoral results for the Division of Perth § 1977
| Party | Candidate | Votes | % | ±% | |
|---|---|---|---|---|---|
| Liberal | Ross McLean | 31,944 | 50.8 | -5.6 | |
| Labor | James Moiler | 22,177 | 35.3 | -6.9 | |
| Democrats | Thomas Garrick | 6,153 | 9.8 | +9.8 | |
| Progress | Lawrence Curtis | 2,591 | 4.1 | +4.1 | |
| Total formal votes | 62,865 | 96.5 | |||
| Informal votes | 2,266 | 3.5 | |||
| Turnout | 65,131 | 95.1 | |||
| Two-party-preferred result | |||||
| Liberal | Ross McLean | 59.5 | -3.0 | ||
| Labor | James Moiler | 40.5 | +3.0 | ||
| Liberal hold | Swing | -3.0 | |||
Stirling
- This section is an excerpt from Electoral results for the Division of Stirling § 1977
| Party | Candidate | Votes | % | ±% | |
|---|---|---|---|---|---|
| Liberal | Ian Viner | 32,558 | 50.2 | -7.7 | |
| Labor | Graham Reece | 20,786 | 32.1 | -7.2 | |
| Democrats | Scott Christie | 9,591 | 14.8 | +14.8 | |
| Progress | James Jamieson | 1,876 | 2.9 | +0.1 | |
| Total formal votes | 64,811 | 97.2 | |||
| Informal votes | 1,850 | 2.8 | |||
| Turnout | 66,661 | 94.7 | |||
| Two-party-preferred result | |||||
| Liberal | Ian Viner | 59.7 | +0.4 | ||
| Labor | Graham Reece | 40.3 | -0.4 | ||
| Liberal hold | Swing | +0.4 | |||
Swan
- This section is an excerpt from Electoral results for the Division of Swan § 1977
| Party | Candidate | Votes | % | ±% | |
|---|---|---|---|---|---|
| Liberal | John Martyr | 27,385 | 42.9 | -3.3 | |
| Labor | Patricia Fowkes | 25,276 | 39.6 | -10.2 | |
| Democrats | Hubert Lennerts | 7,526 | 11.8 | +11.8 | |
| Independent | William Deller | 2,474 | 3.9 | +3.9 | |
| Progress | Bryan Scott-Courtland | 1,194 | 1.9 | +1.9 | |
| Total formal votes | 63,855 | 95.6 | |||
| Informal votes | 2,936 | 4.4 | |||
| Turnout | 66,791 | 95.1 | |||
| Two-party-preferred result | |||||
| Liberal | John Martyr | 32,267 | 50.5 | +1.0 | |
| Labor | Patricia Fowkes | 31,588 | 49.5 | -1.0 | |
| Liberal gain from Labor | Swing | +1.0 | |||
Tangney
- This section is an excerpt from Electoral results for the Division of Tangney § 1977
| Party | Candidate | Votes | % | ±% | |
|---|---|---|---|---|---|
| Liberal | Peter Shack | 32,198 | 48.7 | -7.7 | |
| Labor | Duncan Graham | 21,947 | 33.2 | -6.7 | |
| Democrats | Geoffrey Taylor | 9,561 | 14.5 | +14.5 | |
| Progress | Geoffrey McNeil | 2,361 | 3.6 | -0.2 | |
| Total formal votes | 66,067 | 96.9 | |||
| Informal votes | 2,145 | 3.1 | |||
| Turnout | 68,212 | 95.0 | |||
| Two-party-preferred result | |||||
| Liberal | Peter Shack | 58.4 | -0.2 | ||
| Labor | Duncan Graham | 41.6 | +0.2 | ||
| Liberal hold | Swing | -0.2 | |||
Tasmania
| ||||||||||||||||||||||||||||||||||
All 5 Tasmanian seats in the House of Representatives 3 seats needed for a majority | ||||||||||||||||||||||||||||||||||
|---|---|---|---|---|---|---|---|---|---|---|---|---|---|---|---|---|---|---|---|---|---|---|---|---|---|---|---|---|---|---|---|---|---|---|
| ||||||||||||||||||||||||||||||||||
Bass
- This section is an excerpt from Electoral results for the Division of Bass § 1977
| Party | Candidate | Votes | % | ±% | |
|---|---|---|---|---|---|
| Liberal | Kevin Newman | 28,022 | 55.7 | −7.4 | |
| Labor | Mary Willey | 18,447 | 36.7 | +2.1 | |
| Democrats | Dennis Cartledge | 3,795 | 7.6 | +7.6 | |
| Total formal votes | 50,264 | 97.3 | |||
| Informal votes | 1,412 | 2.7 | |||
| Turnout | 51,676 | 96.3 | |||
| Two-party-preferred result | |||||
| Liberal | Kevin Newman | 60.0 | −4.1 | ||
| Labor | Mary Willey | 40.0 | +4.1 | ||
| Liberal hold | Swing | −4.1 | |||
Braddon
- This section is an excerpt from Electoral results for the Division of Braddon § 1977
| Party | Candidate | Votes | % | ±% | |
|---|---|---|---|---|---|
| Liberal | Ray Groom | 27,384 | 58.2 | +5.3 | |
| Labor | Duncan Kerr | 19,656 | 41.8 | −3.6 | |
| Total formal votes | 47,040 | 96.8 | |||
| Informal votes | 1,535 | 3.2 | |||
| Turnout | 48,575 | 96.3 | |||
| Liberal hold | Swing | +4.4 | |||
Denison
- This section is an excerpt from Electoral results for the Division of Denison § 1977
| Party | Candidate | Votes | % | ±% | |
|---|---|---|---|---|---|
| Liberal | Michael Hodgman | 26,418 | 50.9 | -2.3 | |
| Labor | John Coates | 23,184 | 44.7 | -0.1 | |
| Democrats | Robert McFie | 2,303 | 4.4 | +4.4 | |
| Total formal votes | 51,905 | 98.0 | |||
| Informal votes | 1,047 | 2.0 | |||
| Turnout | 52,952 | 96.4 | |||
| Two-party-preferred result | |||||
| Liberal | Michael Hodgman | 53.1 | -1.7 | ||
| Labor | John Coates | 46.9 | +1.7 | ||
| Liberal hold | Swing | -1.7 | |||
Franklin
- This section is an excerpt from Electoral results for the Division of Franklin § 1977
| Party | Candidate | Votes | % | ±% | |
|---|---|---|---|---|---|
| Liberal | Bruce Goodluck | 26,797 | 54.7 | +5.3 | |
| Labor | Peter Colquhoun | 22,175 | 45.3 | -2.4 | |
| Total formal votes | 48,972 | 97.6 | |||
| Informal votes | 1,222 | 2.4 | |||
| Turnout | 50,194 | 97.3 | |||
| Liberal hold | Swing | +2.9 | |||
Wilmot
- This section is an excerpt from Electoral results for the Division of Wilmot § 1977
| Party | Candidate | Votes | % | ±% | |
|---|---|---|---|---|---|
| Liberal | Max Burr | 26,066 | 53.6 | +1.0 | |
| Labor | David Llewellyn | 20,415 | 42.0 | -2.2 | |
| Democrats | Leon Gourlay | 2,157 | 4.4 | +4.4 | |
| Total formal votes | 48,638 | 97.3 | |||
| Informal votes | 1,363 | 2.7 | |||
| Turnout | 50,001 | 97.1 | |||
| Two-party-preferred result | |||||
| Liberal | Max Burr | 55.8 | +0.5 | ||
| Labor | David Llewellyn | 44.2 | -0.5 | ||
| Liberal hold | Swing | +0.5 | |||
Australian Capital Territory
| ||||||||||||||||||||||||||||||||||
All 2 ACT seats in the House of Representatives 1 seats needed for a majority | ||||||||||||||||||||||||||||||||||
|---|---|---|---|---|---|---|---|---|---|---|---|---|---|---|---|---|---|---|---|---|---|---|---|---|---|---|---|---|---|---|---|---|---|---|
| ||||||||||||||||||||||||||||||||||
Canberra
- This section is an excerpt from Electoral results for the Division of Canberra § 1977
| Party | Candidate | Votes | % | ±% | |
|---|---|---|---|---|---|
| Liberal | John Haslem | 24,578 | 43.2 | −6.2 | |
| Labor | Henry Lawrence | 23,214 | 40.8 | −4.4 | |
| Democrats | John Bellhouse | 8,544 | 15.0 | +15.0 | |
| Independent | Oleg Kavunenko | 534 | 0.9 | +0.9 | |
| Total formal votes | 56,870 | 97.8 | |||
| Informal votes | 1,289 | 2.2 | |||
| Turnout | 58,159 | 93.2 | |||
| Two-party-preferred result | |||||
| Liberal | John Haslem | 28,976 | 51.0 | −2.3 | |
| Labor | Henry Lawrence | 27,894 | 49.0 | +2.3 | |
| Liberal hold | Swing | −2.3 | |||
Fraser
- This section is an excerpt from Electoral results for the Division of Fraser (Australian Capital Territory) § 1977
| Party | Candidate | Votes | % | ±% | |
|---|---|---|---|---|---|
| Labor | Ken Fry | 34,609 | 59.4 | +8.3 | |
| Liberal | George Mailath | 23,612 | 40.6 | −4.7 | |
| Total formal votes | 58,221 | 97.5 | |||
| Informal votes | 1,522 | 2.5 | |||
| Turnout | 59,743 | 92.0 | |||
| Labor hold | Swing | +7.4 | |||
Northern Territory
| ||||||||||||||||||||||||||||||||||
Division of Northern Territory | ||||||||||||||||||||||||||||||||||
|---|---|---|---|---|---|---|---|---|---|---|---|---|---|---|---|---|---|---|---|---|---|---|---|---|---|---|---|---|---|---|---|---|---|---|
| ||||||||||||||||||||||||||||||||||
- This section is an excerpt from Electoral results for the Division of Northern Territory § 1977
| Party | Candidate | Votes | % | ±% | |
|---|---|---|---|---|---|
| Country Liberal | Sam Calder | 16,462 | 50.0 | +3.1 | |
| Labor | John Waters | 14,811 | 42.6 | -1.1 | |
| Democrats | Josephine Read | 2,478 | 7.1 | +7.1 | |
| Progress | Ian Smith | 987 | 2.8 | +2.8 | |
| Total formal votes | 34,738 | 96.5 | |||
| Informal votes | 1,244 | 3.5 | |||
| Turnout | 35,982 | 81.2 | |||
| Two-party-preferred result | |||||
| Country Liberal | Sam Calder | 18,250 | 52.5 | -2.4 | |
| Labor | John Waters | 16,488 | 47.5 | +2.4 | |
| Country Liberal hold | Swing | -2.4 | |||
See also
References
- "1977 House of Representatives". Psephos Adam Carr's Election Archive. Retrieved 29 May 2022.
- "1977 House of Representatives: NSW". Psephos Adam Carr's Election Archive. Retrieved 29 May 2022.
- "1977 House of Representatives: Victoria". Psephos Adam Carr's Election Archive. Retrieved 29 May 2022.
- "1977 House of Representatives: Queensland". Psephos Adam Carr's Election Archive. Retrieved 29 May 2022.
- "1977 House of Representatives: South Australia". Psephos Adam Carr's Election Archive. Retrieved 29 May 2022.
- "1977 House of Representatives: Western Australia". Psephos Adam Carr's Election Archive. Retrieved 29 May 2022.
- "1977 House of Representatives: Tasmania". Psephos Adam Carr's Election Archive. Retrieved 29 May 2022.
- "1977 House of Representatives: Australian Capital Territory". Psephos Adam Carr's Election Archive. Retrieved 29 May 2022.
- "1977 House of Representatives: Northern Territory". Psephos Adam Carr's Election Archive. Retrieved 29 May 2022.
| House of Representatives | |||
|---|---|---|---|
| Senate | |||
| By-elections | |||
This article is issued from Wikipedia. The text is licensed under Creative Commons - Attribution - Sharealike. Additional terms may apply for the media files.