Results of the 1987 Australian federal election (House of Representatives)
The following tables show results for the Australian House of Representatives at the 1987 federal election held on 11 July 1987.[1][2]
| ||||||||||||||||||||||||||||||||||||||||
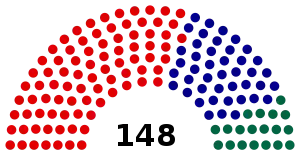
All 148 seats in the House of Representatives 75 seats were needed for a majority in the House All 76 seats in the Senate | ||||||||||||||||||||||||||||||||||||||||
|---|---|---|---|---|---|---|---|---|---|---|---|---|---|---|---|---|---|---|---|---|---|---|---|---|---|---|---|---|---|---|---|---|---|---|---|---|---|---|---|---|
| Registered | 10,353,213 | |||||||||||||||||||||||||||||||||||||||
| Turnout | 9,715,440 (93.84%) ( | |||||||||||||||||||||||||||||||||||||||
| ||||||||||||||||||||||||||||||||||||||||
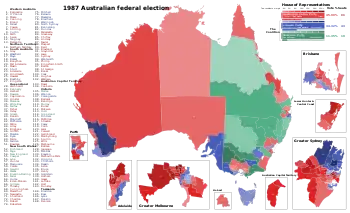 Results by division for the House of Representatives, shaded by winning party's margin of victory. | ||||||||||||||||||||||||||||||||||||||||
| ||||||||||||||||||||||||||||||||||||||||


1987 Australian federal election |
|---|
| National results |
| State and territory results |
|
|
Australia
| Party | Votes | % | Swing | Seats | Change | |||
|---|---|---|---|---|---|---|---|---|
| Liberal | 3,169,061 | 34.32 | +0.26 | 43 | ||||
| National | 1,048,249 | 11.35 | +0.72 | 19 | ||||
| Country Liberal | 21,668 | 0.23 | −0.09 | 0 | ||||
| Liberal/National Coalition | 4,238,978 | 45.90 | +0.89 | 62 | ||||
| Labor | 4,238,663 | 45.90 | −1.65 | 86 | ||||
| Democrats | 557,262 | 6.00 | +0.55 | |||||
| Total | 9,235,086 | 148 | ||||||
| Two-party-preferred vote | ||||||||
| Labor | 4,693,099 | 50.83 | −0.94 | 86 | ||||
| Liberal/National coalition | 4,540,009 | 49.17 | +0.94 | 62 | ||||
| Invalid/blank votes | 480,354 | 4.9 | –1.9 | |||||
| Turnout | 9,715,440 | 93.8 | ||||||
| Registered voters | 10,353,229 | |||||||
| Source: Federal Election Results 1949-1993 | ||||||||
States
New South Wales
| ||||||||||||||||||||||||||||||||||
All 51 New South Wales seats in the Australian House of Representatives and all 12 seats in the Australian Senate | ||||||||||||||||||||||||||||||||||
|---|---|---|---|---|---|---|---|---|---|---|---|---|---|---|---|---|---|---|---|---|---|---|---|---|---|---|---|---|---|---|---|---|---|---|
| ||||||||||||||||||||||||||||||||||
| Party | Votes | % | Swing | Seats | Change | ||
|---|---|---|---|---|---|---|---|
| Liberal | 1,059,597 | 33.26 | +0.5 | 13 | |||
| National | 375,443 | 11.78 | +1.25 | 10 | |||
| Liberal/National Coalition | 1,435,040 | 45.04 | +1.74 | 23 | |||
| Labor | 1,438,985 | 45.17 | –3.09 | 28 | |||
| Democrats | 201,924 | 6.34 | +0.43 | ||||
| Independent | 107,029 | 3.36 | +1.19 | ||||
| Unite Australia | 1,837 | 0.06 | +0.06 | ||||
| Nuclear Disarmament | 1,105 | 0.03 | +0.18 | ||||
| Communist | 1,213 | 0.04 | –0.01 | ||||
| Total | 3,185,920 | 51 | |||||
| Two-party-preferred vote | |||||||
| Labor | 1,602,013 | 50.29 | –2.62 | ||||
| Liberal/National Coalition | 1,583,465 | 49.71 | +2.62 | ||||
| Invalid/blank votes | 152,696 | 4.6 | –1.6 | ||||
| Turnout | 3,338,616 | 93.9 | |||||
| Registered voters | 3,555,061 | ||||||
| Source: Psephos Adam Carr's Election Archive 1987 | |||||||
Victoria
| ||||||||||||||||||||||||||||||||||
All 39 Victoria seats in the Australian House of Representatives and all 12 seats in the Australian Senate | ||||||||||||||||||||||||||||||||||
|---|---|---|---|---|---|---|---|---|---|---|---|---|---|---|---|---|---|---|---|---|---|---|---|---|---|---|---|---|---|---|---|---|---|---|
| ||||||||||||||||||||||||||||||||||
| Party | Votes | % | Swing | Seats | Change | ||
|---|---|---|---|---|---|---|---|
| Liberal | 922,680 | 38.02 | 1.14 | 12 | |||
| National | 154,088 | 6.35 | –0.02 | 3 | |||
| Liberal/National Coalition | 1,076,768 | 44.37 | 1.13 | 15 | |||
| Labor | 1,139,337 | 46.95 | –1.99 | 24 | |||
| Democrats | 163,160 | 6.35 | 0.35 | ||||
| Independent | 34,491 | 6.72 | –0.73 | ||||
| Unite Australia | 5,427 | 1.42 | |||||
| Pensioner | 3,346 | 0.22 | 0.02 | ||||
| Democratic Labor | 3,334 | 0.14 | –4.90 | ||||
| Socialist Workers | 1,097 | 0.14 | –0.02 | ||||
| Total | 2,426,960 | 39 | |||||
| Two-party-preferred vote | |||||||
| Labor | 1,268,894 | 52.31 | –0.78 | 24 | |||
| Liberal/National Coalition | 1,157,037 | 47.69 | +0.78 | 15 | |||
| Invalid/blank votes | 134,415 | 5.25 | –2.95 | ||||
| Turnout | 2,561,375 | 95.1 | |||||
| Registered voters | 2,698,034 | ||||||
| Source: Psephos Adam Carr's Election Archive 1987 | |||||||
Queensland
| ||||||||||||||||||||||||||||||||||
All 39 Queensland seats in the Australian House of Representatives and all 12 seats in the Australian Senate | ||||||||||||||||||||||||||||||||||
|---|---|---|---|---|---|---|---|---|---|---|---|---|---|---|---|---|---|---|---|---|---|---|---|---|---|---|---|---|---|---|---|---|---|---|
| ||||||||||||||||||||||||||||||||||
| Party | Votes | % | Swing | Seats | Change | ||
|---|---|---|---|---|---|---|---|
| National | 438,627 | 28.85 | -2.85 | 6 | |||
| Liberal | 319,607 | 21.02 | 1.86 | 5 | |||
| Liberal/National Coalition | 758,234 | 49.87 | -0.99 | 11 | |||
| Labor | 683,640 | 44.96 | 0.90 | 13 | |||
| Democrats | 74,215 | 4.88 | 0.06 | ||||
| Independent | 2,684 | 0.18 | -0.04 | ||||
| Nuclear Disarmament | 1,718 | 0.11 | 0.00 | ||||
| Total | 1,520,491 | 24 | |||||
| Two-party-preferred vote | |||||||
| Labor | 749,834 | 49.32 | 49.32 | 13 | |||
| Liberal/National Coalition | 770,515 | 50.68 | 49.32 | 11 | |||
| Invalid/blank votes | 53,622 | 3.41 | -1.19 | ||||
| Turnout | 1,574,113 | 92.18 | |||||
| Registered voters | 1,707,701 | ||||||
| Source: Psephos Adam Carr's Election Archive 1987 | |||||||
Western Australia
| ||||||||||||||||||||||||||||||||||
All 13 Western Australia seats in the Australian House of Representatives and all 12 seats in the Australian Senate | ||||||||||||||||||||||||||||||||||
|---|---|---|---|---|---|---|---|---|---|---|---|---|---|---|---|---|---|---|---|---|---|---|---|---|---|---|---|---|---|---|---|---|---|---|
| ||||||||||||||||||||||||||||||||||
| Party | Votes | % | Swing | Seats | Change | ||
|---|---|---|---|---|---|---|---|
| Liberal | 332,266 | 41.79 | -3.95 | 4 | |||
| National | 54,871 | 6.90 | 5.59 | ||||
| Liberal/National Coalition | 387,137 | 48.69 | 1.64 | 4 | |||
| Labor | 377,493 | 47.48 | -0.71 | 9 | |||
| Democrats | 27,302 | 3.43 | -0.27 | ||||
| Independents | 3,112 | 0.39 | -0.12 | ||||
| Total | 795,044 | 13 | |||||
| Two-party-preferred vote | |||||||
| Labor | 404,751 | 50.91 | -0.05 | 9 | |||
| Liberal/National Coalition | 390,232 | 49.09 | 0.05 | 4 | |||
| Invalid/blank votes | 55,776 | 6.56 | -0.86 | ||||
| Turnout | 850,820 | 93.84 | |||||
| Registered voters | 906,677 | ||||||
| Source: Psephos Adam Carr's Election Archive 1987 | |||||||
South Australia
| ||||||||||||||||||||||||||||||||||
All 13 South Australia seats in the Australian House of Representatives and all 12 seats in the Australian Senate | ||||||||||||||||||||||||||||||||||
|---|---|---|---|---|---|---|---|---|---|---|---|---|---|---|---|---|---|---|---|---|---|---|---|---|---|---|---|---|---|---|---|---|---|---|
| ||||||||||||||||||||||||||||||||||
| Party | Votes | % | Swing | Seats | Change | ||
|---|---|---|---|---|---|---|---|
| Liberal | 350,218 | 42.51 | 0.41 | 5 | |||
| National | 30,928 | 3.75 | 3.75 | ||||
| Liberal/National Coalition | 381,146 | 46.26 | 4.16 | 5 | |||
| Labor | 367,045 | 44.55 | -3.83 | 8 | |||
| Democrats | 64,163 | 7.79 | 0.85 | ||||
| Unite Australia | 7,329 | 0.89 | 0.00 | ||||
| Independents | 3,664 | 0.44 | 0.02 | ||||
| Communist | 535 | 0.06 | 0.00 | ||||
| Total | 823,882 | 13 | |||||
| Two-party-preferred vote | |||||||
| Labor | 413,827 | 50.24 | -1.43 | 8 | |||
| Liberal/National Coalition | 409,828 | 49.76 | 1.43 | 5 | |||
| Invalid/blank votes | 60,536 | 6.84 | -1.85 | ||||
| Turnout | 884,418 | 93.80 | |||||
| Registered voters | 942,885 | ||||||
| Source: Psephos Adam Carr's Election Archive 1987 | |||||||
Tasmania
| ||||||||||||||||||||||||||||||||||
All 5 Tasmania seats in the Australian House of Representatives and all 12 seats in the Australian Senate | ||||||||||||||||||||||||||||||||||
|---|---|---|---|---|---|---|---|---|---|---|---|---|---|---|---|---|---|---|---|---|---|---|---|---|---|---|---|---|---|---|---|---|---|---|
| ||||||||||||||||||||||||||||||||||
| Party | Votes | % | Swing | Seats | Change | |
|---|---|---|---|---|---|---|
| Liberal | 140,217 | 51.05 | -0.08 | 4 | ||
| Labor | 118,077 | 42.99 | -0.43 | 1 | ||
| Democrats | 16,371 | 5.96 | 1.95 | |||
| Total | 274,665 | 5 | ||||
| Two-party-preferred vote | ||||||
| Liberal | 145,830 | 53.10 | -0.27 | 4 | ||
| Labor | 128,819 | 46.90 | 0.27 | 1 | ||
| Invalid/blank votes | 14,297 | 4.95 | -0.92 | |||
| Turnout | 288,962 | 96.08 | ||||
| Registered voters | 300,763 | |||||
| Source: Psephos Adam Carr's Election Archive 1987 | ||||||
Territories
Australian Capital Territory
| ||||||||||||||||||||||||||||||||||
Both Australian Capital Territory seats in the Australian House of Representatives and both seats in the Australian Senate | ||||||||||||||||||||||||||||||||||
|---|---|---|---|---|---|---|---|---|---|---|---|---|---|---|---|---|---|---|---|---|---|---|---|---|---|---|---|---|---|---|---|---|---|---|
| ||||||||||||||||||||||||||||||||||
| Party | Votes | % | Swing | Seats | Change | ||
|---|---|---|---|---|---|---|---|
| Labor | 79,791 | 53.92 | 0.58 | 2 | |||
| Liberal | 44,806 | 30.28 | -1.91 | 0 | |||
| Democrats | 10,124 | 6.84 | -0.77 | ||||
| Nuclear Disarmament | 6,912 | 4.67 | 0.99 | ||||
| Family Movement | 4,065 | 2.75 | 0.00 | ||||
| Independent | 2,290 | 1.55 | 0.48 | ||||
| Total | 147,988 | 2 | |||||
| Two-party-preferred vote | |||||||
| Labor | 93,575 | 63.25 | 1.29 | 2 | |||
| Liberal | 54,379 | 36.75 | -1.29 | 0 | |||
| Invalid/blank votes | 5,328 | 3.48 | -1.61 | ||||
| Turnout | 153,316 | 94.22 | |||||
| Registered voters | 162,717 | ||||||
| Source: Psephos Adam Carr's Election Archive 1987 | |||||||
Northern Territory
| ||||||||||||||||||||||||||||||||||
The one Northern Territory seat in the Australian House of Representatives and both seats in the Australian Senate | ||||||||||||||||||||||||||||||||||
|---|---|---|---|---|---|---|---|---|---|---|---|---|---|---|---|---|---|---|---|---|---|---|---|---|---|---|---|---|---|---|---|---|---|---|
| ||||||||||||||||||||||||||||||||||
| Party | Candidate | Votes | % | ±% | |
|---|---|---|---|---|---|
| Labor | Warren Snowdon | 28,195 | 46.9 | +2.0 | |
| Country Liberal | Peter Paroulakis | 21,668 | 36.0 | -12.8 | |
| NT Nationals | Bob Liddle | 10,273 | 17.1 | +17.1 | |
| Total formal votes | 60,136 | 94.2 | |||
| Informal votes | 3,684 | 5.8 | |||
| Turnout | 63,820 | 79.9 | |||
| Two-party-preferred result | |||||
| Labor | Warren Snowdon | 31,386 | 52.2 | +3.6 | |
| Country Liberal | Peter Paroulakis | 28,723 | 47.8 | -3.6 | |
| Labor gain from Country Liberal | Swing | +3.6 | |||
See also
References
- "Federal Election Results 1949-1993" (PDF). Parliament of Australia. Retrieved 12 July 2017.
- "1987 House of Representatives". Psephos Adam Carr's Election Archive. Retrieved 15 June 2022.
- "1987 House of Representatives: Northern Territory". Psephos Adam Carr's Election Archive. Retrieved 22 June 2022.
| House of Representatives | |||
|---|---|---|---|
| Senate | |||
| By-elections | |||
This article is issued from Wikipedia. The text is licensed under Creative Commons - Attribution - Sharealike. Additional terms may apply for the media files.