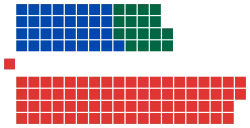
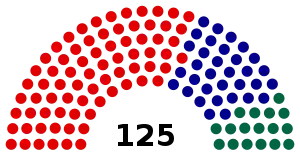
Results of the 1983 Australian federal election (House of Representatives)
This is a list of electoral division results for the Australian 1983 federal election.[1]
Overall
| Party | Votes | % | Swing | Seats | Change | ||
|---|---|---|---|---|---|---|---|
| Labor | 4,297,392 | 49.48 | +4.34 | 75 | |||
| Liberal–National coalition | 3,787,151 | 43.61 | –2.79 | 50 | |||
| Liberal | 2,983,986 | 34.36 | −3.07 | 33 | |||
| National | 782,824 | 9.01 | +0.27 | 17 | |||
| Country Liberal | 20,471 | 0.24 | +0.01 | 0 | |||
| Democrats | 437,265 | 5.03 | −1.54 | ||||
| Total | 8,684,862 | 125 | |||||
| Two-party-preferred (estimated) | |||||||
| Labor | 53.23 | +3.6 | 75 | ||||
| Coalition | 46.77 | −3.6 | 50 | ||||
| Invalid/blank votes | 185,312 | 2.1 | |||||
| Turnout | 8,870,175 | 94.6 | |||||
| Registered voters | 9,372,064 | ||||||
| Source: Federal Election Results 1949-1993 | |||||||
New South Wales
| ||||||||||||||||||||||||||||||||||
All 43 NSW seats in the House of Representatives 22 seats needed for a majority | ||||||||||||||||||||||||||||||||||
|---|---|---|---|---|---|---|---|---|---|---|---|---|---|---|---|---|---|---|---|---|---|---|---|---|---|---|---|---|---|---|---|---|---|---|
| ||||||||||||||||||||||||||||||||||


Banks
- This section is an excerpt from Electoral results for the Division of Banks § 1983
| Party | Candidate | Votes | % | ±% | |
|---|---|---|---|---|---|
| Labor | John Mountford | 39,013 | 57.8 | +4.2 | |
| Liberal | Andrew Fairbairn | 23,962 | 35.5 | −1.3 | |
| Democrats | Montague Greene | 3,908 | 5.8 | −3.8 | |
| Socialist Workers | David Holmes | 572 | 0.8 | +0.8 | |
| Total formal votes | 67,455 | 97.6 | +0.1 | ||
| Informal votes | 1,639 | 2.4 | −0.1 | ||
| Turnout | 69,094 | 95.7 | −0.2 | ||
| Two-party-preferred result | |||||
| Labor | John Mountford | 41,226 | 61.12 | +2.32 | |
| Liberal | Andrew Fairbairn | 26,229 | 38.88 | −2.32 | |
| Labor hold | Swing | +2.32 | |||
Barton
- This section is an excerpt from Electoral results for the Division of Barton § 1983
| Party | Candidate | Votes | % | ±% | |
|---|---|---|---|---|---|
| Labor | Gary Punch | 31,308 | 49.7 | +2.6 | |
| Liberal | Jim Bradfield | 26,086 | 41.4 | −5.0 | |
| Independent | Bruce Barton | 3,153 | 5.0 | +5.0 | |
| Democrats | Ronald George | 1,812 | 2.9 | −0.9 | |
| Independent | Jean Lindsay | 284 | 0.5 | +0.5 | |
| Progress | Peter Wright | 172 | 0.3 | +0.3 | |
| Independent | Charles Bellchambers | 166 | 0.3 | −2.4 | |
| Total formal votes | 62,981 | 97.7 | |||
| Informal votes | 1,478 | 2.3 | |||
| Turnout | 64,459 | 95.6 | |||
| Two-party-preferred result | |||||
| Labor | Gary Punch | 32,845 | 52.15 | +2.55 | |
| Liberal | Jim Bradfield | 30,136 | 47.85 | −2.55 | |
| Labor gain from Liberal | Swing | +2.55 | |||
Bennelong
- This section is an excerpt from Electoral results for the Division of Bennelong § 1983
| Party | Candidate | Votes | % | ±% | |
|---|---|---|---|---|---|
| Liberal | John Howard | 33,721 | 50.3 | −3.6 | |
| Labor | Donald Vickers | 23,799 | 35.5 | −0.7 | |
| South West Coalition | Milo Dunphy | 8,495 | 12.7 | +12.7 | |
| Independent | Steve Gabell | 1,000 | 1.5 | +1.5 | |
| Total formal votes | 67,015 | 98.1 | |||
| Informal votes | 1,297 | 1.9 | |||
| Turnout | 68,312 | 95.9 | |||
| Two-party-preferred result | |||||
| Liberal | John Howard | 37,330 | 55.70 | −2.70 | |
| Labor | Donald Vickers | 29,685 | 44.30 | +2.70 | |
| Liberal hold | Swing | −2.70 | |||
Berowra
- This section is an excerpt from Electoral results for the Division of Berowra § 1983
| Party | Candidate | Votes | % | ±% | |
|---|---|---|---|---|---|
| Liberal | Harry Edwards | 40,676 | 60.1 | −1.3 | |
| Labor | Maurice Marshan | 20,943 | 31.0 | +1.5 | |
| Democrats | Pamela Tuckwell | 6,015 | 8.9 | −0.2 | |
| Total formal votes | 67,634 | 98.3 | |||
| Informal votes | 1,166 | 1.7 | |||
| Turnout | 68,800 | 95.5 | |||
| Two-party-preferred result | |||||
| Liberal | Harry Edwards | 43,209 | 63.89 | −1.11 | |
| Labor | Maurice Marshan | 24,425 | 36.11 | +1.11 | |
| Liberal hold | Swing | −1.11 | |||
Blaxland
- This section is an excerpt from Electoral results for the Division of Blaxland § 1983
| Party | Candidate | Votes | % | ±% | |
|---|---|---|---|---|---|
| Labor | Paul Keating | 41,609 | 62.9 | +3.3 | |
| Liberal | David Brown | 21,604 | 32.7 | +1.7 | |
| Democrats | Phillip Grattan | 2,504 | 3.8 | +0.5 | |
| Socialist Workers | Siong Hoe Goh | 388 | 0.6 | −4.4 | |
| Total formal votes | 66,105 | 96.5 | |||
| Informal votes | 2,407 | 3.5 | |||
| Turnout | 68,512 | 94.6 | |||
| Two-party-preferred result | |||||
| Labor | Paul Keating | 42,982 | 65.02 | −2.18 | |
| Liberal | David Brown | 23,123 | 34.98 | +2.18 | |
| Labor hold | Swing | −2.18 | |||
Bradfield
- This section is an excerpt from Electoral results for the Division of Bradfield § 1983
| Party | Candidate | Votes | % | ±% | |
|---|---|---|---|---|---|
| Liberal | David Connolly | 49,566 | 72.1 | −3.0 | |
| Labor | Peter Donovan | 14,535 | 21.1 | +3.5 | |
| Democrats | Anthony Dunne | 4,674 | 6.8 | −0.5 | |
| Total formal votes | 68,775 | 98.6 | |||
| Informal votes | 988 | 1.4 | |||
| Turnout | 69,763 | 95.8 | |||
| Two-party-preferred result | |||||
| Liberal | David Connolly | 51,367 | 74.69 | −3.41 | |
| Labor | Peter Donovan | 17,408 | 25.31 | +3.41 | |
| Liberal hold | Swing | −3.41 | |||
Calare
- This section is an excerpt from Electoral results for the Division of Calare § 1983
| Party | Candidate | Votes | % | ±% | |
|---|---|---|---|---|---|
| Labor | David Simmons | 35,089 | 50.6 | +4.3 | |
| National | Sandy Mackenzie | 31,087 | 44.9 | −5.1 | |
| Democrats | Ann Ritter | 2,562 | 3.7 | +0.0 | |
| Progress | George Simpson | 566 | 0.8 | +0.8 | |
| Total formal votes | 69,304 | 98.8 | |||
| Informal votes | 870 | 1.2 | |||
| Turnout | 70.174 | 96.4 | |||
| Two-party-preferred result | |||||
| Labor | David Simmons | 36,761 | 53.0 | +4.5 | |
| National | Sandy Mackenzie | 32,543 | 47.0 | −4.5 | |
| Labor gain from National | Swing | +4.5 | |||
Chifley
- This section is an excerpt from Electoral results for the Division of Chifley § 1983
| Party | Candidate | Votes | % | ±% | |
|---|---|---|---|---|---|
| Labor | Russ Gorman | 44,419 | 61.2 | −4.0 | |
| Liberal | Edna Mitchell | 16,565 | 22.8 | −4.2 | |
| Socialist Workers | Christine Broi | 4,556 | 6.3 | +6.3 | |
| Independent | Jonathan Cooper | 3,744 | 5.2 | +5.2 | |
| Democrats | Frances Jones | 2,187 | 3.0 | −0.6 | |
| Independent | Jane Smith/New | 1,114 | 1.5 | +1.5 | |
| Total formal votes | 72,586 | 95.8 | |||
| Informal votes | 3,169 | 4.2 | |||
| Turnout | 75,755 | 95.0 | |||
| Two-party-preferred result | |||||
| Labor | Russ Gorman | 52,525 | 72.4 | +2.3 | |
| Liberal | Edna Mitchell | 20,061 | 27.6 | −2.3 | |
| Labor hold | Swing | +2.3 | |||
Cook
- This section is an excerpt from Electoral results for the Division of Cook § 1983
| Party | Candidate | Votes | % | ±% | |
|---|---|---|---|---|---|
| Labor | Michael Addison | 34,803 | 49.2 | +8.5 | |
| Liberal | Don Dobie | 34,666 | 49.0 | −3.1 | |
| Progress | Henry Soper | 1,213 | 1.7 | +0.8 | |
| Total formal votes | 70,682 | 98.6 | |||
| Informal votes | 1,022 | 1.4 | |||
| Turnout | 71,704 | 96.4 | |||
| Two-party-preferred result | |||||
| Liberal | Don Dobie | 35,415 | 50.1 | −5.0 | |
| Labor | Michael Addison | 35,267 | 49.9 | +5.0 | |
| Liberal hold | Swing | −5.0 | |||
Cowper
- This section is an excerpt from Electoral results for the Division of Cowper § 1983
| Party | Candidate | Votes | % | ±% | |
|---|---|---|---|---|---|
| National | Ian Robinson | 38,351 | 48.4 | −6.1 | |
| Labor | Joseph Moran | 33,986 | 42.9 | +2.5 | |
| Democrats | Peter Brown | 6,962 | 8.8 | +3.8 | |
| Total formal votes | 79,299 | 98.8 | |||
| Informal votes | 982 | 1.2 | |||
| Turnout | 80,281 | 95.2 | |||
| Two-party-preferred result | |||||
| National | Ian Robinson | 41,305 | 52.1 | −4.4 | |
| Labor | Joseph Moran | 37,994 | 47.9 | +4.4 | |
| National hold | Swing | −4.4 | |||
Cunningham
- This section is an excerpt from Electoral results for the Division of Cunningham § 1983
| Party | Candidate | Votes | % | ±% | |
|---|---|---|---|---|---|
| Labor | Stewart West | 46,419 | 63.2 | +7.3 | |
| Liberal | Gary Fisher | 17,874 | 24.3 | −6.2 | |
| Democrats | George Jones | 4,986 | 6.8 | −0.4 | |
| Socialist Workers | Diana Covell | 2,802 | 3.8 | +2.1 | |
| Communist | Romaine Rutnam | 704 | 1.0 | −2.6 | |
| Socialist Labour | Rudolf Pasara | 689 | 0.9 | −0.2 | |
| Total formal votes | 73,474 | 97.0 | |||
| Informal votes | 2,260 | 3.0 | |||
| Turnout | 75,734 | 95.2 | |||
| Two-party-preferred result | |||||
| Labor | Stewart West | 50,399 | 68.6 | +3.5 | |
| Liberal | Gary Fisher | 23,075 | 31.4 | −3.5 | |
| Labor hold | Swing | +3.5 | |||
Dundas
- This section is an excerpt from Electoral results for the Division of Dundas § 1983
| Party | Candidate | Votes | % | ±% | |
|---|---|---|---|---|---|
| Liberal | Philip Ruddock | 33,509 | 50.1 | -3.1 | |
| Labor | Margaret Blaxell | 29,727 | 44.4 | +6.7 | |
| Democrats | John Tumminello | 3,712 | 5.5 | -1.8 | |
| Total formal votes | 66,948 | 98.3 | |||
| Informal votes | 1,133 | 1.7 | |||
| Turnout | 68,081 | 95.4 | |||
| Two-party-preferred result | |||||
| Liberal | Philip Ruddock | 35,299 | 52.7 | -5.7 | |
| Labor | Margaret Blaxell | 31,649 | 47.3 | +5.7 | |
| Liberal hold | Swing | -5.7 | |||
Eden-Monaro
- This section is an excerpt from Electoral results for the Division of Eden-Monaro § 1983
| Party | Candidate | Votes | % | ±% | |
|---|---|---|---|---|---|
| Labor | Jim Snow | 36,401 | 49.1 | +4.0 | |
| Liberal | Murray Sainsbury | 33,141 | 44.7 | -5.1 | |
| Independent | Miriam Naughton | 2,333 | 3.1 | +3.1 | |
| Democrats | Russell Witt | 1,977 | 2.7 | -2.4 | |
| True Independent | Ronald Sarina | 260 | 0.4 | +0.4 | |
| Total formal votes | 74,112 | 98.3 | |||
| Informal votes | 1,302 | 1.7 | |||
| Turnout | 75,414 | 95.7 | |||
| Two-party-preferred result | |||||
| Labor | Jim Snow | 38,222 | 51.6 | +4.4 | |
| Liberal | Murray Sainsbury | 35,890 | 48.4 | -4.4 | |
| Labor gain from Liberal | Swing | +4.4 | |||
Farrer
- This section is an excerpt from Electoral results for the Division of Farrer § 1983
| Party | Candidate | Votes | % | ±% | |
|---|---|---|---|---|---|
| Liberal | Wal Fife | 40,060 | 57.4 | -1.0 | |
| Labor | Noel Diffey | 27,168 | 38.9 | +5.3 | |
| Democrats | Scott Milne | 1,872 | 2.7 | -4.1 | |
| Progress | Maureen Nathan | 740 | 1.1 | -0.1 | |
| Total formal votes | 69,840 | 98.6 | |||
| Informal votes | 970 | 1.4 | |||
| Turnout | 70,810 | 95.1 | |||
| Two-party-preferred result | |||||
| Liberal | Wal Fife | 41,347 | 59.2 | -2.6 | |
| Labor | Noel Diffey | 28,493 | 40.8 | +2.6 | |
| Liberal hold | Swing | -2.6 | |||
Grayndler
- This section is an excerpt from Electoral results for the Division of Grayndler § 1983
| Party | Candidate | Votes | % | ±% | |
|---|---|---|---|---|---|
| Labor | Leo McLeay | 34,679 | 58.9 | +1.4 | |
| Liberal | Edward James | 17,508 | 29.7 | -5.0 | |
| Socialist | David Gibson | 3,434 | 5.8 | +3.4 | |
| Democrats | Albert Jarman | 1,831 | 3.1 | -0.1 | |
| Communist | Joseph Owens | 1,008 | 1.7 | +1.7 | |
| Socialist Workers | Michael Karadjis | 432 | 0.7 | +0.7 | |
| Total formal votes | 58,892 | 95.8 | |||
| Informal votes | 2,564 | 4.2 | |||
| Turnout | 61,456 | 92.9 | |||
| Two-party-preferred result | |||||
| Labor | Leo McLeay | 37,208 | 63.2 | -0.3 | |
| Liberal | Edward James | 21,684 | 36.8 | +0.3 | |
| Labor hold | Swing | -0.3 | |||
Gwydir
- This section is an excerpt from Electoral results for the Division of Gwydir § 1983
| Party | Candidate | Votes | % | ±% | |
|---|---|---|---|---|---|
| National | Ralph Hunt | 38,839 | 57.0 | -1.4 | |
| Labor | Robert Hamilton | 25,585 | 37.6 | +2.1 | |
| Democrats | Gloria Collison | 3,711 | 5.4 | -0.6 | |
| Total formal votes | 68,135 | 98.7 | |||
| Informal votes | 932 | 1.3 | |||
| Turnout | 69,067 | 94.5 | |||
| Two-party-preferred result | |||||
| National | Ralph Hunt | 58.8 | -1.6 | ||
| Labor | Robert Hamilton | 41.2 | +1.6 | ||
| National hold | Swing | -1.6 | |||
Hughes
- This section is an excerpt from Electoral results for the Division of Hughes § 1983
| Party | Candidate | Votes | % | ±% | |
|---|---|---|---|---|---|
| Labor | Les Johnson | 46,667 | 61.6 | +4.6 | |
| Liberal | Peter Somerville | 21,467 | 28.4 | -5.3 | |
| Democrats | Ronald Hellyer | 6,899 | 9.1 | +0.8 | |
| Socialist Workers | Stephen Painter | 672 | 0.9 | +0.9 | |
| Total formal votes | 75,705 | 98.2 | |||
| Informal votes | 1,363 | 1.8 | |||
| Turnout | 77,068 | 96.1 | |||
| Two-party-preferred result | |||||
| Labor | Les Johnson | 68.3 | +6.2 | ||
| Liberal | Peter Somerville | 31.7 | -6.2 | ||
| Labor hold | Swing | +6.2 | |||
Hume
- This section is an excerpt from Electoral results for the Division of Hume § 1983
| Party | Candidate | Votes | % | ±% | |
|---|---|---|---|---|---|
| National | Stephen Lusher | 36,217 | 54.2 | −1.8 | |
| Labor | Marie McCormick | 27,195 | 40.7 | −1.1 | |
| Democrats | Gregory Butler | 3,419 | 5.1 | +2.9 | |
| Total formal votes | 66,831 | 98.9 | |||
| Informal votes | 762 | 1.1 | |||
| Turnout | 67,593 | 95.9 | |||
| Two-party-preferred result | |||||
| National | Stephen Lusher | 56.8 | −0.1 | ||
| Labor | Marie McCormick | 43.2 | +0.1 | ||
| National hold | Swing | −0.1 | |||
Hunter
- This section is an excerpt from Electoral results for the Division of Hunter § 1983
| Party | Candidate | Votes | % | ±% | |
|---|---|---|---|---|---|
| Labor | Bob Brown | 54,213 | 68.1 | +0.2 | |
| Liberal | James White | 19,508 | 24.5 | -2.0 | |
| Democrats | Edwina Wilson | 5,942 | 7.5 | +1.9 | |
| Total formal votes | 79,663 | 98.2 | |||
| Informal votes | 1,492 | 1.8 | |||
| Turnout | 81,155 | 95.9 | |||
| Two-party-preferred result | |||||
| Labor | Bob Brown | 72.6 | +1.3 | ||
| Liberal | James White | 27.4 | -1.3 | ||
| Labor hold | Swing | +1.3 | |||
Kingsford Smith
- This section is an excerpt from Electoral results for the Division of Kingsford Smith § 1983
| Party | Candidate | Votes | % | ±% | |
|---|---|---|---|---|---|
| Labor | Lionel Bowen | 45,168 | 70.4 | +0.9 | |
| Liberal | Collin O'Neill | 16,090 | 25.1 | -1.9 | |
| Democrats | Anthony Larkings | 1,987 | 3.1 | -0.3 | |
| Socialist Workers | Geoffrey Channells | 869 | 1.4 | +1.4 | |
| Total formal votes | 64,114 | 97.2 | |||
| Informal votes | 1,845 | 2.8 | |||
| Turnout | 65,959 | 93.9 | |||
| Two-party-preferred result | |||||
| Labor | Lionel Bowen | 73.5 | +2.0 | ||
| Liberal | Collin O'Neill | 26.5 | -2.0 | ||
| Labor hold | Swing | +2.0 | |||
Lowe
- This section is an excerpt from Electoral results for the Division of Lowe § 1983
| Party | Candidate | Votes | % | ±% | |
|---|---|---|---|---|---|
| Labor | Michael Maher | 33,619 | 51.8 | +5.4 | |
| Liberal | Philip Taylor | 27,633 | 42.6 | -6.1 | |
| Democrats | Ralph Rogers | 2,030 | 3.1 | +0.1 | |
| Socialist Workers | Helen Jarvis | 1,572 | 2.4 | +2.4 | |
| Total formal votes | 64,854 | 97.3 | |||
| Informal votes | 1,767 | 2.7 | |||
| Turnout | 66,621 | 95.9 | |||
| Two-party-preferred result | |||||
| Labor | Michael Maher | 55.9 | +7.0 | ||
| Liberal | Philip Taylor | 44.1 | -7.0 | ||
| Labor hold | Swing | +7.0 | |||
Lyne
- This section is an excerpt from Electoral results for the Division of Lyne § 1983
| Party | Candidate | Votes | % | ±% | |
|---|---|---|---|---|---|
| National | Bruce Cowan | 40,140 | 50.4 | +18.6 | |
| Labor | Francis Murray | 31,877 | 40.1 | +2.4 | |
| Democrats | Stephen Jeffries | 3,953 | 5.0 | +2.6 | |
| Independent | John Bryant | 2,800 | 3.5 | +3.5 | |
| Independent | Alfred Cannings | 514 | 0.6 | +0.6 | |
| Progress | John Veenstra | 284 | 0.4 | +0.4 | |
| Total formal votes | 79,568 | 98.3 | |||
| Informal votes | 1,343 | 1.7 | |||
| Turnout | 80,911 | 95.9 | |||
| Two-party-preferred result | |||||
| National | Bruce Cowan | 55.3 | −3.6 | ||
| Labor | Francis Murray | 44.7 | +3.6 | ||
| National hold | Swing | −3.6 | |||
Macarthur
- This section is an excerpt from Electoral results for the Division of Macarthur § 1983
| Party | Candidate | Votes | % | ±% | |
|---|---|---|---|---|---|
| Labor | Colin Hollis | 39,904 | 49.5 | +5.5 | |
| Liberal | Michael Baume | 36,725 | 45.5 | -5.7 | |
| Democrats | Frederic Goodfellow | 3,515 | 4.4 | +0.2 | |
| Independent | Martin Essenberg | 510 | 0.6 | +0.6 | |
| Total formal votes | 80,654 | 98.5 | |||
| Informal votes | 1,195 | 1.5 | |||
| Turnout | 81,849 | 95.4 | |||
| Two-party-preferred result | |||||
| Labor | Colin Hollis | 42,041 | 52.1 | +5.3 | |
| Liberal | Michael Baume | 38,613 | 47.9 | -5.3 | |
| Labor gain from Liberal | Swing | +5.3 | |||
Mackellar
- This section is an excerpt from Electoral results for the Division of Mackellar § 1983
| Party | Candidate | Votes | % | ±% | |
|---|---|---|---|---|---|
| Liberal | Jim Carlton | 36,587 | 55.6 | -4.6 | |
| Labor | Keith Jackson | 24,292 | 36.9 | +5.2 | |
| Democrats | Robert Williams | 4,055 | 6.2 | -1.9 | |
| Independent | Maurice Foley | 813 | 1.2 | +1.2 | |
| Total formal votes | 65,747 | 98.1 | |||
| Informal votes | 1,253 | 1.9 | |||
| Turnout | 67,000 | 94.2 | |||
| Two-party-preferred result | |||||
| Liberal | Jim Carlton | 58.7 | -4.8 | ||
| Labor | Keith Jackson | 41.3 | +4.8 | ||
| Liberal hold | Swing | -4.8 | |||
Macquarie
- This section is an excerpt from Electoral results for the Division of Macquarie § 1983
| Party | Candidate | Votes | % | ±% | |
|---|---|---|---|---|---|
| Labor | Ross Free | 50,272 | 57.3 | +10.6 | |
| Liberal | Stephen Screech | 30,966 | 35.3 | -8.7 | |
| Democrats | Richard Jackson-Hope | 6,573 | 7.5 | +1.7 | |
| Total formal votes | 87,811 | 98.0 | |||
| Informal votes | 1,773 | 2.0 | |||
| Turnout | 89,584 | 95.9 | |||
| Two-party-preferred result | |||||
| Labor | Ross Free | 61.8 | +9.0 | ||
| Liberal | Stephen Screech | 38.2 | -9.0 | ||
| Labor hold | Swing | +9.0 | |||
Mitchell
- This section is an excerpt from Electoral results for the Division of Mitchell § 1983
| Party | Candidate | Votes | % | ±% | |
|---|---|---|---|---|---|
| Liberal | Alan Cadman | 48,797 | 58.4 | -4.8 | |
| Labor | Arthur Llewellyn | 30,298 | 36.3 | +5.6 | |
| Democrats | Rona Samuels | 4,450 | 5.3 | -0.8 | |
| Total formal votes | 83,545 | 98.1 | |||
| Informal votes | 1,623 | 1.9 | |||
| Turnout | 85,168 | 95.1 | |||
| Two-party-preferred result | |||||
| Liberal | Alan Cadman | 60.5 | -5.1 | ||
| Labor | Arthur Llewellyn | 39.5 | +5.1 | ||
| Liberal hold | Swing | -5.1 | |||
New England
- This section is an excerpt from Electoral results for the Division of New England § 1983
| Party | Candidate | Votes | % | ±% | |
|---|---|---|---|---|---|
| National | Ian Sinclair | 33,335 | 49.8 | -2.9 | |
| Labor | Lawrence Daly | 29,812 | 44.5 | +6.6 | |
| Democrats | Ian Dutton | 3,814 | 5.7 | -3.7 | |
| Total formal votes | 66,961 | 98.9 | |||
| Informal votes | 774 | 1.1 | |||
| Turnout | 67,735 | 95.5 | |||
| Two-party-preferred result | |||||
| National | Ian Sinclair | 35,276 | 52.7 | -3.8 | |
| Labor | Lawrence Daly | 31,685 | 47.3 | +3.8 | |
| National hold | Swing | -3.8 | |||
Newcastle
- This section is an excerpt from Electoral results for the Division of Newcastle1983
| Party | Candidate | Votes | % | ±% | |
|---|---|---|---|---|---|
| Labor | Allan Morris | 39,003 | 59.6 | +1.6 | |
| Liberal | Stan Hayward | 17,842 | 27.3 | -7.2 | |
| Democrats | Wayne Jarman | 2,951 | 4.5 | +1.3 | |
| Independent | Frank Blefari | 2,355 | 3.6 | +3.6 | |
| Communist | Darrell Dawson | 1,732 | 2.6 | +0.1 | |
| Independent | Brian McDermott | 959 | 1.5 | +1.5 | |
| Socialist Workers | Geoffrey Payne | 573 | 0.9 | +1.0 | |
| Total formal votes | 65,415 | 97.3 | |||
| Informal votes | 1,838 | 2.7 | |||
| Turnout | 67,253 | 95.6 | |||
| Two-party-preferred result | |||||
| Labor | Allan Morris | 67.5 | +3.7 | ||
| Liberal | Stan Hayward | 32.5 | -3.7 | ||
| Labor hold | Swing | +3.7 | |||
North Sydney
- This section is an excerpt from Electoral results for the Division of North Sydney § 1983
| Party | Candidate | Votes | % | ±% | |
|---|---|---|---|---|---|
| Liberal | John Spender | 35,544 | 57.6 | -2.4 | |
| Labor | Kirk McKenzie | 21,096 | 34.2 | +3.0 | |
| Democrats | Rodney Dominish | 5,024 | 8.1 | +2.3 | |
| Total formal votes | 61,664 | 98.1 | |||
| Informal votes | 1,214 | 1.9 | |||
| Turnout | 62,878 | 92.1 | |||
| Two-party-preferred result | |||||
| Liberal | John Spender | 60.4 | -4.1 | ||
| Labor | Kirk McKenzie | 39.6 | +4.1 | ||
| Liberal hold | Swing | -4.1 | |||
Parramatta
- This section is an excerpt from Electoral results for the Division of Parramatta § 1983
| Party | Candidate | Votes | % | ±% | |
|---|---|---|---|---|---|
| Labor | John Brown | 41,951 | 62.2 | +8.2 | |
| Liberal | James Harker-Mortlock | 20,608 | 30.6 | -4.2 | |
| Democrats | Patricia Lamey | 3,361 | 5.0 | -4.3 | |
| Socialist Workers | Mark Carey | 1,519 | 2.2 | +2.2 | |
| Total formal votes | 67,439 | 97.1 | |||
| Informal votes | 2,025 | 2.9 | |||
| Turnout | 69,464 | 93.9 | |||
| Two-party-preferred result | |||||
| Labor | John Brown | 67.2 | +7.0 | ||
| Liberal | James Harker-Mortlock | 32.8 | -7.0 | ||
| Labor hold | Swing | +7.0 | |||
Paterson
- This section is an excerpt from Electoral results for the Division of Paterson § 1983
| Party | Candidate | Votes | % | ±% | |
|---|---|---|---|---|---|
| National | Frank O'Keefe | 37,028 | 54.1 | -1.0 | |
| Labor | Michael Williams | 28,412 | 41.5 | +3.8 | |
| Democrats | Darrel Woodhouse | 3,048 | 4.5 | -1.9 | |
| Total formal votes | 68,488 | 98.6 | |||
| Informal votes | 938 | 1.4 | |||
| Turnout | 69,426 | 95.0 | |||
| Two-party-preferred result | |||||
| National | Frank O'Keefe | 55.9 | -1.8 | ||
| Labor | Michael Williams | 44.1 | +1.8 | ||
| National hold | Swing | -1.8 | |||
Phillip
- This section is an excerpt from Electoral results for the Division of Phillip § 1983
| Party | Candidate | Votes | % | ±% | |
|---|---|---|---|---|---|
| Labor | Jeannette McHugh | 29,909 | 49.7 | +3.7 | |
| Liberal | Jack Birney | 27,903 | 46.4 | -2.3 | |
| Democrats | Karin Sowada | 1,698 | 2.8 | -1.8 | |
| Engineered Australia | Lawrence Hogan | 292 | 0.5 | +0.5 | |
| Progress | Timothy Daly | 248 | 0.4 | +0.4 | |
| Greens | Julien Droulers | 146 | 0.2 | +0.2 | |
| Total formal votes | 60,196 | 97.2 | |||
| Informal votes | 1,762 | 2.8 | |||
| Turnout | 61,958 | 92.7 | |||
| Two-party-preferred result | |||||
| Labor | Jeannette McHugh | 51.9 | +2.5 | ||
| Liberal | Jack Birney | 48.1 | -2.5 | ||
| Labor gain from Liberal | Swing | +2.5 | |||
Prospect
- This section is an excerpt from Electoral results for the Division of Prospect § 1983
| Party | Candidate | Votes | % | ±% | |
|---|---|---|---|---|---|
| Labor | Dick Klugman | 46,793 | 63.1 | +5.2 | |
| Liberal | Alan Byers | 25,315 | 34.1 | -2.5 | |
| Socialist Workers | Richard Nichols | 1,320 | 1.8 | +1.8 | |
| Independent | Eric Viitala | 714 | 1.0 | -0.4 | |
| Total formal votes | 74,142 | 96.1 | |||
| Informal votes | 3,047 | 3.9 | |||
| Turnout | 77,189 | 93.9 | |||
| Two-party-preferred result | |||||
| Labor | Dick Klugman | 65.2 | +4.0 | ||
| Liberal | Alan Byers | 34.8 | -4.0 | ||
| Labor hold | Swing | +4.0 | |||
Reid
- This section is an excerpt from Electoral results for the Division of Reid § 1983
| Party | Candidate | Votes | % | ±% | |
|---|---|---|---|---|---|
| Labor | Tom Uren | 37,839 | 61.7 | +0.1 | |
| Liberal | Yvonne Maio | 17,089 | 27.9 | -2.2 | |
| Democrats | Stephen Bastian | 4,770 | 7.8 | +5.3 | |
| Socialist Workers | Lynda Boland | 723 | 1.2 | +1.2 | |
| Independent | Neville Gray | 646 | 1.1 | -4.7 | |
| Independent | Michael Gluyas | 259 | 0.4 | +0.4 | |
| Total formal votes | 61,326 | 95.9 | |||
| Informal votes | 2,622 | 4.1 | |||
| Turnout | 63,948 | 94.1 | |||
| Two-party-preferred result | |||||
| Labor | Tom Uren | 67.6 | +2.1 | ||
| Liberal | Yvonne Maio | 32.4 | -2.1 | ||
| Labor hold | Swing | +2.1 | |||
Richmond
- This section is an excerpt from Electoral results for the Division of Richmond § 1983
| Party | Candidate | Votes | % | ±% | |
|---|---|---|---|---|---|
| National | Doug Anthony | 42,684 | 53.0 | -3.9 | |
| Labor | Terence McGee | 31,967 | 39.7 | +3.7 | |
| Democrats | Kenneth Nicholson | 5,906 | 7.3 | +0.2 | |
| Total formal votes | 80,557 | 98.9 | |||
| Informal votes | 922 | 1.1 | |||
| Turnout | 81,479 | 95.3 | |||
| Two-party-preferred result | |||||
| National | Doug Anthony | 55.9 | -4.4 | ||
| Labor | Terence McGee | 44.1 | +4.4 | ||
| National hold | Swing | -4.4 | |||
Riverina
- This section is an excerpt from Electoral results for the Division of Riverina § 1983
| Party | Candidate | Votes | % | ±% | |
|---|---|---|---|---|---|
| National | Noel Hicks | 32,976 | 49.2 | +16.1 | |
| Labor | Ronald Adams | 32,587 | 48.6 | +1.7 | |
| Democrats | Lesley Holschier | 1,495 | 2.2 | +0.0 | |
| Total formal votes | 67,058 | 97.8 | |||
| Informal votes | 1,495 | 2.2 | |||
| Turnout | 68,072 | 94.7 | |||
| Two-party-preferred result | |||||
| National | Noel Hicks | 33,820 | 50.4 | -0.1 | |
| Labor | Ronald Adams | 33,238 | 49.6 | +0.1 | |
| National hold | Swing | -0.1 | |||
Robertson
- This section is an excerpt from Electoral results for the Division of Robertson § 1983
| Party | Candidate | Votes | % | ±% | |
|---|---|---|---|---|---|
| Labor | Barry Cohen | 46,058 | 55.0 | +2.6 | |
| Liberal | Bev Austin | 31,631 | 37.8 | -0.5 | |
| Democrats | Trevor Willsher | 5,980 | 7.1 | +1.3 | |
| Total formal votes | 83,669 | 98.4 | |||
| Informal votes | 1,355 | 1.6 | |||
| Turnout | 85,024 | 95.1 | |||
| Two-party-preferred result | |||||
| Labor | Barry Cohen | 59.3 | +1.2 | ||
| Liberal | Bev Austin | 40.7 | -1.2 | ||
| Labor hold | Swing | +1.2 | |||
Shortland
- This section is an excerpt from Electoral results for the Division of Shortland § 1983
| Party | Candidate | Votes | % | ±% | |
|---|---|---|---|---|---|
| Labor | Peter Morris | 49,275 | 62.7 | +1.7 | |
| Liberal | Peter Wilson | 20,781 | 26.4 | -1.2 | |
| Democrats | Lyn Godfrey | 4,677 | 6.0 | -0.8 | |
| Socialist Workers | Peter Abrahamson | 2,584 | 3.3 | +3.3 | |
| Socialist Labour | Robert Buhler | 1,280 | 1.6 | +1.6 | |
| Total formal votes | 78,597 | 98.2 | |||
| Informal votes | 1,455 | 1.8 | |||
| Turnout | 80,052 | 96.3 | |||
| Two-party-preferred result | |||||
| Labor | Peter Morris | 70.8 | +1.5 | ||
| Liberal | Peter Wilson | 29.2 | -1.5 | ||
| Labor hold | Swing | +1.5 | |||
St George
- This section is an excerpt from Electoral results for the Division of St George § 1983
| Party | Candidate | Votes | % | ±% | |
|---|---|---|---|---|---|
| Labor | Bill Morrison | 37,570 | 57.8 | +4.4 | |
| Liberal | George James | 23,933 | 36.8 | -6.0 | |
| Independent | Brian Compton | 1,806 | 2.8 | +2.8 | |
| Democrats | Ronald Kirkwood | 1,210 | 1.9 | -1.9 | |
| Socialist Workers | Dorothy Tumney | 477 | 0.7 | +0.7 | |
| Total formal votes | 64,996 | 97.3 | |||
| Informal votes | 1,809 | 2.7 | |||
| Turnout | 66,805 | 95.6 | |||
| Two-party-preferred result | |||||
| Labor | Bill Morrison | 60.5 | +4.4 | ||
| Liberal | George James | 39.5 | -4.4 | ||
| Labor hold | Swing | +4.4 | |||
Sydney
- This section is an excerpt from Electoral results for the Division of Sydney § 1983
| Party | Candidate | Votes | % | ±% | |
|---|---|---|---|---|---|
| Labor | Peter Baldwin | 40,360 | 67.2 | +5.2 | |
| Liberal | Ron Cibas | 12,559 | 20.9 | -1.7 | |
| Democrats | Jennifer Macleod | 4,286 | 7.1 | -1.0 | |
| Communist | Aileen Beaver | 2,066 | 3.4 | -1.4 | |
| Socialist Workers | James Percy | 758 | 1.3 | -2.2 | |
| Total formal votes | 60,029 | 96.8 | |||
| Informal votes | 1,954 | 3.2 | |||
| Turnout | 61,983 | 90.2 | |||
| Two-party-preferred result | |||||
| Labor | Peter Baldwin | 75.7 | +1.9 | ||
| Liberal | Ron Cibas | 24.3 | -1.9 | ||
| Labor hold | Swing | +1.9 | |||
Warringah
- This section is an excerpt from Electoral results for the Division of Warringah § 1983
| Party | Candidate | Votes | % | ±% | |
|---|---|---|---|---|---|
| Liberal | Michael MacKellar | 36,549 | 58.0 | −4.5 | |
| Labor | John Coombs | 23,507 | 37.3 | +8.9 | |
| Democrats | Annique Duc | 2,403 | 3.8 | −2.5 | |
| Progress | Stephen Markey | 509 | 0.8 | +0.8 | |
| Total formal votes | 62,968 | 98.5 | |||
| Informal votes | 974 | 1.5 | |||
| Turnout | 63,942 | 95.0 | |||
| Two-party-preferred result | |||||
| Liberal | Michael MacKellar | 60.2 | −7.2 | ||
| Labor | John Coombs | 39.8 | +7.2 | ||
| Liberal hold | Swing | −7.2 | |||
Wentworth
- This section is an excerpt from Electoral results for the Division of Wentworth § 1983
| Party | Candidate | Votes | % | ±% | |
|---|---|---|---|---|---|
| Liberal | Peter Coleman | 31,759 | 54.7 | -5.8 | |
| Labor | Max Pearce | 20,301 | 34.9 | +1.6 | |
| Independent | Katherine Wentworth | 2,787 | 4.8 | +4.8 | |
| Democrats | Brian Hillman | 2,474 | 4.3 | -1.9 | |
| Independent | George Warnecke | 401 | 0.7 | +0.7 | |
| Independent | Robert McCarthy | 251 | 0.4 | +0.4 | |
| Independent | Neil Roberts | 115 | 0.2 | +0.2 | |
| Total formal votes | 58,088 | 97.3 | |||
| Informal votes | 1,591 | 2.7 | |||
| Turnout | 59,679 | 91.3 | |||
| Two-party-preferred result | |||||
| Liberal | Peter Coleman | 62.4 | -0.6 | ||
| Labor | Max Pearce | 37.6 | +0.6 | ||
| Liberal hold | Swing | -0.6 | |||
Werriwa
- This section is an excerpt from Electoral results for the Division of Werriwa § 1983
| Party | Candidate | Votes | % | ±% | |
|---|---|---|---|---|---|
| Labor | John Kerin | 52,584 | 63.2 | +5.3 | |
| Liberal | Marie Rutledge | 23,586 | 28.3 | −2.1 | |
| Independent | David Brandon | 4,714 | 5.7 | +5.7 | |
| Socialist Labour | Dorothea Brocksop | 1,351 | 1.6 | +1.6 | |
| Socialist Workers | Gail Cumming | 1,025 | 1.2 | +1.2 | |
| Total formal votes | 83,260 | 97.0 | |||
| Informal votes | 2,584 | 3.0 | |||
| Turnout | 85,844 | 94.4 | |||
| Two-party-preferred result | |||||
| Labor | John Kerin | 69.1 | +2.5 | ||
| Liberal | Marie Rutledge | 30.9 | −2.5 | ||
| Labor hold | Swing | +2.5 | |||
Victoria
| ||||||||||||||||||||||||||||||||||
All 33 Victorian seats in the House of Representatives 17 seats needed for a majority | ||||||||||||||||||||||||||||||||||
|---|---|---|---|---|---|---|---|---|---|---|---|---|---|---|---|---|---|---|---|---|---|---|---|---|---|---|---|---|---|---|---|---|---|---|
| ||||||||||||||||||||||||||||||||||
Balaclava
- This section is an excerpt from Electoral results for the Division of Balaclava § 1983
| Party | Candidate | Votes | % | ±% | |
|---|---|---|---|---|---|
| Liberal | Ian Macphee | 31,642 | 50.1 | −1.5 | |
| Labor | Chris Kennedy | 25,867 | 41.0 | +4.8 | |
| Democrats | Zelma Furey | 5,004 | 7.9 | −4.3 | |
| Conservative Nat. | Timothy Warner | 600 | 1.0 | +1.0 | |
| Total formal votes | 63,113 | 98.1 | |||
| Informal votes | 1,218 | 1.9 | |||
| Turnout | 64,331 | 95.0 | |||
| Two-party-preferred result | |||||
| Liberal | Ian Macphee | 53.4 | −2.7 | ||
| Labor | Chris Kennedy | 46.6 | +2.7 | ||
| Liberal hold | Swing | −2.7 | |||
Ballaarat
- This section is an excerpt from Electoral results for the Division of Ballarat § 1983
| Party | Candidate | Votes | % | ±% | |
|---|---|---|---|---|---|
| Labor | John Mildren | 34,616 | 50.7 | +5.5 | |
| Liberal | John Ronan | 30,078 | 44.1 | −1.9 | |
| Democrats | Graham Gough | 2,123 | 3.1 | −2.5 | |
| Independent | John Blower | 1,148 | 1.7 | +1.7 | |
| Independent | Albert Ireland | 275 | 0.4 | +0.4 | |
| Total formal votes | 68,240 | 98.3 | |||
| Informal votes | 1,156 | 1.7 | |||
| Turnout | 69,396 | 96.9 | |||
| Two-party-preferred result | |||||
| Labor | John Mildren | 54.1 | +3.4 | ||
| Liberal | John Ronan | 45.9 | −3.4 | ||
| Labor hold | Swing | +3.4 | |||
Batman
- This section is an excerpt from Electoral results for the Division of Batman § 1983
| Party | Candidate | Votes | % | ±% | |
|---|---|---|---|---|---|
| Labor | Brian Howe | 42,398 | 63.7 | +8.2 | |
| Liberal | Maxwell Playford | 19,193 | 28.8 | −2.3 | |
| Democrats | Gwendoline Naug | 2,836 | 4.3 | −1.7 | |
| Democratic Labor | Philip L'Huillier | 1,756 | 2.6 | −4.8 | |
| Socialist Workers | John Percy | 380 | 0.6 | +0.6 | |
| Total formal votes | 66,563 | 97.1 | |||
| Informal votes | 1,983 | 2.9 | |||
| Turnout | 68,546 | 95.7 | |||
| Two-party-preferred result | |||||
| Labor | Brian Howe | 77.1 | +6.4 | ||
| Liberal | Maxwell Playford | 22.9 | −6.4 | ||
| Labor hold | Swing | +6.4 | |||
Bendigo
- This section is an excerpt from Electoral results for the Division of Bendigo § 1983
| Party | Candidate | Votes | % | ±% | |
|---|---|---|---|---|---|
| Labor | John Brumby | 34,908 | 49.7 | +5.7 | |
| Liberal | John Bourchier | 30,352 | 43.2 | −4.1 | |
| Democrats | Neil Jewell | 3,078 | 4.4 | −4.4 | |
| Democratic Labor | Robert Denahy | 1,859 | 2.6 | +2.6 | |
| Total formal votes | 70,197 | 98.6 | |||
| Informal votes | 968 | 1.4 | |||
| Turnout | 71,165 | 96.7 | |||
| Two-party-preferred result | |||||
| Labor | John Brumby | 52.8 | +4.1 | ||
| Liberal | John Bourchier | 47.2 | −4.1 | ||
| Labor gain from Liberal | Swing | +4.1 | |||
Bruce
- This section is an excerpt from Electoral results for the Division of Bruce § 1983
| Party | Candidate | Votes | % | ±% | |
|---|---|---|---|---|---|
| Liberal | Sir Billy Snedden | 36,381 | 47.9 | −0.9 | |
| Labor | Heather O'Connor | 33,650 | 44.3 | +6.0 | |
| Democrats | Michael Johnson | 5,955 | 7.8 | −3.3 | |
| Total formal votes | 75,986 | 98.3 | |||
| Informal votes | 1,292 | 1.7 | |||
| Turnout | 77,278 | 97.3 | |||
| Two-party-preferred result | |||||
| Liberal | Sir Billy Snedden | 38,544 | 50.7 | −4.7 | |
| Labor | Heather O'Connor | 37,442 | 49.3 | +4.7 | |
| Liberal hold | Swing | −4.7 | |||
Burke
- This section is an excerpt from Electoral results for the Division of Burke (1969–2004) § 1983
| Party | Candidate | Votes | % | ±% | |
|---|---|---|---|---|---|
| Labor | Andrew Theophanous | 46,171 | 60.9 | +6.8 | |
| Liberal | Bernie Finn | 24,294 | 32.0 | −6.2 | |
| Democrats | George Hunter | 4,611 | 6.1 | −1.6 | |
| Socialist Workers | Evelyn Robson | 788 | 1.0 | +1.0 | |
| Total formal votes | 75,864 | 97.2 | |||
| Informal votes | 2,163 | 2.8 | |||
| Turnout | 78,027 | 95.9 | |||
| Two-party-preferred result | |||||
| Labor | Andrew Theophanous | 65.5 | +6.7 | ||
| Liberal | Bernie Finn | 34.5 | −6.7 | ||
| Labor hold | Swing | +6.7 | |||
Casey
- This section is an excerpt from Electoral results for the Division of Casey § 1983
| Party | Candidate | Votes | % | ±% | |
|---|---|---|---|---|---|
| Labor | Peter Steedman | 34,810 | 46.0 | +6.8 | |
| Liberal | Peter Falconer | 33,335 | 44.1 | −1.3 | |
| Democrats | Michael Nardella | 5,646 | 7.5 | −2.8 | |
| Christian | Martin Hetherich | 931 | 1.2 | +1.2 | |
| Democratic Labor | John Garratt | 887 | 1.2 | +1.2 | |
| Total formal votes | 75,609 | 98.3 | |||
| Informal votes | 1,390 | 1.7 | |||
| Turnout | 76,918 | 96.2 | |||
| Two-party-preferred result | |||||
| Labor | Peter Steedman | 38,312 | 50.7 | +2.6 | |
| Liberal | Peter Falconer | 37,297 | 49.3 | −2.6 | |
| Labor gain from Liberal | Swing | +2.6 | |||
Chisholm
- This section is an excerpt from Electoral results for the Division of Chisholm § 1983
| Party | Candidate | Votes | % | ±% | |
|---|---|---|---|---|---|
| Labor | Helen Mayer | 33,253 | 48.2 | +7.1 | |
| Liberal | Graham Harris | 29,052 | 42.1 | −5.0 | |
| Democrats | Alan Swindon | 4,444 | 6.5 | −4.3 | |
| Democratic Labor | Kevin Cooper | 2,196 | 3.2 | +3.2 | |
| Total formal votes | 68,945 | 98.4 | |||
| Informal votes | 1,128 | 1.6 | |||
| Turnout | 70,073 | 96.3 | |||
| Two-party-preferred result | |||||
| Labor | Helen Mayer | 36,019 | 52.2 | +4.4 | |
| Liberal | Graham Harris | 32,926 | 47.8 | −4.4 | |
| Labor gain from Liberal | Swing | +4.4 | |||
Corangamite
- This section is an excerpt from Electoral results for the Division of Corangamite § 1983
| Party | Candidate | Votes | % | ±% | |
|---|---|---|---|---|---|
| Liberal | Tony Street | 40,694 | 58.2 | +1.6 | |
| Labor | Gavan O'Connor | 29,231 | 41.8 | +10.5 | |
| Total formal votes | 69,925 | 98.3 | |||
| Informal votes | 1,190 | 1.7 | |||
| Turnout | 71,115 | 97.2 | |||
| Liberal hold | Swing | −4.6 | |||
Corio
- This section is an excerpt from Electoral results for the Division of Corio § 1983
| Party | Candidate | Votes | % | ±% | |
|---|---|---|---|---|---|
| Labor | Gordon Scholes | 43,016 | 60.1 | +3.5 | |
| Liberal | Kent Henderson | 25,075 | 35.0 | −0.2 | |
| Democrats | Guenter Sahr | 3,452 | 4.8 | −0.1 | |
| Total formal votes | 71,543 | 98.0 | |||
| Informal votes | 1,429 | 2.0 | |||
| Turnout | 72,972 | 96.0 | |||
| Two-party-preferred result | |||||
| Labor | Gordon Scholes | 63.0 | +3.2 | ||
| Liberal | Kent Henderson | 37.0 | −3.2 | ||
| Labor hold | Swing | +3.2 | |||
Deakin
- This section is an excerpt from Electoral results for the Division of Deakin § 1983
| Party | Candidate | Votes | % | ±% | |
|---|---|---|---|---|---|
| Labor | John Saunderson | 38,225 | 47.7 | +6.3 | |
| Liberal | Alan Jarman | 33,225 | 41.5 | -2.2 | |
| Democrats | Jeffrey McAlpine | 5,324 | 6.7 | -5.2 | |
| Democratic Labor | Peter Ferwerda | 2,949 | 3.7 | +0.7 | |
| Independent | Wilfrid Thiele | 333 | 0.4 | +0.4 | |
| Total formal votes | 81,615 | 96.4 | |||
| Informal votes | 1,559 | 1.9 | |||
| Turnout | 81,615 | 96.4 | |||
| Two-party-preferred result | |||||
| Labor | John Saunderson | 41,727 | 52.1 | +4.4 | |
| Liberal | Alan Jarman | 38,329 | 47.9 | -4.4 | |
| Labor gain from Liberal | Swing | +4.4 | |||
Diamond Valley
- This section is an excerpt from Electoral results for the Division of Diamond Valley § 1983
| Party | Candidate | Votes | % | ±% | |
|---|---|---|---|---|---|
| Labor | Peter Staples | 36,726 | 46.4 | +6.0 | |
| Liberal | Neil Brown | 36,006 | 45.5 | -3.1 | |
| Democrats | Lynden Kenyon | 5,162 | 6.5 | -4.5 | |
| Democratic Labor | Anne-Marie Petrucco | 1,229 | 1.6 | +1.6 | |
| Total formal votes | 79,123 | 98.1 | |||
| Informal votes | 1,492 | 1.9 | |||
| Turnout | 80,615 | 97.6 | |||
| Two-party-preferred result | |||||
| Labor | Peter Staples | 39,907 | 50.4 | +4.1 | |
| Liberal | Neil Brown | 39,216 | 49.6 | -4.1 | |
| Labor gain from Liberal | Swing | +4.1 | |||
Flinders
- This section is an excerpt from Electoral results for the Division of Flinders § 1983
| Party | Candidate | Votes | % | ±% | |
|---|---|---|---|---|---|
| Labor | Bob Chynoweth | 38,134 | 47.2 | +8.0 | |
| Liberal | Peter Reith | 35,847 | 44.4 | -5.9 | |
| Democrats | Harold Fraser | 4,861 | 6.0 | -4.5 | |
| Democratic Labor | Kenneth Payne | 1,977 | 2.4 | +2.4 | |
| Total formal votes | 80,819 | 98.5 | |||
| Informal votes | 1,208 | 1.5 | |||
| Turnout | 82,027 | 95.7 | |||
| Two-party-preferred result | |||||
| Labor | Bob Chynoweth | 41,206 | 51.0 | +5.6 | |
| Liberal | Peter Reith | 39,613 | 49.0 | -5.6 | |
| Labor gain from Liberal | Swing | +5.6 | |||
Gellibrand
- This section is an excerpt from Electoral results for the Division of Gellibrand § 1983
| Party | Candidate | Votes | % | ±% | |
|---|---|---|---|---|---|
| Labor | Ralph Willis | 47,412 | 70.4 | +4.9 | |
| Liberal | Peter Goudge | 14,120 | 21.0 | −1.2 | |
| Socialist Workers | James Doughney | 2,842 | 4.2 | +0.8 | |
| Democrats | Barry McLeod | 2,695 | 4.0 | −5.0 | |
| Australian National Party | Augustus Titter | 304 | 0.5 | +0.5 | |
| Total formal votes | 67,373 | 96.2 | |||
| Informal votes | 2,678 | 3.8 | |||
| Turnout | 70,051 | 95.4 | |||
| Two-party-preferred result | |||||
| Labor | Ralph Willis | 75.9 | +2.5 | ||
| Liberal | Peter Goudge | 24.1 | −2.5 | ||
| Labor hold | Swing | +2.5 | |||
Gippsland
- This section is an excerpt from Electoral results for the Division of Gippsland § 1983
| Party | Candidate | Votes | % | ±% | |
|---|---|---|---|---|---|
| Labor | Anthony Petersen | 24,029 | 35.4 | +5.2 | |
| National | Peter McGauran | 21,360 | 31.5 | -25.2 | |
| Liberal | Philip Davis | 16,127 | 23.8 | +23.8 | |
| Democrats | Pierre Forcier | 2,930 | 4.3 | -6.2 | |
| Independent | Pearce Buckley | 2,059 | 3.0 | +3.0 | |
| Democratic Labor | Stewart Taig | 659 | 1.0 | +1.0 | |
| Independent | Bruce Ingle | 652 | 1.0 | +1.0 | |
| Total formal votes | 67,816 | 96.8 | |||
| Informal votes | 2,257 | 3.2 | |||
| Turnout | 70,073 | 95.4 | |||
| Two-party-preferred result | |||||
| National | Peter McGauran | 40,465 | 59.7 | -2.2 | |
| Labor | Anthony Petersen | 27,351 | 40.3 | +2.2 | |
| National hold | Swing | -2.2 | |||
Henty
- This section is an excerpt from Electoral results for the Division of Henty § 1983
| Party | Candidate | Votes | % | ±% | |
|---|---|---|---|---|---|
| Labor | Joan Child | 36,259 | 54.7 | +5.6 | |
| Liberal | Craig Baxter | 25,709 | 38.8 | -3.5 | |
| Democrats | Harry Eichler | 2,845 | 4.3 | -1.7 | |
| Democratic Labor | Paul Carroll | 1,442 | 2.2 | -0.4 | |
| Total formal votes | 66,255 | 98.3 | |||
| Informal votes | 1,169 | 1.7 | |||
| Turnout | 67,424 | 95.5 | |||
| Two-party-preferred result | |||||
| Labor | Joan Child | 57.5 | +4.7 | ||
| Liberal | Craig Baxter | 42.5 | -4.7 | ||
| Labor hold | Swing | +4.7 | |||
Higgins
- This section is an excerpt from Electoral results for the Division of Higgins § 1983
| Party | Candidate | Votes | % | ±% | |
|---|---|---|---|---|---|
| Liberal | Roger Shipton | 35,189 | 55.2 | −1.8 | |
| Labor | Jennifer Bundy | 24,184 | 37.9 | +3.5 | |
| Democrats | Antony Siddons | 3,880 | 6.1 | −0.9 | |
| Imperial British | Maureen Holmes | 500 | 0.8 | −0.2 | |
| Total formal votes | 63,753 | 98.4 | |||
| Informal votes | 1,024 | 1.6 | |||
| Turnout | 64,777 | 94.8 | |||
| Two-party-preferred result | |||||
| Liberal | Roger Shipton | 58.0 | −2.7 | ||
| Labor | Jennifer Bundy | 42.0 | +2.7 | ||
| Liberal hold | Swing | −2.7 | |||
Holt
- This section is an excerpt from Electoral results for the Division of Holt § 1983
| Party | Candidate | Votes | % | ±% | |
|---|---|---|---|---|---|
| Labor | Michael Duffy | 48,648 | 58.5 | +6.4 | |
| Liberal | Joseph Moldrich | 28,845 | 34.7 | -3.7 | |
| Democrats | Jean Yule | 5,639 | 6.8 | -0.9 | |
| Total formal votes | 83,132 | 97.6 | |||
| Informal votes | 2,022 | 2.4 | |||
| Turnout | 85,154 | 96.1 | |||
| Two-party-preferred result | |||||
| Labor | Michael Duffy | 62.6 | +5.7 | ||
| Liberal | Joseph Moldrich | 37.4 | -5.7 | ||
| Labor hold | Swing | +5.7 | |||
Hotham
- This section is an excerpt from Electoral results for the Division of Hotham § 1983
| Party | Candidate | Votes | % | ±% | |
|---|---|---|---|---|---|
| Labor | Lewis Kent | 43,083 | 56.4 | +7.9 | |
| Liberal | Peter Bolitho | 28,656 | 37.5 | −1.2 | |
| Democrats | Erwin Frenkel | 4,683 | 6.1 | −5.1 | |
| Total formal votes | 76,422 | 97.6 | |||
| Informal votes | 1,850 | 2.4 | |||
| Turnout | 78,272 | 96.5 | |||
| Two-party-preferred result | |||||
| Labor | Lewis Kent | 60.1 | +6.1 | ||
| Liberal | Peter Bolitho | 39.9 | −6.1 | ||
| Labor hold | Swing | +6.1 | |||
Indi
- This section is an excerpt from Electoral results for the Division of Indi § 1983
| Party | Candidate | Votes | % | ±% | |
|---|---|---|---|---|---|
| Liberal | Ewen Cameron | 27,935 | 41.3 | −0.5 | |
| Labor | Carole Marple | 24,374 | 36.1 | +3.0 | |
| National | Kevin Sanderson | 12,892 | 19.1 | −0.4 | |
| Democrats | Geoffrey le Couteur | 2,361 | 3.5 | −0.7 | |
| Total formal votes | 67,562 | 98.4 | |||
| Informal votes | 1,066 | 1.6 | |||
| Turnout | 68,628 | 96.5 | |||
| Two-party-preferred result | |||||
| Liberal | Ewen Cameron | 40,975 | 60.6 | −1.8 | |
| Labor | Carole Marple | 26,587 | 39.4 | +1.8 | |
| Liberal hold | Swing | −1.8 | |||
Isaacs
- This section is an excerpt from Electoral results for the Division of Isaacs § 1983
| Party | Candidate | Votes | % | ±% | |
|---|---|---|---|---|---|
| Labor | David Charles | 38,630 | 55.0 | +9.9 | |
| Liberal | Ann Dunkley | 26,964 | 38.4 | +0.4 | |
| Democrats | Terence Gough | 4,689 | 6.7 | −7.4 | |
| Total formal votes | 70,283 | 98.4 | |||
| Informal votes | 1,169 | 1.6 | |||
| Turnout | 71,452 | 96.1 | |||
| Two-party-preferred result | |||||
| Labor | David Charles | 59.0 | +7.2 | ||
| Liberal | Ann Dunkley | 41.0 | −7.2 | ||
| Labor hold | Swing | +7.2 | |||
Kooyong
- This section is an excerpt from Electoral results for the Division of Kooyong § 1983
| Party | Candidate | Votes | % | ±% | |
|---|---|---|---|---|---|
| Liberal | Andrew Peacock | 36,297 | 56.3 | −1.3 | |
| Labor | Avis Meddings | 23,081 | 35.8 | +1.9 | |
| Democrats | Keith Bruckner | 4,635 | 7.2 | −1.3 | |
| Imperial British | David Greagg | 434 | 0.7 | +0.7 | |
| Total formal votes | 64,447 | 98.2 | |||
| Informal votes | 1,154 | 1.8 | |||
| Turnout | 65,601 | 94.6 | |||
| Two-party-preferred result | |||||
| Liberal | Andrew Peacock | 59.1 | −2.0 | ||
| Labor | Avis Meddings | 40.9 | +2.0 | ||
| Liberal hold | Swing | −2.0 | |||
La Trobe
- This section is an excerpt from Electoral results for the Division of La Trobe § 1983
| Party | Candidate | Votes | % | ±% | |
|---|---|---|---|---|---|
| Labor | Peter Milton | 40,493 | 52.8 | +7.6 | |
| Liberal | Peter Nugent | 26,045 | 34.0 | −6.7 | |
| Democrats | Milton Blake | 8,010 | 10.5 | +0.1 | |
| Christian | Cornelis Hellema | 2,085 | 2.7 | +2.7 | |
| Total formal votes | 76,633 | 98.2 | |||
| Informal votes | 1,439 | 1.8 | |||
| Turnout | 78,072 | 96.2 | |||
| Two-party-preferred result | |||||
| Labor | Peter Milton | 60.9 | +8.6 | ||
| Liberal | Peter Nugent | 39.1 | −8.6 | ||
| Labor hold | Swing | +8.6 | |||
Lalor
- This section is an excerpt from Electoral results for the Division of Lalor § 1983
| Party | Candidate | Votes | % | ±% | |
|---|---|---|---|---|---|
| Labor | Barry Jones | 55,640 | 68.0 | −0.3 | |
| Liberal | John Fahey | 21,442 | 26.2 | +0.6 | |
| Democrats | Ivan Pollock | 4,040 | 4.9 | −1.1 | |
| Socialist Workers | Helen Said | 719 | 0.9 | +0.9 | |
| Total formal votes | 81,841 | 97.6 | |||
| Informal votes | 2,914 | 3.4 | |||
| Turnout | 84,755 | 96.0 | |||
| Two-party-preferred result | |||||
| Labor | Barry Jones | 71.8 | −0.1 | ||
| Liberal | John Fahey | 28.2 | +0.1 | ||
| Labor hold | Swing | −0.1 | |||
Mallee
- This section is an excerpt from Electoral results for the Division of Mallee § 1983
| Party | Candidate | Votes | % | ±% | |
|---|---|---|---|---|---|
| National | Peter Fisher | 40,063 | 62.1 | +14.9 | |
| Labor | Graeme Jarry | 16,193 | 25.1 | +1.2 | |
| Liberal | Ross Owen | 6,139 | 9.5 | −11.9 | |
| Democrats | Colin Kavanagh | 2,130 | 3.3 | −1.1 | |
| Total formal votes | 64,525 | 98.1 | |||
| Informal votes | 1,269 | 1.9 | |||
| Turnout | 65,794 | 95.8 | |||
| Two-party-preferred result | |||||
| National | Peter Fisher | 72.0 | +1.2 | ||
| Labor | Graeme Jarry | 28.0 | −1.2 | ||
| National hold | Swing | +1.2 | |||
Maribyrnong
- This section is an excerpt from Electoral results for the Division of Maribyrnong § 1983
| Party | Candidate | Votes | % | ±% | |
|---|---|---|---|---|---|
| Labor | Alan Griffiths | 41,924 | 56.6 | +2.0 | |
| Liberal | Geoffrey Ireland | 24,400 | 33.0 | -2.1 | |
| Democrats | Henrik Jersic | 4,452 | 6.0 | -4.2 | |
| Socialist Workers | Peter Beharell | 2,420 | 3.3 | +3.3 | |
| Australia | Richard Wright | 844 | 1.1 | +1.1 | |
| Total formal votes | 74,040 | 97.4 | |||
| Informal votes | 2,001 | 2.6 | |||
| Turnout | 76,041 | 96.7 | |||
| Two-party-preferred result | |||||
| Labor | Alan Griffiths | 63.8 | +3.1 | ||
| Liberal | Geoffrey Ireland | 36.2 | -3.1 | ||
| Labor hold | Swing | +3.1 | |||
McMillan
- This section is an excerpt from Electoral results for the Division of McMillan § 1983
| Party | Candidate | Votes | % | ±% | |
|---|---|---|---|---|---|
| Labor | Barry Cunningham | 34,099 | 48.3 | +5.4 | |
| Liberal | Greg Ross | 27,831 | 39.5 | -4.7 | |
| Democrats | Gloria Auchterlonie | 4,062 | 5.8 | -1.5 | |
| National | Stewart Robertson | 3,317 | 4.7 | +4.7 | |
| Democratic Labor | John Sellens | 1,219 | 1.7 | -3.3 | |
| Total formal votes | 70,528 | 97.9 | |||
| Informal votes | 1,548 | 2.1 | |||
| Turnout | 72,076 | 96.2 | |||
| Two-party-preferred result | |||||
| Labor | Barry Cunningham | 37,433 | 53.1 | +1.7 | |
| Liberal | Greg Ross | 33,095 | 46.9 | -1.7 | |
| Labor hold | Swing | +1.7 | |||
Melbourne
- This section is an excerpt from Electoral results for the Division of Melbourne § 1983
| Party | Candidate | Votes | % | ±% | |
|---|---|---|---|---|---|
| Labor | Gerry Hand | 38,694 | 63.7 | +3.0 | |
| Liberal | Robert Fallshaw | 14,370 | 23.6 | -4.5 | |
| Democrats | Chris Carter | 6,271 | 10.3 | +3.2 | |
| Socialist Workers | James McIlroy | 750 | 1.2 | +1.2 | |
| Imperial British | James Ferrari | 678 | 1.1 | -0.4 | |
| Total formal votes | 60,763 | 96.7 | |||
| Informal votes | 2,074 | 3.3 | |||
| Turnout | 62,837 | 92.3 | |||
| Two-party-preferred result | |||||
| Labor | Gerry Hand | 70.2 | +3.1 | ||
| Liberal | Robert Fallshaw | 29.8 | -3.1 | ||
| Labor hold | Swing | +3.1 | |||
Melbourne Ports
- This section is an excerpt from Electoral results for the Division of Melbourne Ports § 1983
| Party | Candidate | Votes | % | ±% | |
|---|---|---|---|---|---|
| Labor | Clyde Holding | 36,444 | 59.7 | +2.7 | |
| Liberal | Ronald Flood | 20,488 | 33.5 | -0.4 | |
| Democrats | John Sutcliffe | 3,556 | 5.8 | -1.5 | |
| Socialist Workers | Brett Trenery | 595 | 1.0 | +1.0 | |
| Total formal votes | 61,083 | 97.3 | |||
| Informal votes | 1,688 | 2.7 | |||
| Turnout | 62,751 | 91.6 | |||
| Two-party-preferred result | |||||
| Labor | Clyde Holding | 64.1 | +1.8 | ||
| Liberal | Ronald Flood | 35.9 | -1.8 | ||
| Labor hold | Swing | +1.8 | |||
Murray
- This section is an excerpt from Electoral results for the Division of Murray § 1983
| Party | Candidate | Votes | % | ±% | |
|---|---|---|---|---|---|
| National | Bruce Lloyd | 36,433 | 53.3 | +7.1 | |
| Labor | Mark Anderson | 16,684 | 24.4 | +0.5 | |
| Liberal | Anne Adams | 11,727 | 17.2 | -5.1 | |
| Democrats | John Weir | 2,640 | 3.9 | -2.0 | |
| Independent | Diane Teasdale | 835 | 1.2 | -0.6 | |
| Total formal votes | 68,319 | 97.8 | |||
| Informal votes | 1,506 | 2.2 | |||
| Turnout | 69,825 | 96.8 | |||
| Two-party-preferred result | |||||
| National | Bruce Lloyd | 71.3 | +3.8 | ||
| Labor | Mark Anderson | 28.7 | -3.8 | ||
| National hold | Swing | +3.8 | |||
Scullin
- This section is an excerpt from Electoral results for the Division of Scullin § 1983
| Party | Candidate | Votes | % | ±% | |
|---|---|---|---|---|---|
| Labor | Harry Jenkins | 51,312 | 66.4 | -0.7 | |
| Liberal | Katheryne Savage | 19,519 | 25.3 | -1.7 | |
| Democrats | Kenneth Peak | 3,528 | 4.6 | -1.2 | |
| Socialist Workers | Joan Barker | 2,886 | 3.7 | +3.7 | |
| Total formal votes | 77,245 | 97.0 | |||
| Informal votes | 2,352 | 3.0 | |||
| Turnout | 79,597 | 96.3 | |||
| Two-party-preferred result | |||||
| Labor | Harry Jenkins | 72.6 | +2.0 | ||
| Liberal | Katheryne Savage | 27.4 | -2.0 | ||
| Labor hold | Swing | +2.0 | |||
Wannon
- This section is an excerpt from Electoral results for the Division of Wannon § 1983
| Party | Candidate | Votes | % | ±% | |
|---|---|---|---|---|---|
| Liberal | Malcolm Fraser | 37,792 | 57.6 | -0.8 | |
| Labor | Nancy Genardini | 24,359 | 37.2 | +2.1 | |
| Democrats | Harold Jeffrey | 3,416 | 5.2 | +1.1 | |
| Total formal votes | 65,567 | 98.7 | |||
| Informal votes | 865 | 1.3 | |||
| Turnout | 66,432 | 97.0 | |||
| Two-party-preferred result | |||||
| Liberal | Malcolm Fraser | 59.7 | -1.5 | ||
| Labor | Nancy Genardini | 40.3 | +1.5 | ||
| Liberal hold | Swing | -1.5 | |||
Wills
- This section is an excerpt from Electoral results for the Division of Wills § 1983
| Party | Candidate | Votes | % | ±% | |
|---|---|---|---|---|---|
| Labor | Bob Hawke | 45,571 | 67.6 | +2.5 | |
| Liberal | Mark Hoysted | 14,773 | 21.9 | -4.5 | |
| Democrats | John Hallam | 4,225 | 6.3 | +2.6 | |
| Socialist Labour | Martin Mantell | 1,287 | 1.9 | +1.2 | |
| Democratic Labor | Michael Verberne | 1,145 | 1.7 | -0.2 | |
| Socialist Workers | Solomon Salby | 206 | 0.3 | -0.7 | |
| Imperial British | Cecil G. Murgatroyd | 174 | 0.3 | +0.3 | |
| Total formal votes | 67,381 | 96.2 | |||
| Informal votes | 2,660 | 3.8 | |||
| Turnout | 70,041 | 95.3 | |||
| Two-party-preferred result | |||||
| Labor | Bob Hawke | 74.1 | +4.2 | ||
| Liberal | Mark Hoysted | 25.9 | -4.2 | ||
| Labor hold | Swing | +4.2 | |||
Queensland
| ||||||||||||||||||||||||||||||||||
All 19 Queensland seats in the House of Representatives 10 seats needed for a majority | ||||||||||||||||||||||||||||||||||
|---|---|---|---|---|---|---|---|---|---|---|---|---|---|---|---|---|---|---|---|---|---|---|---|---|---|---|---|---|---|---|---|---|---|---|
| ||||||||||||||||||||||||||||||||||
Bowman
- This section is an excerpt from Electoral results for the Division of Bowman § 1983
| Party | Candidate | Votes | % | ±% | |
|---|---|---|---|---|---|
| Labor | Len Keogh | 37,666 | 49.7 | +3.8 | |
| Liberal | David Jull | 30,522 | 40.3 | −8.5 | |
| National | Craig Brown | 4,579 | 6.0 | +6.0 | |
| Democrats | Ronald Heindorff | 3,040 | 4.0 | −1.3 | |
| Total formal votes | 75,807 | 98.8 | |||
| Informal votes | 945 | 1.2 | |||
| Turnout | 76,752 | 93.3 | |||
| Two-party-preferred result | |||||
| Labor | Len Keogh | 52.2 | +3.4 | ||
| Liberal | David Jull | 47.8 | −3.4 | ||
| Labor gain from Liberal | Swing | +3.4 | |||
Brisbane
- This section is an excerpt from Electoral results for the Division of Brisbane § 1983
| Party | Candidate | Votes | % | ±% | |
|---|---|---|---|---|---|
| Labor | Manfred Cross | 31,596 | 50.4 | +2.3 | |
| Liberal | Richard Magnus | 20,566 | 32.8 | −11.9 | |
| National | Bradley Garrett | 5,447 | 8.7 | +8.7 | |
| Democrats | Lance Winter | 3,462 | 5.5 | −0.5 | |
| Socialist Workers | Susanne Bolton | 1,565 | 2.5 | +2.5 | |
| Total formal votes | 62,636 | 98.6 | |||
| Informal votes | 864 | 1.4 | |||
| Turnout | 63,500 | 91.9 | |||
| Two-party-preferred result | |||||
| Labor | Manfred Cross | 56.9 | +5.1 | ||
| Liberal | Richard Magnus | 43.1 | −5.1 | ||
| Labor hold | Swing | +5.1 | |||
Capricornia
- This section is an excerpt from Electoral results for the Division of Capricornia § 1983
| Party | Candidate | Votes | % | ±% | |
|---|---|---|---|---|---|
| Labor | Doug Everingham | 36,662 | 54.4 | +3.5 | |
| National | Robert Simpson | 11,480 | 17.0 | −7.8 | |
| Liberal | Alan Agnew | 11,465 | 17.0 | +4.9 | |
| National | Helen Reeves | 5,620 | 8.3 | +8.3 | |
| Democrats | Gregory Read | 1,881 | 2.8 | −0.6 | |
| Socialist | David Ryan | 226 | 0.3 | +0.3 | |
| Total formal votes | 67,334 | 98.9 | |||
| Informal votes | 754 | 1.1 | |||
| Turnout | 68,088 | 94.0 | |||
| Two-party-preferred result | |||||
| Labor | Doug Everingham | 59.9 | +5.6 | ||
| National | Robert Simpson | 40.1 | −5.6 | ||
| Labor hold | Swing | +5.6 | |||
Darling Downs
- This section is an excerpt from Electoral results for the Division of Darling Downs § 1983
| Party | Candidate | Votes | % | ±% | |
|---|---|---|---|---|---|
| National | Tom McVeigh | 42,627 | 61.7 | -1.6 | |
| Labor | Ronald Cullin | 22,524 | 32.6 | +2.7 | |
| Democrats | David Groves | 3,960 | 5.7 | +0.2 | |
| Total formal votes | 69,111 | 99.0 | |||
| Informal votes | 715 | 1.0 | |||
| Turnout | 69,826 | 93.9 | |||
| Two-party-preferred result | |||||
| National | Tom McVeigh | 64.0 | -1.8 | ||
| Labor | Ronald Cullin | 36.0 | +1.8 | ||
| National hold | Swing | -1.8 | |||
Dawson
- This section is an excerpt from Electoral results for the Division of Dawson § 1983
| Party | Candidate | Votes | % | ±% | |
|---|---|---|---|---|---|
| National | Ray Braithwaite | 35,686 | 50.1 | +0.0 | |
| Labor | Barbara Hill | 34,229 | 48.1 | +2.9 | |
| Independent | Raymond Jensen | 426 | 0.6 | +0.6 | |
| Independent | Eric Geissmann | 423 | 0.6 | +0.6 | |
| Progress | Kelly Crombie | 420 | 0.6 | +0.1 | |
| Total formal votes | 71,184 | 98.9 | |||
| Informal votes | 815 | 1.1 | |||
| Turnout | 71,999 | 92.6 | |||
| Two-party-preferred result | |||||
| National | Ray Braithwaite | 51.2 | -6.7 | ||
| Labor | Barbara Hill | 48.8 | +6.7 | ||
| National hold | Swing | -6.7 | |||
Fadden
- This section is an excerpt from Electoral results for the Division of Fadden § 1983
| Party | Candidate | Votes | % | ±% | |
|---|---|---|---|---|---|
| Labor | David Beddall | 44,412 | 48.3 | +4.7 | |
| Liberal | Don Cameron | 35,692 | 38.8 | -9.2 | |
| National | Howard Edmunds | 7,251 | 7.9 | +7.9 | |
| Democrats | Murray Hallam | 3,806 | 4.1 | -3.4 | |
| Socialist | Raymond Ferguson | 505 | 0.5 | +0.5 | |
| Progress | Dallas Graham | 276 | 0.3 | -0.5 | |
| Total formal votes | 91,942 | 98.4 | |||
| Informal votes | 1,476 | 1.6 | |||
| Turnout | 93,418 | 92.6 | |||
| Two-party-preferred result | |||||
| Labor | David Beddall | 51.7 | +3.1 | ||
| Liberal | Don Cameron | 48.3 | -3.1 | ||
| Labor gain from Liberal | Swing | +3.1 | |||
Fisher
- This section is an excerpt from Electoral results for the Division of Fisher § 1983
| Party | Candidate | Votes | % | ±% | |
|---|---|---|---|---|---|
| National | Evan Adermann | 36,848 | 39.9 | -13.4 | |
| Labor | Sol Theo | 35,220 | 38.2 | +3.4 | |
| Liberal | Dennis Caswell | 13,414 | 14.5 | +14.5 | |
| Democrats | Garry Somerville | 6,764 | 7.3 | -0.8 | |
| Total formal votes | 92,246 | 99.0 | |||
| Informal votes | 960 | 1.0 | |||
| Turnout | 93,206 | 93.2 | |||
| Two-party-preferred result | |||||
| National | Evan Adermann | 52,691 | 57.1 | -1.8 | |
| Labor | Sol Theo | 39,555 | 42.9 | +1.8 | |
| National hold | Swing | -1.8 | |||
Griffith
- This section is an excerpt from Electoral results for the Division of Griffith § 1983
| Party | Candidate | Votes | % | ±% | |
|---|---|---|---|---|---|
| Labor | Ben Humphreys | 32,597 | 57.9 | +2.1 | |
| Liberal | Graham Young | 18,545 | 32.9 | +5.2 | |
| Democrats | Carole Ames | 3,777 | 6.7 | +2.4 | |
| Socialist Labour | Michael Fulton | 750 | 1.3 | +1.3 | |
| Socialist Workers | Julie Walkington | 620 | 1.1 | -2.9 | |
| Total formal votes | 56,289 | 97.7 | |||
| Informal votes | 1,301 | 2.3 | |||
| Turnout | 57,590 | 89.2 | |||
| Two-party-preferred result | |||||
| Labor | Ben Humphreys | 64.5 | +1.6 | ||
| Liberal | Graham Young | 35.5 | -1.6 | ||
| Labor hold | Swing | +1.6 | |||
Herbert
- This section is an excerpt from Electoral results for the Division of Herbert § 1983
| Party | Candidate | Votes | % | ±% | |
|---|---|---|---|---|---|
| Labor | Ted Lindsay | 35,368 | 50.2 | +3.7 | |
| Liberal | Gordon Dean | 23,875 | 33.9 | -13.9 | |
| National | John Aubrey | 9,562 | 13.6 | +13.6 | |
| Democrats | John Lamb | 1,597 | 2.3 | -3.3 | |
| Total formal votes | 70,402 | 99.1 | |||
| Informal votes | 659 | 0.9 | |||
| Turnout | 71,061 | 90.7 | |||
| Two-party-preferred result | |||||
| Labor | Ted Lindsay | 52.8 | +3.7 | ||
| Liberal | Gordon Dean | 47.2 | -3.7 | ||
| Labor gain from Liberal | Swing | +3.7 | |||
Kennedy
- This section is an excerpt from Electoral results for the Division of Kennedy § 1983
| Party | Candidate | Votes | % | ±% | |
|---|---|---|---|---|---|
| National | Bob Katter, Sr. | 32,871 | 56.6 | -3.6 | |
| Labor | Brigid Walsh | 22,407 | 38.6 | +2.6 | |
| Democrats | George Hannaford | 2,757 | 4.8 | +4.8 | |
| Total formal votes | 58,035 | 98.7 | |||
| Informal votes | 748 | 1.3 | |||
| Turnout | 58,783 | 90.8 | |||
| Two-party-preferred result | |||||
| National | Bob Katter, Sr. | 59.1 | -3.6 | ||
| Labor | Brigid Walsh | 40.9 | +3.6 | ||
| National hold | Swing | -3.6 | |||
Leichhardt
- This section is an excerpt from Electoral results for the Division of Leichhardt § 1983
| Party | Candidate | Votes | % | ±% | |
|---|---|---|---|---|---|
| Labor | John Gayler | 35,071 | 52.1 | +5.8 | |
| National | David Thomson | 32,285 | 47.9 | -1.0 | |
| Total formal votes | 67,356 | 98.2 | |||
| Informal votes | 1,251 | 1.8 | |||
| Turnout | 68,607 | 91.5 | |||
| Labor gain from National | Swing | +3.2 | |||
Lilley
- This section is an excerpt from Electoral results for the Division of Lilley § 1983
| Party | Candidate | Votes | % | ±% | |
|---|---|---|---|---|---|
| Labor | Elaine Darling | 35,350 | 57.2 | +9.2 | |
| Liberal | Jim Anderson | 24,249 | 39.3 | -7.9 | |
| Democrats | Gael Paul | 1,779 | 2.9 | -1.9 | |
| Independent | Anthony Catip | 375 | 0.6 | +0.6 | |
| Total formal votes | 61,753 | 98.9 | |||
| Informal votes | 687 | 1.1 | |||
| Turnout | 62,440 | 93.9 | |||
| Two-party-preferred result | |||||
| Labor | Elaine Darling | 59.2 | +8.4 | ||
| Liberal | Jim Anderson | 40.8 | -8.4 | ||
| Labor hold | Swing | +8.4 | |||
Maranoa
- This section is an excerpt from Electoral results for the Division of Maranoa § 1983
| Party | Candidate | Votes | % | ±% | |
|---|---|---|---|---|---|
| National | Ian Cameron | 39,591 | 62.9 | +5.6 | |
| Labor | Warren Keats | 19,057 | 30.3 | +0.8 | |
| Democrats | Austin Brannigan | 4,300 | 6.8 | +2.9 | |
| Total formal votes | 62,948 | 98.9 | |||
| Informal votes | 723 | 1.1 | |||
| Turnout | 63,671 | 93.7 | |||
| Two-party-preferred result | |||||
| National | Ian Cameron | 66.2 | -0.9 | ||
| Labor | Warren Keats | 33.8 | +0.9 | ||
| National hold | Swing | -0.9 | |||
McPherson
- This section is an excerpt from Electoral results for the Division of McPherson § 1983
| Party | Candidate | Votes | % | ±% | |
|---|---|---|---|---|---|
| Liberal | Peter White | 31,118 | 35.9 | -7.4 | |
| Labor | Darryl McArthur | 29,265 | 33.8 | +3.0 | |
| National | Trevor Watt | 20,328 | 23.5 | +23.5 | |
| Democrats | Kenneth Peterson | 4,254 | 4.9 | -0.1 | |
| Humanitarian | Peter Courtney | 1,687 | 1.9 | +1.9 | |
| Total formal votes | 86,652 | 98.5 | |||
| Informal votes | 1,277 | 1.5 | |||
| Turnout | 87,929 | 92.0 | |||
| Two-party-preferred result | |||||
| Liberal | Peter White | 52,282 | 60.3 | +6.7 | |
| Labor | Darryl McArthur | 34,370 | 39.7 | -6.7 | |
| Liberal hold | Swing | +6.7 | |||
Moreton
- This section is an excerpt from Electoral results for the Division of Moreton § 1983
| Party | Candidate | Votes | % | ±% | |
|---|---|---|---|---|---|
| Liberal | Sir James Killen | 29,638 | 46.7 | -4.0 | |
| Labor | Barbara Robson | 28,854 | 45.5 | +3.2 | |
| Democrats | Leonard Fitzgerald | 4,230 | 6.7 | +2.0 | |
| Socialist Workers | Helen Jones | 712 | 1.1 | +1.1 | |
| Total formal votes | 63,434 | 98.5 | |||
| Informal votes | 987 | 1.5 | |||
| Turnout | 64,421 | 92.8 | |||
| Two-party-preferred result | |||||
| Liberal | Sir James Killen | 32,728 | 51.6 | -3.0 | |
| Labor | Barbara Robson | 30,706 | 48.4 | +3.0 | |
| Liberal hold | Swing | -3.0 | |||
Oxley
- This section is an excerpt from Electoral results for the Division of Oxley § 1983
| Party | Candidate | Votes | % | ±% | |
|---|---|---|---|---|---|
| Labor | Bill Hayden | 49,837 | 66.9 | +2.8 | |
| Liberal | Les Woodforth | 20,346 | 27.3 | -1.8 | |
| Democrats | Wayne Martin | 3,699 | 5.0 | +0.9 | |
| Socialist Workers | Juanita Keig | 668 | 0.9 | +0.9 | |
| Total formal votes | 74,550 | 98.7 | |||
| Informal votes | 957 | 1.3 | |||
| Turnout | 75,507 | 93.5 | |||
| Two-party-preferred result | |||||
| Labor | Bill Hayden | 70.7 | +1.9 | ||
| Liberal | Les Woodforth | 29.3 | -1.9 | ||
| Labor hold | Swing | +1.9 | |||
Petrie
- This section is an excerpt from Electoral results for the Division of Petrie § 1983
| Party | Candidate | Votes | % | ±% | |
|---|---|---|---|---|---|
| Labor | Deane Wells | 33,283 | 47.0 | +4.3 | |
| Liberal | John Hodges | 31,227 | 44.1 | -3.9 | |
| Democrats | Ray Hollis | 4,506 | 6.4 | -0.4 | |
| Independent | Christopher Caldwell | 1,453 | 2.0 | +2.0 | |
| Progress | Phillip Grimison | 411 | 0.6 | -2.0 | |
| Total formal votes | 70,880 | 98.6 | |||
| Informal votes | 1,003 | 1.4 | |||
| Turnout | 71,883 | 93.4 | |||
| Two-party-preferred result | |||||
| Labor | Deane Wells | 35,800 | 50.5 | +3.9 | |
| Liberal | John Hodges | 35,080 | 49.5 | -3.9 | |
| Labor gain from Liberal | Swing | +3.9 | |||
Ryan
- This section is an excerpt from Electoral results for the Division of Ryan § 1983
| Party | Candidate | Votes | % | ±% | |
|---|---|---|---|---|---|
| Liberal | John Moore | 37,873 | 53.1 | -2.0 | |
| Labor | Michael Foley | 25,386 | 35.6 | +1.6 | |
| Democrats | John Elfick | 5,975 | 8.4 | -0.6 | |
| Independent | Anthony Crooks | 1,135 | 1.6 | +1.6 | |
| Independent | Patrick Cusack | 964 | 1.4 | +1.4 | |
| Total formal votes | 71,333 | 98.2 | |||
| Informal votes | 862 | 1.2 | |||
| Turnout | 72,195 | 92.7 | |||
| Two-party-preferred result | |||||
| Liberal | John Moore | 57.5 | -2.9 | ||
| Labor | Michael Foley | 42.5 | +2.9 | ||
| Liberal hold | Swing | -2.9 | |||
Wide Bay
- This section is an excerpt from Electoral results for the Division of Wide Bay § 1983
| Party | Candidate | Votes | % | ±% | |
|---|---|---|---|---|---|
| National | Clarrie Millar | 35,472 | 48.9 | -1.5 | |
| Labor | James Finemore | 32,362 | 44.6 | +4.2 | |
| Democrats | Mervyn Worth | 2,850 | 3.9 | -2.8 | |
| Progress | Raymond Bird | 1,813 | 2.5 | +0.0 | |
| Total formal votes | 72,497 | 98.9 | |||
| Informal votes | 806 | 1.1 | |||
| Turnout | 73,303 | 94.1 | |||
| Two-party-preferred result | |||||
| National | Clarrie Millar | 37,602 | 51.9 | -2.5 | |
| Labor | James Finemore | 34,895 | 48.1 | +2.5 | |
| National hold | Swing | -2.5 | |||
South Australia
| ||||||||||||||||||||||||||||||||||
All 11 SA seats in the House of Representatives 6 seats needed for a majority | ||||||||||||||||||||||||||||||||||
|---|---|---|---|---|---|---|---|---|---|---|---|---|---|---|---|---|---|---|---|---|---|---|---|---|---|---|---|---|---|---|---|---|---|---|
| ||||||||||||||||||||||||||||||||||
Adelaide
- This section is an excerpt from Electoral results for the Division of Adelaide § 1983
| Party | Candidate | Votes | % | ±% | |
|---|---|---|---|---|---|
| Labor | Chris Hurford | 39,134 | 55.8 | +3.7 | |
| Liberal | Barry James | 24,156 | 34.4 | −1.8 | |
| Democrats | Eileen Farmer | 4,604 | 6.6 | −5.1 | |
| Independent | John Buik | 1,894 | 2.7 | +2.7 | |
| Socialist Workers | Paul Petit | 385 | 0.5 | +0.5 | |
| Total formal votes | 70,173 | 96.8 | |||
| Informal votes | 2,314 | 3.2 | |||
| Turnout | 72,487 | 93.5 | |||
| Two-party-preferred result | |||||
| Labor | Chris Hurford | 62.6 | +4.1 | ||
| Liberal | Barry James | 37.4 | −4.1 | ||
| Labor hold | Swing | +4.1 | |||
Barker
- This section is an excerpt from Electoral results for the Division of Barker § 1983
| Party | Candidate | Votes | % | ±% | |
|---|---|---|---|---|---|
| Liberal | James Porter | 42,333 | 57.3 | −0.2 | |
| Labor | Valerie Young | 23,906 | 32.4 | +3.5 | |
| Democrats | Meg Lees | 3,974 | 5.4 | −0.2 | |
| National | Anthony Beck | 3,650 | 4.9 | −3.2 | |
| Total formal votes | 73,863 | 97.7 | |||
| Informal votes | 1,717 | 2.3 | |||
| Turnout | 75,580 | 96.0 | |||
| Two-party-preferred result | |||||
| Liberal | James Porter | 63.8 | −2.3 | ||
| Labor | Valerie Young | 36.2 | +2.3 | ||
| Liberal hold | Swing | −2.3 | |||
Bonython
- This section is an excerpt from Electoral results for the Division of Bonython § 1983
| Party | Candidate | Votes | % | ±% | |
|---|---|---|---|---|---|
| Labor | Neal Blewett | 48,097 | 60.5 | +6.1 | |
| Liberal | Neville Joyce | 24,391 | 30.7 | −2.0 | |
| Democrats | John Longhurst | 7,006 | 8.8 | −2.3 | |
| Total formal votes | 79,494 | 97.1 | |||
| Informal votes | 2,340 | 2.9 | |||
| Turnout | 81,834 | 94.1 | |||
| Two-party-preferred result | |||||
| Labor | Neal Blewett | 65.8 | +3.4 | ||
| Liberal | Neville Joyce | 34.2 | −3.4 | ||
| Labor hold | Swing | +3.4 | |||
Boothby
- This section is an excerpt from Electoral results for the Division of Boothby § 1983
| Party | Candidate | Votes | % | ±% | |
|---|---|---|---|---|---|
| Liberal | Steele Hall | 42,676 | 55.1 | −1.1 | |
| Labor | Bruce Whyatt | 26,343 | 34.0 | +4.3 | |
| Democrats | John Coulter | 8,424 | 10.9 | −2.2 | |
| Total formal votes | 77,443 | 98.3 | |||
| Informal votes | 1,332 | 1.7 | |||
| Turnout | 78,775 | 95.9 | |||
| Two-party-preferred result | |||||
| Liberal | Steele Hall | 60.1 | −2.5 | ||
| Labor | Bruce Whyatt | 39.9 | +2.5 | ||
| Liberal hold | Swing | −2.5 | |||
Grey
- This section is an excerpt from Electoral results for the Division of Grey § 1983
| Party | Candidate | Votes | % | ±% | |
|---|---|---|---|---|---|
| Labor | Lloyd O'Neil | 35,276 | 51.0 | +0.9 | |
| Liberal | Joy Baluch | 24,114 | 34.9 | -5.5 | |
| Democrats | Jack Babbage | 3,981 | 5.8 | +1.2 | |
| National | Anthony Haskett | 3,454 | 5.0 | +0.1 | |
| Independent | James Cronin | 1,556 | 2.3 | +2.3 | |
| Libertarian | Kerry Hawkes | 732 | 1.1 | +1.1 | |
| Total formal votes | 69,113 | 96.9 | |||
| Informal votes | 2,207 | 3.1 | |||
| Turnout | 71,320 | 95.2 | |||
| Two-party-preferred result | |||||
| Labor | Lloyd O'Neil | 56.1 | +2.7 | ||
| Liberal | Joy Baluch | 43.9 | -2.7 | ||
| Labor hold | Swing | +2.7 | |||
Hawker
- This section is an excerpt from Electoral results for the Division of Hawker § 1983
| Party | Candidate | Votes | % | ±% | |
|---|---|---|---|---|---|
| Labor | Ralph Jacobi | 36,483 | 52.1 | +2.7 | |
| Liberal | Bruce Harry | 27,211 | 38.8 | -3.5 | |
| Democrats | Graham Pamount | 4,792 | 6.8 | -1.5 | |
| Socialist Workers | John Garcia | 1,568 | 2.2 | +2.2 | |
| Total formal votes | 70,054 | 97.5 | |||
| Informal votes | 1,769 | 2.5 | |||
| Turnout | 71,823 | 93.8 | |||
| Two-party-preferred result | |||||
| Labor | Ralph Jacobi | 57.3 | +3.5 | ||
| Liberal | Bruce Harry | 42.7 | -3.5 | ||
| Labor hold | Swing | +3.5 | |||
Hindmarsh
- This section is an excerpt from Electoral results for the Division of Hindmarsh § 1983
| Party | Candidate | Votes | % | ±% | |
|---|---|---|---|---|---|
| Labor | John Scott | 39,496 | 53.7 | +5.7 | |
| Liberal | Barry Lewis | 26,280 | 35.8 | -2.7 | |
| Democrats | Jim Mitchell | 5,592 | 7.6 | -1.6 | |
| Socialist Workers | Lotus Cavagnino | 2,139 | 2.9 | +0.7 | |
| Total formal votes | 73,507 | 96.9 | |||
| Informal votes | 2,352 | 3.1 | |||
| Turnout | 75,859 | 95.2 | |||
| Two-party-preferred result | |||||
| Labor | John Scott | 60.0 | +3.8 | ||
| Liberal | Barry Lewis | 40.0 | -3.8 | ||
| Labor hold | Swing | +3.8 | |||
Kingston
- This section is an excerpt from Electoral results for the Division of Kingston § 1983
| Party | Candidate | Votes | % | ±% | |
|---|---|---|---|---|---|
| Labor | Gordon Bilney | 40,019 | 50.0 | +5.3 | |
| Liberal | Grant Chapman | 35,057 | 43.8 | -2.5 | |
| Democrats | Robert Ralph | 5,038 | 6.3 | -2.7 | |
| Total formal votes | 80,114 | 98.2 | |||
| Informal votes | 1,488 | 1.8 | |||
| Turnout | 81,602 | 95.5 | |||
| Two-party-preferred result | |||||
| Labor | Gordon Bilney | 42,568 | 53.1 | +3.3 | |
| Liberal | Grant Chapman | 37,546 | 46.9 | -3.3 | |
| Labor gain from Liberal | Swing | +3.3 | |||
Port Adelaide
- This section is an excerpt from Electoral results for the Division of Port Adelaide § 1983
| Party | Candidate | Votes | % | ±% | |
|---|---|---|---|---|---|
| Labor | Mick Young | 48,865 | 68.0 | +5.0 | |
| Liberal | Robin Rickards | 16,567 | 23.0 | -5.3 | |
| Socialist Workers | Robert Fisher | 3,093 | 4.3 | +4.3 | |
| Democrats | Benjamin Michael | 2,484 | 3.5 | -3.5 | |
| Communist | Donald Sutherland | 888 | 1.2 | -0.6 | |
| Total formal votes | 71,897 | 95.9 | |||
| Informal votes | 3,086 | 4.1 | |||
| Turnout | 74,983 | 94.5 | |||
| Two-party-preferred result | |||||
| Labor | Mick Young | 74.2 | +5.4 | ||
| Liberal | Robin Rickards | 25.8 | -5.4 | ||
| Labor hold | Swing | +5.4 | |||
Sturt
- This section is an excerpt from Electoral results for the Division of Sturt § 1983
| Party | Candidate | Votes | % | ±% | |
|---|---|---|---|---|---|
| Liberal | Ian Wilson | 36,656 | 48.4 | -2.5 | |
| Labor | Sergio Ubaldi | 32,350 | 42.7 | +2.2 | |
| Democrats | Alison Dolling | 6,764 | 8.9 | +0.8 | |
| Total formal votes | 75,770 | 97.5 | |||
| Informal votes | 1,959 | 2.5 | |||
| Turnout | 77,729 | 96.0 | |||
| Two-party-preferred result | |||||
| Liberal | Ian Wilson | 39,379 | 52.0 | -2.0 | |
| Labor | Sergio Ubaldi | 36,391 | 48.0 | +2.0 | |
| Liberal hold | Swing | -2.0 | |||
Wakefield
- This section is an excerpt from Electoral results for the Division of Wakefield § 1983
| Party | Candidate | Votes | % | ±% | |
|---|---|---|---|---|---|
| Liberal | Neil Andrew | 43,380 | 59.5 | -0.3 | |
| Labor | Suzanne Owens | 24,002 | 32.9 | +3.9 | |
| Democrats | Donald Chisholm | 3,851 | 5.3 | -3.2 | |
| National | Roger Cavanagh | 1,658 | 2.3 | -0.4 | |
| Total formal votes | 72,891 | 97.6 | |||
| Informal votes | 1,816 | 2.4 | |||
| Turnout | 74,707 | 95.5 | |||
| Two-party-preferred result | |||||
| Liberal | Neil Andrew | 63.7 | -2.5 | ||
| Labor | Suzanne Owens | 36.3 | +2.5 | ||
| Liberal hold | Swing | -2.5 | |||
Western Australia
| ||||||||||||||||||||||||||||||||||
All 11 WA seats in the House of Representatives 6 seats needed for a majority | ||||||||||||||||||||||||||||||||||
|---|---|---|---|---|---|---|---|---|---|---|---|---|---|---|---|---|---|---|---|---|---|---|---|---|---|---|---|---|---|---|---|---|---|---|
| ||||||||||||||||||||||||||||||||||
Canning
- This section is an excerpt from Electoral results for the Division of Canning § 1983
| Party | Candidate | Votes | % | ±% | |
|---|---|---|---|---|---|
| Labor | Wendy Fatin | 40,740 | 54.8 | +12.8 | |
| Liberal | Mel Bungey | 30,410 | 40.9 | -6.4 | |
| Democrats | Jean Ritter | 3,164 | 4.3 | -5.1 | |
| Total formal votes | 74,314 | 98.1 | |||
| Informal votes | 1,414 | 1.9 | |||
| Turnout | 75,728 | 94.1 | |||
| Two-party-preferred result | |||||
| Labor | Wendy Fatin | 57.4 | +9.2 | ||
| Liberal | Mel Bungey | 42.6 | -9.2 | ||
| Labor gain from Liberal | Swing | +9.2 | |||
Curtin
- This section is an excerpt from Electoral results for the Division of Curtin § 1983
| Party | Candidate | Votes | % | ±% | |
|---|---|---|---|---|---|
| Liberal | Allan Rocher | 30,404 | 51.7 | −7.2 | |
| Labor | Clive Kittson | 24,337 | 41.4 | +8.6 | |
| Democrats | Marjorie McKercher | 4,046 | 6.9 | −1.4 | |
| Total formal votes | 58,787 | 98.4 | |||
| Informal votes | 949 | 1.6 | |||
| Turnout | 59,736 | 93.5 | |||
| Two-party-preferred result | |||||
| Liberal | Allan Rocher | 54.5 | −7.8 | ||
| Labor | Clive Kittson | 45.5 | +7.8 | ||
| Liberal hold | Swing | −7.8 | |||
Forrest
- This section is an excerpt from Electoral results for the Division of Forrest § 1983
| Party | Candidate | Votes | % | ±% | |
|---|---|---|---|---|---|
| Liberal | Peter Drummond | 32,076 | 48.9 | -2.4 | |
| Labor | David Churches | 29,643 | 45.2 | +9.2 | |
| Democrats | Donald Stewart | 2,416 | 3.7 | -3.3 | |
| Independent | Alfred Bussell | 1,485 | 2.3 | +2.3 | |
| Total formal votes | 65,620 | 98.1 | |||
| Informal votes | 1,281 | 1.9 | |||
| Turnout | 66,901 | 94.7 | |||
| Two-party-preferred result | |||||
| Liberal | Peter Drummond | 33,735 | 51.4 | -8.4 | |
| Labor | David Churches | 31,885 | 48.6 | +8.4 | |
| Liberal hold | Swing | -8.4 | |||
Fremantle
- This section is an excerpt from Electoral results for the Division of Fremantle § 1983
| Party | Candidate | Votes | % | ±% | |
|---|---|---|---|---|---|
| Labor | John Dawkins | 43,326 | 63.3 | +5.2 | |
| Liberal | Max Adams | 22,025 | 32.2 | -2.1 | |
| Democrats | Colin Hull | 1,733 | 2.5 | -3.6 | |
| Socialist Labour | Timothy Peach | 970 | 1.4 | +1.4 | |
| Socialist Workers | Margo Condoleon | 360 | 0.5 | -1.0 | |
| Total formal votes | 68,414 | 97.5 | |||
| Informal votes | 1,779 | 2.5 | |||
| Turnout | 70,193 | 93.8 | |||
| Two-party-preferred result | |||||
| Labor | John Dawkins | 66.5 | +3.4 | ||
| Liberal | Max Adams | 33.5 | -3.4 | ||
| Labor hold | Swing | +3.4 | |||
Kalgoorlie
- This section is an excerpt from Electoral results for the Division of Kalgoorlie § 1983
| Party | Candidate | Votes | % | ±% | |
|---|---|---|---|---|---|
| Labor | Graeme Campbell | 34,843 | 56.6 | +11.4 | |
| Liberal | Douglas Krepp | 23,069 | 37.5 | -9.0 | |
| Democrats | Blair Nancarrow | 1,856 | 3.0 | -5.3 | |
| Independent | Joseph Boschetti | 1,778 | 2.9 | +2.9 | |
| Total formal votes | 61,546 | 97.7 | |||
| Informal votes | 1,459 | 2.3 | |||
| Turnout | 63,005 | 86.0 | |||
| Two-party-preferred result | |||||
| Labor | Graeme Campbell | 59.5 | +8.9 | ||
| Liberal | Douglas Krepp | 40.5 | -8.9 | ||
| Labor hold | Swing | +8.9 | |||
Moore
- This section is an excerpt from Electoral results for the Division of Moore § 1983
| Party | Candidate | Votes | % | ±% | |
|---|---|---|---|---|---|
| Labor | Allen Blanchard | 42,557 | 54.1 | +11.2 | |
| Liberal | John Hyde | 31,952 | 40.6 | -6.4 | |
| Democrats | Alan Needham | 4,120 | 5.2 | -2.6 | |
| Total formal votes | 78,629 | 98.4 | |||
| Informal votes | 1,255 | 1.6 | |||
| Turnout | 79,884 | 93.8 | |||
| Two-party-preferred result | |||||
| Labor | Allen Blanchard | 57.2 | +10.0 | ||
| Liberal | John Hyde | 42.8 | -10.0 | ||
| Labor gain from Liberal | Swing | +10.0 | |||
O'Connor
- This section is an excerpt from Electoral results for the Division of O'Connor § 1983
| Party | Candidate | Votes | % | ±% | |
|---|---|---|---|---|---|
| Liberal | Wilson Tuckey | 29,414 | 48.6 | +8.3 | |
| Labor | Kim Chance | 19,356 | 32.0 | +8.8 | |
| National | Brian Pearce | 5,999 | 9.9 | -8.3 | |
| National | James Ferguson | 3,686 | 6.1 | -8.9 | |
| Democrats | Denis Kidby | 2,105 | 3.5 | +0.2 | |
| Total formal votes | 60,560 | 97.9 | |||
| Informal votes | 1,303 | 2.1 | |||
| Turnout | 61,863 | 93.8 | |||
| Two-party-preferred result | |||||
| Liberal | Wilson Tuckey | 64.1 | +1.6 | ||
| Labor | Kim Chance | 35.9 | +35.9 | ||
| Liberal hold | Swing | +1.6 | |||
Perth
- This section is an excerpt from Electoral results for the Division of Perth § 1983
| Party | Candidate | Votes | % | ±% | |
|---|---|---|---|---|---|
| Labor | Ric Charlesworth | 34,108 | 54.7 | +9.0 | |
| Liberal | Ross McLean | 26,510 | 42.5 | -5.7 | |
| Democrats | Geoffrey Syme | 1,770 | 2.8 | -2.4 | |
| Total formal votes | 62,388 | 97.7 | |||
| Informal votes | 1,446 | 2.3 | |||
| Turnout | 63,834 | 92.5 | |||
| Two-party-preferred result | |||||
| Labor | Ric Charlesworth | 56.4 | +7.4 | ||
| Liberal | Ross McLean | 43.6 | -7.4 | ||
| Labor gain from Liberal | Swing | +7.4 | |||
Stirling
- This section is an excerpt from Electoral results for the Division of Stirling § 1983
| Party | Candidate | Votes | % | ±% | |
|---|---|---|---|---|---|
| Labor | Ron Edwards | 35,828 | 54.5 | +12.3 | |
| Liberal | Ian Viner | 27,181 | 41.4 | -7.5 | |
| Democrats | Maria Phillips | 2,695 | 4.1 | -2.7 | |
| Total formal votes | 65,704 | 98.3 | |||
| Informal votes | 1,143 | 1.7 | |||
| Turnout | 66,847 | 94.1 | |||
| Two-party-preferred result | |||||
| Labor | Ron Edwards | 57.0 | +9.0 | ||
| Liberal | Ian Viner | 43.0 | -9.0 | ||
| Labor gain from Liberal | Swing | +9.0 | |||
Swan
- This section is an excerpt from Electoral results for the Division of Swan § 1983
| Party | Candidate | Votes | % | ±% | |
|---|---|---|---|---|---|
| Labor | Kim Beazley | 38,908 | 62.7 | +9.4 | |
| Liberal | Jeffrey Roberts | 19,825 | 32.0 | -8.1 | |
| Democrats | Kevin Trent | 2,662 | 4.3 | -1.1 | |
| Socialist Workers | Linda Mere | 621 | 1.0 | -0.2 | |
| Total formal votes | 62,016 | 97.8 | |||
| Informal votes | 1,391 | 2.2 | |||
| Turnout | 63,407 | 92.9 | |||
| Two-party-preferred result | |||||
| Labor | Kim Beazley | 66.2 | +8.6 | ||
| Liberal | Jeffrey Roberts | 33.8 | -8.6 | ||
| Labor hold | Swing | +8.6 | |||
Tangney
- This section is an excerpt from Electoral results for the Division of Tangney § 1983
| Party | Candidate | Votes | % | ±% | |
|---|---|---|---|---|---|
| Labor | George Gear | 34,899 | 49.4 | +9.1 | |
| Liberal | Peter Shack | 31,811 | 45.0 | -5.1 | |
| Democrats | Ron Murray | 2,706 | 3.8 | -5.9 | |
| Socialist Workers | Bronwen Beachey | 1,236 | 1.7 | +1.7 | |
| Total formal votes | 70,652 | 98.2 | |||
| Informal votes | 1,256 | 1.8 | |||
| Turnout | 71,917 | 94.0 | |||
| Two-party-preferred result | |||||
| Labor | George Gear | 53.2 | +7.8 | ||
| Liberal | Peter Shack | 46.8 | -7.8 | ||
| Labor gain from Liberal | Swing | +7.8 | |||
Tasmania
| ||||||||||||||||||||||||||||||||||
All 5 Tasmanian seats in the House of Representatives 3 seats needed for a majority | ||||||||||||||||||||||||||||||||||
|---|---|---|---|---|---|---|---|---|---|---|---|---|---|---|---|---|---|---|---|---|---|---|---|---|---|---|---|---|---|---|---|---|---|---|
| ||||||||||||||||||||||||||||||||||
Bass
- This section is an excerpt from Electoral results for the Division of Bass § 1983
| Party | Candidate | Votes | % | ±% | |
|---|---|---|---|---|---|
| Liberal | Kevin Newman | 28,448 | 53.5 | +0.5 | |
| Labor | John McDonald | 19,590 | 36.8 | −7.7 | |
| Democrats | Nick Goldie | 3,291 | 6.2 | +6.2 | |
| Independent | Richard Hutchison | 1,884 | 3.5 | +3.5 | |
| Total formal votes | 53,213 | 97.4 | |||
| Informal votes | 1,409 | 2.6 | |||
| Turnout | 54,622 | 95.9 | |||
| Two-party-preferred result | |||||
| Liberal | Kevin Newman | 58.3 | +4.4 | ||
| Labor | John McDonald | 41.7 | −4.4 | ||
| Liberal hold | Swing | +4.4 | |||
Braddon
- This section is an excerpt from Electoral results for the Division of Braddon § 1983
| Party | Candidate | Votes | % | ±% | |
|---|---|---|---|---|---|
| Liberal | Ray Groom | 31,143 | 61.2 | +6.1 | |
| Labor | Lance Fee | 18,016 | 35.4 | −9.5 | |
| Democrats | Greg Sargent | 1,731 | 3.4 | +3.4 | |
| Total formal votes | 50,890 | 97.9 | |||
| Informal votes | 1,110 | 2.1 | |||
| Turnout | 52,000 | 95.9 | |||
| Two-party-preferred result | |||||
| Liberal | Ray Groom | 62.6 | +7.5 | ||
| Labor | Lance Fee | 37.4 | −7.5 | ||
| Liberal hold | Swing | +7.5 | |||
Denison
- This section is an excerpt from Electoral results for the Division of Denison § 1983
| Party | Candidate | Votes | % | ±% | |
|---|---|---|---|---|---|
| Liberal | Michael Hodgman | 28,468 | 54.4 | +4.2 | |
| Labor | Kathy Smith | 21,680 | 41.5 | -4.4 | |
| Democrats | Harvey Wallace-Williams | 1,743 | 3.3 | -0.6 | |
| Socialist Workers | Leica Wagner | 406 | 0.8 | +0.8 | |
| Total formal votes | 52,297 | 97.8 | |||
| Informal votes | 1,199 | 2.2 | |||
| Turnout | 53,496 | 96.0 | |||
| Two-party-preferred result | |||||
| Liberal | Michael Hodgman | 55.8 | +3.4 | ||
| Labor | Kathy Smith | 44.2 | -3.4 | ||
| Liberal hold | Swing | +3.4 | |||
Franklin
- This section is an excerpt from Electoral results for the Division of Franklin § 1983
| Party | Candidate | Votes | % | ±% | |
|---|---|---|---|---|---|
| Liberal | Bruce Goodluck | 28,814 | 52.4 | +1.1 | |
| Labor | Fran Bladel | 24,578 | 44.7 | -0.7 | |
| Democrats | John Thomson | 1,357 | 2.5 | -0.8 | |
| Socialist Workers | David Mazengarb | 278 | 0.5 | +0.5 | |
| Total formal votes | 55,027 | 98.1 | |||
| Informal votes | 1,047 | 1.9 | |||
| Turnout | 56,074 | 96.2 | |||
| Two-party-preferred result | |||||
| Liberal | Bruce Goodluck | 53.5 | +0.8 | ||
| Labor | Fran Bladel | 46.5 | -0.8 | ||
| Liberal hold | Swing | +0.8 | |||
Wilmot
- This section is an excerpt from Electoral results for the Division of Wilmot § 1983
| Party | Candidate | Votes | % | ±% | |
|---|---|---|---|---|---|
| Liberal | Max Burr | 28,520 | 53.5 | +3.4 | |
| Labor | David Llewellyn | 22,783 | 42.7 | -7.2 | |
| Democrats | Liz Holloway | 1,336 | 2.5 | +2.5 | |
| Independent | Bill Chugg | 702 | 1.3 | +1.3 | |
| Total formal votes | 53,341 | 97.3 | |||
| Informal votes | 1,467 | 2.7 | |||
| Turnout | 54,808 | 96.2 | |||
| Two-party-preferred result | |||||
| Liberal | Max Burr | 55.1 | +5.0 | ||
| Labor | David Llewellyn | 44.9 | -5.0 | ||
| Liberal hold | Swing | +5.0 | |||
Australian Capital Territory
| ||||||||||||||||||||||||||||||||||
All 2 ACT seats in the House of Representatives 1 seats needed for a majority | ||||||||||||||||||||||||||||||||||
|---|---|---|---|---|---|---|---|---|---|---|---|---|---|---|---|---|---|---|---|---|---|---|---|---|---|---|---|---|---|---|---|---|---|---|
| ||||||||||||||||||||||||||||||||||
Canberra
- This section is an excerpt from Electoral results for the Division of Canberra § 1983
| Party | Candidate | Votes | % | ±% | |
|---|---|---|---|---|---|
| Labor | Ros Kelly | 40,434 | 62.2 | +9.8 | |
| Liberal | Gerard Brennan | 22,365 | 34.4 | −7.7 | |
| Deadly Serious | Joanne Hansen | 2,191 | 3.4 | +3.4 | |
| Total formal votes | 64,990 | 98.0 | |||
| Informal votes | 1,330 | 2.0 | |||
| Turnout | 66,320 | 96.1 | |||
| Two-party-preferred result | |||||
| Labor | Ros Kelly | 63.9 | +8.2 | ||
| Liberal | Gerard Brennan | 36.1 | −8.2 | ||
| Labor hold | Swing | +8.2 | |||
Fraser
- This section is an excerpt from Electoral results for the Division of Fraser (Australian Capital Territory) § 1983
| Party | Candidate | Votes | % | ±% | |
|---|---|---|---|---|---|
| Labor | Ken Fry | 41,755 | 65.6 | +8.3 | |
| Liberal | Liz Grant | 18,848 | 29.6 | −5.0 | |
| Deadly Serious | Rohan Greenland | 1,619 | 2.5 | +2.5 | |
| Independent | Kevin Wise | 1,419 | 2.2 | +1.2 | |
| Total formal votes | 63,641 | 97.6 | |||
| Informal votes | 1,572 | 2.4 | |||
| Turnout | 65,213 | 95.3 | |||
| Two-party-preferred result | |||||
| Labor | Ken Fry | 68.0 | +5.5 | ||
| Liberal | Liz Grant | 32.0 | −5.5 | ||
| Labor hold | Swing | +5.5 | |||
Northern Territory
| ||||||||||||||||||||||||||||||||||
Division of Northern Territory | ||||||||||||||||||||||||||||||||||
|---|---|---|---|---|---|---|---|---|---|---|---|---|---|---|---|---|---|---|---|---|---|---|---|---|---|---|---|---|---|---|---|---|---|---|
| ||||||||||||||||||||||||||||||||||
- This section is an excerpt from Electoral results for the Division of Northern Territory § 1983
| Party | Candidate | Votes | % | ±% | |
|---|---|---|---|---|---|
| Labor | John Reeves | 20,764 | 46.6 | +6.2 | |
| Country Liberal | Grant Tambling | 20,479 | 45.9 | +2.3 | |
| Democrats | Joy King | 1,571 | 3.5 | -2.3 | |
| Independent | Bill Cain | 1,132 | 2.5 | +2.5 | |
| Independent | Pamela Gardiner | 395 | 0.9 | -1.7 | |
| Independent | Strider | 252 | 0.6 | +0.6 | |
| Total formal votes | 44,593 | 95.6 | |||
| Informal votes | 2,070 | 4.4 | |||
| Turnout | 46,663 | 81.4 | |||
| Two-party-preferred result | |||||
| Labor | John Reeves | 23,132 | 51.9 | +3.1 | |
| Country Liberal | Grant Tambling | 21,461 | 48.1 | -3.1 | |
| Labor gain from Country Liberal | Swing | +3.1 | |||
See also
References
- "1983 House of Representatives". Psephos Adam Carr's Election Archive. Retrieved 29 May 2022.
- "1983 House of Representatives: NSW". Psephos Adam Carr's Election Archive. Retrieved 29 May 2022.
- "1983 House of Representatives: Victoria". Psephos Adam Carr's Election Archive. Retrieved 29 May 2022.
- "1983 House of Representatives: Queensland". Psephos Adam Carr's Election Archive. Retrieved 29 May 2022.
- "1983 House of Representatives: South Australia". Psephos Adam Carr's Election Archive. Retrieved 29 May 2022.
- "1983 House of Representatives: Western Australia". Psephos Adam Carr's Election Archive. Retrieved 29 May 2022.
- "1983 House of Representatives: Tasmania". Psephos Adam Carr's Election Archive. Retrieved 29 May 2022.
- "1983 House of Representatives: Australian Capital Territory". Psephos Adam Carr's Election Archive. Retrieved 29 May 2022.
- "1983 House of Representatives: Northern Territory". Psephos Adam Carr's Election Archive. Retrieved 29 May 2022.
| House of Representatives | |||
|---|---|---|---|
| Senate | |||
| By-elections | |||
This article is issued from Wikipedia. The text is licensed under Creative Commons - Attribution - Sharealike. Additional terms may apply for the media files.