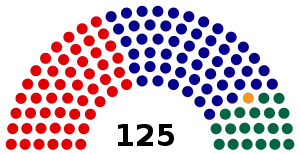
Results of the 1980 Australian federal election (House of Representatives)
This is a list of electoral division results for the Australian 1980 federal election.[1]
Overall
- This section is an excerpt from 1980 Australian federal election § House of Representatives results

| Party | Votes | % | Swing | Seats | Change | ||
|---|---|---|---|---|---|---|---|
| Liberal–NCP coalition | 3,853,585 | 46.40 | –1.71 | 74 | –12 | ||
| Liberal | 3,108,517 | 37.43 | −0.66 | 54 | −13 | ||
| National Country | 726,263 | 8.74 | −1.07 | 19 | +1 | ||
| Country Liberal | 18,805 | 0.23 | +0.02 | 1 | 0 | ||
| Labor | 3,749,565 | 45.15 | +5.50 | 51 | +13 | ||
| Democrats | 546,032 | 6.57 | −2.81 | 0 | 0 | ||
| Democratic Labor | 25,456 | 0.31 | −1.12 | 0 | 0 | ||
| Progress | 17,040 | 0.21 | −0.39 | 0 | 0 | ||
| Socialist Workers | 16,920 | 0.20 | +0.20 | 0 | 0 | ||
| Communist | 11,318 | 0.14 | −0.04 | 0 | 0 | ||
| Socialist Labour | 10,051 | 0.12 | +0.12 | 0 | 0 | ||
| NPWA | 8,915 | 0.11 | +0.11 | 0 | 0 | ||
| Progressive Conservative | 3,620 | 0.04 | +0.04 | 0 | 0 | ||
| United Christian | 2,050 | 0.02 | +0.02 | 0 | 0 | ||
| Imperial British Conservative | 1,515 | 0.02 | +0.02 | 0 | 0 | ||
| Australia | 701 | 0.01 | +0.01 | 0 | 0 | ||
| Marijuana | 486 | 0.01 | +0.01 | 0 | 0 | ||
| Independent | 58,338 | 0.70 | +0.07 | 0 | 0 | ||
| Total | 8,305,633 | 125 | +1 | ||||
| Two-party-preferred (estimated) | |||||||
| Coalition | Win | 50.40 | −4.20 | 74 | −12 | ||
| Labor | 49.60 | +4.20 | 51 | +13 | |||
New South Wales
| ||||||||||||||||||||||||||||||||||
All 43 NSW seats in the House of Representatives 22 seats needed for a majority | ||||||||||||||||||||||||||||||||||
|---|---|---|---|---|---|---|---|---|---|---|---|---|---|---|---|---|---|---|---|---|---|---|---|---|---|---|---|---|---|---|---|---|---|---|
| ||||||||||||||||||||||||||||||||||
.jpg.webp)
Banks
- This section is an excerpt from Electoral results for the Division of Banks § 1980
| Party | Candidate | Votes | % | ±% | |
|---|---|---|---|---|---|
| Labor | John Mountford | 36,842 | 53.6 | +5.0 | |
| Liberal | Donald McConnell | 25,316 | 36.8 | −0.9 | |
| Democrats | Montague Greene | 6,600 | 9.6 | −4.1 | |
| Total formal votes | 68,768 | 97.5 | −0.1 | ||
| Informal votes | 1,741 | 2.5 | +0.1 | ||
| Turnout | 70,499 | 95.9 | −0.5 | ||
| Two-party-preferred result | |||||
| Labor | John Mountford | 58.8 | +4.6 | ||
| Liberal | Donald McConnell | 41.2 | −4.6 | ||
| Labor hold | Swing | +4.6 | |||
Barton
- This section is an excerpt from Electoral results for the Division of Barton § 1980
| Party | Candidate | Votes | % | ±% | |
|---|---|---|---|---|---|
| Labor | Rodney Madgwick | 30,602 | 47.1 | +6.1 | |
| Liberal | Jim Bradfield | 30,153 | 46.4 | −2.0 | |
| Democrats | Beverley Eley | 2,464 | 3.8 | −4.7 | |
| Independent | Charles Bellchambers | 1,749 | 2.7 | +0.6 | |
| Total formal votes | 64,967 | 98.0 | |||
| Informal votes | 1,299 | 2.0 | |||
| Turnout | 66,266 | 94.9 | |||
| Two-party-preferred result | |||||
| Liberal | Jim Bradfield | 32,739 | 50.4 | −3.6 | |
| Labor | Rodney Madgwick | 32,228 | 49.6 | +3.6 | |
| Liberal hold | Swing | −3.6 | |||
Bennelong
- This section is an excerpt from Electoral results for the Division of Bennelong § 1980
| Party | Candidate | Votes | % | ±% | |
|---|---|---|---|---|---|
| Liberal | John Howard | 36,075 | 53.9 | −2.3 | |
| Labor | John Guthrie | 24,262 | 36.3 | +6.3 | |
| Democrats | Pamela Tuckwell | 4,724 | 7.1 | −5.9 | |
| Progress | James Darby | 1,856 | 2.8 | +2.0 | |
| Total formal votes | 66,917 | 98.1 | |||
| Informal votes | 1,292 | 1.9 | |||
| Turnout | 68,209 | 94.5 | |||
| Two-party-preferred result | |||||
| Liberal | John Howard | 58.4 | −5.0 | ||
| Labor | John Guthrie | 41.6 | +5.0 | ||
| Liberal hold | Swing | −5.0 | |||
Berowra
- This section is an excerpt from Electoral results for the Division of Berowra § 1980
| Party | Candidate | Votes | % | ±% | |
|---|---|---|---|---|---|
| Liberal | Harry Edwards | 39,993 | 61.4 | −1.5 | |
| Labor | George Bennett | 19,235 | 29.5 | +5.0 | |
| Democrats | James Boow | 5,939 | 9.1 | −2.4 | |
| Total formal votes | 65,167 | 98.2 | |||
| Informal votes | 1,201 | 1.8 | |||
| Turnout | 66,368 | 94.6 | |||
| Two-party-preferred result | |||||
| Liberal | Harry Edwards | 65.0 | −4.6 | ||
| Labor | George Bennett | 35.0 | +4.6 | ||
| Liberal hold | Swing | −4.6 | |||
Blaxland
- This section is an excerpt from Electoral results for the Division of Blaxland § 1980
| Party | Candidate | Votes | % | ±% | |
|---|---|---|---|---|---|
| Labor | Paul Keating | 38,493 | 59.6 | +5.4 | |
| Liberal | Salvatore Napoli | 20,024 | 31.0 | −2.0 | |
| Socialist Workers | James Doughney | 3,203 | 5.0 | +5.0 | |
| Democrats | Phillip Grattan | 2,103 | 3.3 | −3.5 | |
| Socialist Labour | Craig Marley | 802 | 1.2 | +1.2 | |
| Total formal votes | 64,625 | 96.3 | |||
| Informal votes | 2,485 | 3.7 | |||
| Turnout | 67,110 | 93.7 | |||
| Two-party-preferred result | |||||
| Labor | Paul Keating | 67.2 | +5.6 | ||
| Liberal | Salvatore Napoli | 32.8 | −5.6 | ||
| Labor hold | Swing | +5.6 | |||
Bradfield
- This section is an excerpt from Electoral results for the Division of Bradfield § 1980
| Party | Candidate | Votes | % | ±% | |
|---|---|---|---|---|---|
| Liberal | David Connolly | 51,354 | 75.1 | +2.5 | |
| Labor | Keith McKeen | 12,018 | 17.6 | +3.4 | |
| Democrats | Ilse Robey | 5,018 | 7.3 | −3.6 | |
| Total formal votes | 68,390 | 98.5 | |||
| Informal votes | 1,042 | 1.5 | |||
| Turnout | 69,432 | 94.9 | |||
| Two-party-preferred result | |||||
| Liberal | David Connolly | 78.1 | −1.6 | ||
| Labor | Keith McKeen | 21.9 | +1.6 | ||
| Liberal hold | Swing | −1.6 | |||
Calare
- This section is an excerpt from Electoral results for the Division of Calare § 1980
| Party | Candidate | Votes | % | ±% | |
|---|---|---|---|---|---|
| National Country | Sandy Mackenzie | 34,234 | 50.0 | +18.4 | |
| Labor | David Simmons | 31,645 | 46.3 | +5.8 | |
| Democrats | Ann Ritter | 2,539 | 3.7 | −3.8 | |
| Total formal votes | 68,418 | 98.6 | |||
| Informal votes | 996 | 1.4 | |||
| Turnout | 69,414 | 95.7 | |||
| Two-party-preferred result | |||||
| National Country | Sandy Mackenzie | 51.5 | −3.7 | ||
| Labor | David Simmons | 48.5 | +3.7 | ||
| National Country hold | Swing | −3.7 | |||
Chifley
- This section is an excerpt from Electoral results for the Division of Chifley § 1980
| Party | Candidate | Votes | % | ±% | |
|---|---|---|---|---|---|
| Labor | John Armitage | 46,289 | 65.2 | +5.2 | |
| Liberal | Philip Daly | 19,199 | 27.0 | −1.4 | |
| Democrats | Keith Watson | 2,539 | 3.6 | −6.2 | |
| Socialist Labour | Terence Cook | 1,918 | 2.7 | +2.7 | |
| Communist | Geoffrey Evans | 1,091 | 1.5 | −1.4 | |
| Total formal votes | 71,036 | 94.1 | |||
| Informal votes | 2,848 | 3.9 | |||
| Turnout | 73,884 | 94.7 | |||
| Two-party-preferred result | |||||
| Labor | John Armitage | 70.1 | +2.6 | ||
| Liberal | Philip Daly | 29.9 | −2.6 | ||
| Labor hold | Swing | +2.6 | |||
Cook
- This section is an excerpt from Electoral results for the Division of Cook § 1980
| Party | Candidate | Votes | % | ±% | |
|---|---|---|---|---|---|
| Liberal | Don Dobie | 36,347 | 52.1 | +0.5 | |
| Labor | Ray Thorburn | 28,422 | 40.7 | +3.8 | |
| Democrats | Alexander Kiss | 4,391 | 6.3 | −4.1 | |
| Progress | Henry Soper | 654 | 0.9 | −0.2 | |
| Total formal votes | 69,814 | 98.2 | |||
| Informal votes | 1,295 | 1.8 | |||
| Turnout | 71,109 | 95.6 | |||
| Two-party-preferred result | |||||
| Liberal | Don Dobie | 55.1 | −3.2 | ||
| Labor | Ray Thorburn | 44.9 | +3.2 | ||
| Liberal hold | Swing | −3.2 | |||
Cowper
- This section is an excerpt from Electoral results for the Division of Cowper § 1980
| Party | Candidate | Votes | % | ±% | |
|---|---|---|---|---|---|
| National Country | Ian Robinson | 39,374 | 54.5 | −9.4 | |
| Labor | Valma Melville | 29,192 | 40.4 | +4.3 | |
| Democrats | John Pierce | 3,631 | 5.0 | +5.0 | |
| Total formal votes | 72,197 | 98.6 | |||
| Informal votes | 995 | 1.4 | |||
| Turnout | 73,192 | 94.9 | |||
| Two-party-preferred result | |||||
| National Country | Ian Robinson | 56.5 | −7.4 | ||
| Labor | Valma Melville | 43.5 | +7.4 | ||
| National Country hold | Swing | −7.4 | |||
Cunningham
- This section is an excerpt from Electoral results for the Division of Cunningham § 1980
| Party | Candidate | Votes | % | ±% | |
|---|---|---|---|---|---|
| Labor | Stewart West | 40,042 | 55.9 | +2.4 | |
| Liberal | Thomas Griffin | 21,818 | 30.5 | −0.8 | |
| Democrats | Megan Sampson | 5,185 | 7.2 | −3.6 | |
| Communist | Peter Cockcroft | 2,585 | 3.6 | +2.0 | |
| Socialist Workers | Andrew Jamieson | 1,197 | 1.7 | +1.7 | |
| Socialist Labour | Richard Moore | 810 | 1.1 | +1.1 | |
| Total formal votes | 71,637 | 96.7 | |||
| Informal votes | 2,476 | 3.3 | |||
| Turnout | 74,113 | 95.1 | |||
| Two-party-preferred result | |||||
| Labor | Stewart West | 65.1 | +4.4 | ||
| Liberal | Thomas Griffin | 34.9 | −4.4 | ||
| Labor hold | Swing | +4.4 | |||
Dundas
- This section is an excerpt from Electoral results for the Division of Dundas § 1980
| Party | Candidate | Votes | % | ±% | |
|---|---|---|---|---|---|
| Liberal | Philip Ruddock | 35,836 | 53.2 | -0.6 | |
| Labor | Margery Hourihan | 25,407 | 37.7 | +3.8 | |
| Democrats | Stephen Bastian | 4,922 | 7.3 | -2.3 | |
| Progress | Archibald Brown | 1,243 | 1.8 | -0.9 | |
| Total formal votes | 67,408 | 97.8 | |||
| Informal votes | 1,499 | 2.2 | |||
| Turnout | 68,907 | 94.5 | |||
| Two-party-preferred result | |||||
| Liberal | Philip Ruddock | 58.4 | -1.7 | ||
| Labor | Margery Hourihan | 41.6 | +1.7 | ||
| Liberal hold | Swing | -1.7 | |||
Eden-Monaro
- This section is an excerpt from Electoral results for the Division of Eden-Monaro § 1980
| Party | Candidate | Votes | % | ±% | |
|---|---|---|---|---|---|
| Liberal | Murray Sainsbury | 34,897 | 49.8 | -1.9 | |
| Labor | Jim Snow | 31,588 | 45.1 | +6.2 | |
| Democrats | Norma Helmers | 3,586 | 5.1 | -3.5 | |
| Total formal votes | 70,071 | 98.7 | |||
| Informal votes | 906 | 1.3 | |||
| Turnout | 70,977 | 95.2 | |||
| Two-party-preferred result | |||||
| Liberal | Murray Sainsbury | 36,987 | 52.8 | -3.1 | |
| Labor | Jim Snow | 33,084 | 47.2 | +3.1 | |
| Liberal hold | Swing | -3.1 | |||
Farrer
- This section is an excerpt from Electoral results for the Division of Farrer § 1980
| Party | Candidate | Votes | % | ±% | |
|---|---|---|---|---|---|
| Liberal | Wal Fife | 39,670 | 58.4 | -3.5 | |
| Labor | Lloyd Elliott | 22,856 | 33.6 | +3.7 | |
| Democrats | Rodney Dominish | 4,613 | 6.8 | +0.7 | |
| Progress | Maureen Nathan | 808 | 1.2 | +0.2 | |
| Total formal votes | 67,947 | 98.4 | |||
| Informal votes | 1,100 | 1.6 | |||
| Turnout | 69,047 | 95.0 | |||
| Two-party-preferred result | |||||
| Liberal | Wal Fife | 61.8 | -4.6 | ||
| Labor | Lloyd Elliott | 38.2 | +4.6 | ||
| Liberal hold | Swing | -4.6 | |||
Grayndler
- This section is an excerpt from Electoral results for the Division of Grayndler § 1980
| Party | Candidate | Votes | % | ±% | |
|---|---|---|---|---|---|
| Labor | Leo McLeay | 34,029 | 57.5 | -0.2 | |
| Liberal | George Dryden | 20,538 | 34.7 | +1.3 | |
| Democrats | Albert Jarman | 1,894 | 3.2 | -4.0 | |
| Socialist | Justin Walsh | 1,405 | 2.4 | +0.7 | |
| Socialist Labour | Derek Mortimer | 1,273 | 2.2 | +2.2 | |
| Total formal votes | 59,139 | 95.9 | |||
| Informal votes | 2,513 | 4.1 | |||
| Turnout | 61,652 | 92.6 | |||
| Two-party-preferred result | |||||
| Labor | Leo McLeay | 63.5 | +1.3 | ||
| Liberal | Keith Tartak | 36.5 | -1.3 | ||
| Labor hold | Swing | +1.3 | |||
Gwydir
- This section is an excerpt from Electoral results for the Division of Gwydir § 1980
| Party | Candidate | Votes | % | ±% | |
|---|---|---|---|---|---|
| National Country | Ralph Hunt | 38,796 | 58.4 | -0.6 | |
| Labor | Robert Hamilton | 23,589 | 35.5 | +2.8 | |
| Democrats | Gloria Collison | 4,004 | 6.0 | +1.5 | |
| Total formal votes | 66,389 | 98.5 | |||
| Informal votes | 1,041 | 1.5 | |||
| Turnout | 67,430 | 94.3 | |||
| Two-party-preferred result | |||||
| National Country | Ralph Hunt | 60.4 | -2.9 | ||
| Labor | Robert Hamilton | 39.6 | +2.9 | ||
| National Country hold | Swing | -2.9 | |||
Hughes
- This section is an excerpt from Electoral results for the Division of Hughes § 1980
| Party | Candidate | Votes | % | ±% | |
|---|---|---|---|---|---|
| Labor | Les Johnson | 40,470 | 57.0 | +5.3 | |
| Liberal | Chris Downy | 23,951 | 33.7 | +0.6 | |
| Democrats | Questa Gill | 5,867 | 8.3 | -6.9 | |
| Progress | Marjorie Wisby | 687 | 1.0 | +1.0 | |
| Total formal votes | 70,975 | 97.9 | |||
| Informal votes | 1,517 | 2.1 | |||
| Turnout | 72,492 | 95.8 | |||
| Two-party-preferred result | |||||
| Labor | Les Johnson | 62.1 | +2.8 | ||
| Liberal | Chris Downy | 37.9 | -2.8 | ||
| Labor hold | Swing | +2.8 | |||
Hume
- This section is an excerpt from Electoral results for the Division of Hume § 1980
| Party | Candidate | Votes | % | ±% | |
|---|---|---|---|---|---|
| National Country | Stephen Lusher | 37,013 | 56.0 | −1.0 | |
| Labor | Sue West | 27,614 | 41.8 | +3.4 | |
| Democrats | Gwendoline Wilson | 1,478 | 2.2 | −2.3 | |
| Total formal votes | 66,105 | 98.8 | |||
| Informal votes | 832 | 1.2 | |||
| Turnout | 66,937 | 95.3 | |||
| Two-party-preferred result | |||||
| National Country | Stephen Lusher | 56.9 | −2.4 | ||
| Labor | Sue West | 43.1 | +2.4 | ||
| National Country hold | Swing | −2.4 | |||
Hunter
- This section is an excerpt from Electoral results for the Division of Hunter § 1980
| Party | Candidate | Votes | % | ±% | |
|---|---|---|---|---|---|
| Labor | Bob Brown | 51,061 | 67.9 | +7.2 | |
| Liberal | Ashley Saunders | 19,896 | 26.5 | -1.3 | |
| Democrats | Edwina Wilson | 4,227 | 5.6 | -5.9 | |
| Total formal votes | 75,184 | 98.1 | |||
| Informal votes | 1,454 | 1.9 | |||
| Turnout | 76,638 | 95.7 | |||
| Two-party-preferred result | |||||
| Labor | Bob Brown | 71.3 | +4.8 | ||
| Liberal | Ashley Saunders | 28.7 | -4.8 | ||
| Labor hold | Swing | +4.8 | |||
Kingsford Smith
- This section is an excerpt from Electoral results for the Division of Kingsford Smith § 1980
| Party | Candidate | Votes | % | ±% | |
|---|---|---|---|---|---|
| Labor | Lionel Bowen | 44,083 | 69.5 | +5.1 | |
| Liberal | Collin O'Neill | 17,148 | 27.0 | -2.6 | |
| Democrats | Oliver Nekula | 2,167 | 3.4 | -2.7 | |
| Total formal votes | 63,398 | 96.6 | |||
| Informal votes | 2,262 | 3.4 | |||
| Turnout | 65,660 | 92.6 | |||
| Two-party-preferred result | |||||
| Labor | Lionel Bowen | 71.5 | +4.0 | ||
| Liberal | Collin O'Neill | 28.5 | -4.0 | ||
| Labor hold | Swing | +4.0 | |||
Lowe
- This section is an excerpt from Electoral results for the Division of Lowe § 1980
| Party | Candidate | Votes | % | ±% | |
|---|---|---|---|---|---|
| Liberal | Sir William McMahon | 31,892 | 48.7 | -4.1 | |
| Labor | Jan Burnswoods | 30,379 | 46.4 | +7.2 | |
| Democrats | Bradley Mulligan | 1,987 | 3.0 | -2.7 | |
| Independent | Anthony Reasha | 1,167 | 1.8 | +1.8 | |
| Total formal votes | 65,425 | 97.1 | |||
| Informal votes | 1,957 | 2.9 | |||
| Turnout | 67,382 | 92.7 | |||
| Two-party-preferred result | |||||
| Liberal | Sir William McMahon | 33,416 | 51.1 | -5.2 | |
| Labor | Jan Burnswoods | 32,009 | 48.9 | +5.2 | |
| Liberal hold | Swing | -5.2 | |||
Lyne
- This section is an excerpt from Electoral results for the Division of Lyne § 1980
| Party | Candidate | Votes | % | ±% | |
|---|---|---|---|---|---|
| Labor | Leslie Brown | 27,714 | 37.7 | +3.7 | |
| National Country | Bruce Cowan | 23,413 | 31.8 | −24.0 | |
| Liberal | Milton Morris | 20,636 | 28.1 | +28.1 | |
| Democrats | Edwin Poppleton | 1,792 | 2.4 | −7.8 | |
| Total formal votes | 73,555 | 98.6 | |||
| Informal votes | 1,021 | 1.4 | |||
| Turnout | 74,576 | 96.1 | |||
| Two-party-preferred result | |||||
| National Country | Bruce Cowan | 43,350 | 58.9 | −2.5 | |
| Labor | Leslie Brown | 30,205 | 41.1 | +2.5 | |
| National Country hold | Swing | −2.5 | |||
Macarthur
- This section is an excerpt from Electoral results for the Division of Macarthur § 1980
| Party | Candidate | Votes | % | ±% | |
|---|---|---|---|---|---|
| Liberal | Michael Baume | 37,786 | 51.2 | +2.8 | |
| Labor | Jim Groves | 32,417 | 44.0 | -0.6 | |
| Democrats | Warren Steele | 3,081 | 4.2 | -1.9 | |
| Independent | Ronald Sarina | 470 | 0.6 | +0.6 | |
| Total formal votes | 73,754 | 98.2 | |||
| Informal votes | 1,317 | 1.8 | |||
| Turnout | 75,071 | 94.9 | |||
| Two-party-preferred result | |||||
| Liberal | Michael Baume | 53.2 | +1.3 | ||
| Labor | Jim Groves | 46.8 | -1.3 | ||
| Liberal hold | Swing | +1.3 | |||
Mackellar
- This section is an excerpt from Electoral results for the Division of Mackellar § 1980
| Party | Candidate | Votes | % | ±% | |
|---|---|---|---|---|---|
| Liberal | Jim Carlton | 38,922 | 60.2 | +4.8 | |
| Labor | Kevin Mason | 20,513 | 31.7 | +3.5 | |
| Democrats | Robert Williams | 5,222 | 8.1 | -3.1 | |
| Total formal votes | 64,657 | 97.3 | |||
| Informal votes | 1,785 | 2.7 | |||
| Turnout | 66,442 | 93.5 | |||
| Two-party-preferred result | |||||
| Liberal | Jim Carlton | 63.5 | -0.8 | ||
| Labor | Kevin Mason | 36.5 | +0.8 | ||
| Liberal hold | Swing | -0.8 | |||
Macquarie
- This section is an excerpt from Electoral results for the Division of Macquarie § 1980
| Party | Candidate | Votes | % | ±% | |
|---|---|---|---|---|---|
| Labor | Ross Free | 36,814 | 46.7 | +7.3 | |
| Liberal | Reg Gillard | 34,699 | 44.0 | +2.2 | |
| Democrats | Richard Jackson-Hope | 4,603 | 5.8 | -5.0 | |
| Independent | Raymond Butcher | 1,958 | 2.5 | +2.5 | |
| Independent | Ronald Stanton | 447 | 0.6 | +0.6 | |
| Independent | Ian Perry | 377 | 0.5 | +0.5 | |
| Total formal votes | 78,898 | 97.3 | |||
| Informal votes | 2,194 | 2.7 | |||
| Turnout | 81,092 | 94.5 | |||
| Two-party-preferred result | |||||
| Labor | Ross Free | 41,687 | 52.8 | +4.5 | |
| Liberal | Reg Gillard | 37,211 | 47.2 | -4.5 | |
| Labor gain from Liberal | Swing | +4.5 | |||
Mitchell
- This section is an excerpt from Electoral results for the Division of Mitchell § 1980
| Party | Candidate | Votes | % | ±% | |
|---|---|---|---|---|---|
| Liberal | Alan Cadman | 48,860 | 63.2 | +2.8 | |
| Labor | Patrick McArdle | 23,703 | 30.7 | +3.6 | |
| Democrats | Rosemary Mason | 4,744 | 6.1 | -3.1 | |
| Total formal votes | 77,307 | 98.0 | |||
| Informal votes | 1,603 | 2.0 | |||
| Turnout | 78,910 | 94.6 | |||
| Two-party-preferred result | |||||
| Liberal | Alan Cadman | 65.6 | -1.6 | ||
| Labor | Patrick McArdle | 34.4 | +1.6 | ||
| Liberal hold | Swing | -1.6 | |||
New England
- This section is an excerpt from Electoral results for the Division of New England § 1980
| Party | Candidate | Votes | % | ±% | |
|---|---|---|---|---|---|
| National Country | Ian Sinclair | 34,454 | 52.7 | -6.6 | |
| Labor | Selby Dean | 24,808 | 37.9 | +6.5 | |
| Democrats | Fiona Richardson | 6,124 | 9.4 | +0.1 | |
| Total formal votes | 65,386 | 98.4 | |||
| Informal votes | 1,050 | 1.6 | |||
| Turnout | 66,436 | 95.2 | |||
| Two-party-preferred result | |||||
| National Country | Ian Sinclair | 56.5 | -7.5 | ||
| Labor | Selby Dean | 43.5 | +7.5 | ||
| National Country hold | Swing | -7.5 | |||
Newcastle
- This section is an excerpt from Electoral results for the Division of Newcastle1980
| Party | Candidate | Votes | % | ±% | |
|---|---|---|---|---|---|
| Labor | Charles Jones | 38,321 | 58.0 | +0.7 | |
| Liberal | Richard Bevan | 22,823 | 34.5 | +1.1 | |
| Democrats | John Cleverly | 2,132 | 3.2 | -2.1 | |
| Communist | Darrell Dawson | 1,629 | 2.5 | -1.6 | |
| Socialist Workers | Geoffrey Payne | 1,204 | 1.8 | +1.8 | |
| Total formal votes | 66,109 | 97.8 | |||
| Informal votes | 1,504 | 2.2 | |||
| Turnout | 67,613 | 94.9 | |||
| Two-party-preferred result | |||||
| Labor | Charles Jones | 63.8 | +0.1 | ||
| Liberal | Richard Bevan | 36.2 | -0.1 | ||
| Labor hold | Swing | +0.1 | |||
North Sydney
- This section is an excerpt from Electoral results for the Division of North Sydney § 1980
| Party | Candidate | Votes | % | ±% | |
|---|---|---|---|---|---|
| Liberal | John Spender | 37,016 | 60.0 | +1.4 | |
| Labor | Maxine Broughton | 19,223 | 31.2 | +5.0 | |
| Democrats | Anita Stiller | 3,573 | 5.8 | -5.2 | |
| Progress | Peter Corrie | 1,131 | 1.8 | -0.8 | |
| Independent | Josephine Chisholm-Mallett | 737 | 1.2 | +1.2 | |
| Total formal votes | 61,680 | 97.8 | |||
| Informal votes | 1,410 | 2.2 | |||
| Turnout | 63,090 | 90.0 | |||
| Two-party-preferred result | |||||
| Liberal | John Spender | 64.5 | -2.8 | ||
| Labor | Maxine Broughton | 35.5 | +2.8 | ||
| Liberal hold | Swing | -2.8 | |||
Parramatta
- This section is an excerpt from Electoral results for the Division of Parramatta § 1980
| Party | Candidate | Votes | % | ±% | |
|---|---|---|---|---|---|
| Labor | John Brown | 35,810 | 54.0 | +2.0 | |
| Liberal | Lance Shaw | 23,058 | 34.8 | -5.0 | |
| Democrats | Warwick Barber | 6,191 | 9.3 | +1.1 | |
| Independent | Jim Saleam | 1,248 | 1.9 | +1.9 | |
| Total formal votes | 66,307 | 96.5 | |||
| Informal votes | 2,410 | 3.5 | |||
| Turnout | 68,717 | 94.2 | |||
| Two-party-preferred result | |||||
| Labor | John Brown | 60.2 | +4.1 | ||
| Liberal | Lance Shaw | 39.8 | -4.1 | ||
| Labor hold | Swing | +4.1 | |||
Paterson
- This section is an excerpt from Electoral results for the Division of Paterson § 1980
| Party | Candidate | Votes | % | ±% | |
|---|---|---|---|---|---|
| National Country | Frank O'Keefe | 36,416 | 55.1 | -2.5 | |
| Labor | Francis Murray | 24,946 | 37.7 | +3.4 | |
| Democrats | Denis Driver | 4,265 | 6.4 | -0.3 | |
| Independent | William Reeve-Parker | 516 | 0.8 | +0.8 | |
| Total formal votes | 66,143 | 98.3 | |||
| Informal votes | 1,124 | 1.7 | |||
| Turnout | 67,267 | 95.3 | |||
| Two-party-preferred result | |||||
| National Country | Frank O'Keefe | 57.7 | -4.5 | ||
| Labor | Francis Murray | 42.3 | +4.5 | ||
| National Country hold | Swing | -4.5 | |||
Phillip
- This section is an excerpt from Electoral results for the Division of Phillip § 1980
| Party | Candidate | Votes | % | ±% | |
|---|---|---|---|---|---|
| Liberal | Jack Birney | 29,541 | 48.7 | +0.7 | |
| Labor | Jeannette McHugh | 27,904 | 46.0 | +2.0 | |
| Democrats | Leslie Reiss | 2,781 | 4.6 | -2.5 | |
| Independent | Russell Deiley | 474 | 0.8 | +0.8 | |
| Total formal votes | 60,700 | 97.5 | |||
| Informal votes | 1,579 | 2.5 | |||
| Turnout | 62,279 | 89.9 | |||
| Two-party-preferred result | |||||
| Liberal | Jack Birney | 30,744 | 50.6 | -1.4 | |
| Labor | Jeannette McHugh | 29,956 | 49.4 | +1.4 | |
| Liberal hold | Swing | -1.4 | |||
Prospect
- This section is an excerpt from Electoral results for the Division of Prospect § 1980
| Party | Candidate | Votes | % | ±% | |
|---|---|---|---|---|---|
| Labor | Dick Klugman | 39,419 | 57.9 | +3.3 | |
| Liberal | Alan Byers | 24,967 | 36.6 | +3.3 | |
| Democrats | Robert Goodere | 3,751 | 5.5 | -6.1 | |
| Total formal votes | 68,137 | 95.5 | |||
| Informal votes | 3,227 | 4.5 | |||
| Turnout | 71,364 | 93.3 | |||
| Two-party-preferred result | |||||
| Labor | Dick Klugman | 61.2 | +1.3 | ||
| Liberal | Alan Byers | 38.8 | -1.3 | ||
| Labor hold | Swing | +1.3 | |||
Reid
- This section is an excerpt from Electoral results for the Division of Reid § 1980
| Party | Candidate | Votes | % | ±% | |
|---|---|---|---|---|---|
| Labor | Tom Uren | 38,675 | 61.6 | +3.1 | |
| Liberal | Yvonne Maio | 18,885 | 30.1 | -2.0 | |
| Independent | Neville Gray | 3,664 | 5.8 | +5.8 | |
| Democrats | Paul Terrett | 1,548 | 2.5 | -6.9 | |
| Total formal votes | 62,772 | 96.5 | |||
| Informal votes | 2,300 | 3.5 | |||
| Turnout | 65,072 | 94.0 | |||
| Two-party-preferred result | |||||
| Labor | Tom Uren | 65.5 | +2.8 | ||
| Liberal | Yvonne Maio | 34.5 | -2.8 | ||
| Labor hold | Swing | +2.8 | |||
Richmond
- This section is an excerpt from Electoral results for the Division of Richmond § 1980
| Party | Candidate | Votes | % | ±% | |
|---|---|---|---|---|---|
| National Country | Doug Anthony | 42,037 | 56.9 | -4.5 | |
| Labor | Terence McGee | 26,574 | 36.0 | +4.2 | |
| Democrats | Ashley Albanese | 5,216 | 7.1 | +1.7 | |
| Total formal votes | 73,827 | 98.8 | |||
| Informal votes | 906 | 1.2 | |||
| Turnout | 74,733 | 94.6 | |||
| Two-party-preferred result | |||||
| National Country | Doug Anthony | 60.3 | -4.5 | ||
| Labor | Terence McGee | 39.7 | +4.5 | ||
| National Country hold | Swing | -4.5 | |||
Riverina
- This section is an excerpt from Electoral results for the Division of Riverina § 1980
| Party | Candidate | Votes | % | ±% | |
|---|---|---|---|---|---|
| Labor | Frederick Smith | 30,698 | 46.9 | -1.9 | |
| National Country | Noel Hicks | 21,663 | 33.1 | -15.6 | |
| Liberal | Brian Thornton | 11,072 | 16.9 | +16.9 | |
| Democrats | John Newman | 1,414 | 2.2 | +2.2 | |
| Independent | Frederick Martin | 549 | 0.8 | +0.8 | |
| Total formal votes | 65,396 | 97.6 | |||
| Informal votes | 1,628 | 2.4 | |||
| Turnout | 67,024 | 93.2 | |||
| Two-party-preferred result | |||||
| National Country | Noel Hicks | 33,055 | 50.5 | +0.6 | |
| Labor | Frederick Smith | 32,345 | 49.5 | -0.6 | |
| National Country gain from Labor | Swing | +0.6 | |||
Robertson
- This section is an excerpt from Electoral results for the Division of Robertson § 1980
| Party | Candidate | Votes | % | ±% | |
|---|---|---|---|---|---|
| Labor | Barry Cohen | 41,569 | 52.4 | +5.7 | |
| Liberal | Brian Gill | 30,390 | 38.3 | -4.8 | |
| Democrats | Trevor Willsher | 4,629 | 5.8 | -4.4 | |
| Independent | Paul Baker | 2,696 | 3.4 | +3.4 | |
| Total formal votes | 79,284 | 98.1 | |||
| Informal votes | 1,501 | 1.9 | |||
| Turnout | 80,785 | 94.9 | |||
| Two-party-preferred result | |||||
| Labor | Barry Cohen | 58.1 | +5.8 | ||
| Liberal | Brian Gill | 41.9 | -5.8 | ||
| Labor hold | Swing | +5.8 | |||
Shortland
- This section is an excerpt from Electoral results for the Division of Shortland § 1980
| Party | Candidate | Votes | % | ±% | |
|---|---|---|---|---|---|
| Labor | Peter Morris | 45,509 | 61.0 | +6.5 | |
| Liberal | Eddie Namir | 20,611 | 27.6 | -7.6 | |
| Democrats | Lionel Lambkin | 5,111 | 6.8 | -3.5 | |
| Socialist Labour | Robert Buhler | 3,422 | 4.6 | +4.6 | |
| Total formal votes | 74,653 | 98.0 | |||
| Informal votes | 1,497 | 2.0 | |||
| Turnout | 76,150 | 96.0 | |||
| Two-party-preferred result | |||||
| Labor | Peter Morris | 69.3 | +9.6 | ||
| Liberal | Eddie Namir | 30.7 | -9.6 | ||
| Labor hold | Swing | +9.6 | |||
St George
- This section is an excerpt from Electoral results for the Division of St George § 1980
| Party | Candidate | Votes | % | ±% | |
|---|---|---|---|---|---|
| Labor | Bill Morrison | 34,855 | 53.4 | +8.3 | |
| Liberal | Maurice Neil | 27,946 | 42.8 | -5.1 | |
| Democrats | Beverley Davis | 2,509 | 3.8 | -2.5 | |
| Total formal votes | 65,310 | 97.5 | |||
| Informal votes | 1,680 | 2.5 | |||
| Turnout | 66,990 | 94.8 | |||
| Two-party-preferred result | |||||
| Labor | Bill Morrison | 56.1 | +8.1 | ||
| Liberal | Maurice Neil | 43.9 | -8.1 | ||
| Labor gain from Liberal | Swing | +8.1 | |||
Sydney
- This section is an excerpt from Electoral results for the Division of Sydney § 1980
| Party | Candidate | Votes | % | ±% | |
|---|---|---|---|---|---|
| Labor | Les McMahon | 36,720 | 62.0 | -1.2 | |
| Liberal | Cliff Reece | 13,364 | 22.6 | -0.1 | |
| Democrats | Maxwell Adams | 4,816 | 8.1 | +2.6 | |
| Communist | Judy Mundey | 2,850 | 4.8 | -1.5 | |
| Socialist Workers | Juanita Keig | 1,477 | 2.5 | +2.5 | |
| Total formal votes | 59,227 | 95.9 | |||
| Informal votes | 2,545 | 4.1 | |||
| Turnout | 61,772 | 88.6 | |||
| Two-party-preferred result | |||||
| Labor | Les McMahon | 73.8 | +0.4 | ||
| Liberal | Cliff Reece | 26.2 | -0.4 | ||
| Labor hold | Swing | +0.4 | |||
Warringah
- This section is an excerpt from Electoral results for the Division of Warringah § 1980
| Party | Candidate | Votes | % | ±% | |
|---|---|---|---|---|---|
| Liberal | Michael MacKellar | 39,270 | 62.5 | −0.4 | |
| Labor | Desmond Murphy | 17,864 | 28.4 | +3.7 | |
| Democrats | Arthur Bishop | 3,944 | 6.3 | −3.5 | |
| Prog. Conservative | John McGrath | 1,297 | 2.1 | +2.1 | |
| Progress | David Rennie | 490 | 0.8 | −1.8 | |
| Total formal votes | 62,865 | 98.5 | |||
| Informal votes | 1,593 | 2.5 | |||
| Turnout | 64,458 | 93.6 | |||
| Two-party-preferred result | |||||
| Liberal | Michael MacKellar | 67.4 | −2.8 | ||
| Labor | Desmond Murphy | 32.6 | 2.8 | ||
| Liberal hold | Swing | −2.8 | |||
Wentworth
- This section is an excerpt from Electoral results for the Division of Wentworth § 1980
| Party | Candidate | Votes | % | ±% | |
|---|---|---|---|---|---|
| Liberal | Bob Ellicott | 36,426 | 60.5 | +3.0 | |
| Labor | Stephen McGoldrick | 20,086 | 33.3 | +1.9 | |
| Democrats | Joan Kersey | 3,746 | 6.2 | -1.9 | |
| Total formal votes | 60,258 | 97.5 | |||
| Informal votes | 1,540 | 2.5 | |||
| Turnout | 61,798 | 88.5 | |||
| Two-party-preferred result | |||||
| Liberal | Bob Ellicott | 63.0 | -1.4 | ||
| Labor | Stephen McGoldrick | 37.0 | +1.4 | ||
| Liberal hold | Swing | -1.4 | |||
Werriwa
- This section is an excerpt from Electoral results for the Division of Werriwa § 1980
| Party | Candidate | Votes | % | ±% | |
|---|---|---|---|---|---|
| Labor | John Kerin | 45,296 | 57.9 | +2.4 | |
| Liberal | Marie Rutledge | 23,813 | 30.4 | −3.5 | |
| Democrats | Keith Olson | 5,074 | 6.5 | −2.5 | |
| Independent | Edward Bell | 4,079 | 5.2 | +5.2 | |
| Total formal votes | 78,262 | 96.8 | |||
| Informal votes | 2,577 | 3.2 | |||
| Turnout | 80,839 | 95.0 | |||
| Two-party-preferred result | |||||
| Labor | John Kerin | 66.6 | +6.4 | ||
| Liberal | Marie Rutledge | 33.4 | −6.4 | ||
| Labor hold | Swing | +6.4 | |||
Victoria
| ||||||||||||||||||||||||||||||||||
All 33 Victorian seats in the House of Representatives 17 seats needed for a majority | ||||||||||||||||||||||||||||||||||
|---|---|---|---|---|---|---|---|---|---|---|---|---|---|---|---|---|---|---|---|---|---|---|---|---|---|---|---|---|---|---|---|---|---|---|
| ||||||||||||||||||||||||||||||||||
Balaclava
- This section is an excerpt from Electoral results for the Division of Balaclava § 1980
| Party | Candidate | Votes | % | ±% | |
|---|---|---|---|---|---|
| Liberal | Ian Macphee | 32,729 | 51.6 | +1.0 | |
| Labor | Chris Kennedy | 22,933 | 36.2 | +7.2 | |
| Democrats | Zelma Furey | 7,743 | 12.2 | −3.2 | |
| Total formal votes | 63,405 | 97.8 | |||
| Informal votes | 1,444 | 2.2 | |||
| Turnout | 64,849 | 93.8 | |||
| Two-party-preferred result | |||||
| Liberal | Ian Macphee | 56.1 | −7.2 | ||
| Labor | Chris Kennedy | 43.9 | +7.2 | ||
| Liberal hold | Swing | −7.2 | |||
Ballaarat
- This section is an excerpt from Electoral results for the Division of Ballarat § 1980
| Party | Candidate | Votes | % | ±% | |
|---|---|---|---|---|---|
| Liberal | Jim Short | 30,551 | 46.0 | −2.0 | |
| Labor | John Mildren | 29,990 | 45.2 | +8.2 | |
| Democrats | Graham Gough | 3,736 | 5.6 | −4.3 | |
| Democratic Labor | John Cotter | 2,099 | 3.2 | −1.8 | |
| Total formal votes | 66,376 | 98.9 | |||
| Informal votes | 1,239 | 1.8 | |||
| Turnout | 67,615 | 96.7 | |||
| Two-party-preferred result | |||||
| Labor | John Mildren | 33,623 | 50.7 | +8.2 | |
| Liberal | Jim Short | 32,753 | 49.3 | −8.2 | |
| Labor gain from Liberal | Swing | +8.2 | |||
Batman
- This section is an excerpt from Electoral results for the Division of Batman § 1980
| Party | Candidate | Votes | % | ±% | |
|---|---|---|---|---|---|
| Labor | Brian Howe | 37,065 | 55.5 | +8.2 | |
| Liberal | Rosemary Kemp | 20,785 | 31.1 | −6.3 | |
| Democratic Labor | Allen Doyle | 4,945 | 7.4 | +2.1 | |
| Democrats | Jeffrey McAlpine | 4,002 | 6.0 | −4.0 | |
| Total formal votes | 66,797 | 97.1 | |||
| Informal votes | 2,004 | 2.9 | |||
| Turnout | 68,801 | 94.3 | |||
| Two-party-preferred result | |||||
| Labor | Brian Howe | 60.7 | +7.3 | ||
| Liberal | Rosemary Kemp | 39.3 | −7.3 | ||
| Labor hold | Swing | +7.3 | |||
Bendigo
- This section is an excerpt from Electoral results for the Division of Bendigo § 1980
| Party | Candidate | Votes | % | ±% | |
|---|---|---|---|---|---|
| Liberal | John Bourchier | 31,468 | 47.3 | −0.7 | |
| Labor | Victor Dolby | 29,257 | 44.0 | +9.5 | |
| Democrats | George Hunter | 5,828 | 8.8 | −3.8 | |
| Total formal votes | 66,553 | 98.6 | |||
| Informal votes | 919 | 1.4 | |||
| Turnout | 67,472 | 96.1 | |||
| Two-party-preferred result | |||||
| Liberal | John Bourchier | 34,122 | 51.3 | −6.9 | |
| Labor | Victor Dolby | 32,431 | 48.7 | +6.9 | |
| Liberal hold | Swing | −6.9 | |||
Bruce
- This section is an excerpt from Electoral results for the Division of Bruce § 1980
| Party | Candidate | Votes | % | ±% | |
|---|---|---|---|---|---|
| Liberal | Sir Billy Snedden | 34,982 | 48.8 | −1.6 | |
| Labor | Gayle Whyte | 27,457 | 38.3 | +7.2 | |
| Democrats | Fraser Hercus | 7,942 | 11.1 | −4.1 | |
| Democratic Labor | Elaine Mulholland | 954 | 1.3 | −2.0 | |
| Independent | Wilhelm Kapphan | 366 | 0.5 | +0.5 | |
| Total formal votes | 71,701 | 97.6 | |||
| Informal votes | 1,737 | 2.4 | |||
| Turnout | 73,438 | 96.7 | |||
| Two-party-preferred result | |||||
| Liberal | Sir Billy Snedden | 39,724 | 55.4 | −5.6 | |
| Labor | Gayle Whyte | 31,977 | 44.6 | +5.6 | |
| Liberal hold | Swing | −5.6 | |||
Burke
- This section is an excerpt from Electoral results for the Division of Burke (1969–2004) § 1980
| Party | Candidate | Votes | % | ±% | |
|---|---|---|---|---|---|
| Labor | Andrew Theophanous | 37,984 | 54.1 | +3.7 | |
| Liberal | Greg Ross | 26,803 | 38.2 | +5.9 | |
| Democrats | Eric Spencer | 5,413 | 7.7 | −3.4 | |
| Total formal votes | 70,200 | 96.8 | |||
| Informal votes | 2,357 | 3.2 | |||
| Turnout | 72,557 | 95.0 | |||
| Two-party-preferred result | |||||
| Labor | Andrew Theophanous | 58.8 | +2.2 | ||
| Liberal | Greg Ross | 41.2 | −2.2 | ||
| Labor hold | Swing | +2.2 | |||
Casey
- This section is an excerpt from Electoral results for the Division of Casey § 1980
| Party | Candidate | Votes | % | ±% | |
|---|---|---|---|---|---|
| Liberal | Peter Falconer | 31,107 | 45.4 | −2.9 | |
| Labor | Peter Watson | 26,841 | 39.2 | +8.9 | |
| Democrats | Basil Smith | 7,032 | 10.3 | −6.4 | |
| Independent | Bertram Wainer | 2,720 | 4.0 | +4.0 | |
| United Christian | Martin Hetherich | 563 | 0.8 | +0.8 | |
| Independent | Wilfrid Thiele | 193 | 0.3 | +0.3 | |
| Total formal votes | 68,456 | 97.7 | |||
| Informal votes | 1,638 | 2.3 | |||
| Turnout | 70,094 | 95.5 | |||
| Two-party-preferred result | |||||
| Liberal | Peter Falconer | 35,527 | 51.9 | −8.3 | |
| Labor | Peter Watson | 32,929 | 48.1 | +8.3 | |
| Liberal hold | Swing | −8.3 | |||
Chisholm
- This section is an excerpt from Electoral results for the Division of Chisholm § 1980
| Party | Candidate | Votes | % | ±% | |
|---|---|---|---|---|---|
| Liberal | Graham Harris | 32,211 | 47.1 | +0.6 | |
| Labor | Helen Mayer | 28,058 | 41.1 | +9.6 | |
| Democrats | Alan Swindon | 7,377 | 10.8 | −6.4 | |
| Australia | Terence Pooley | 701 | 1.0 | +1.0 | |
| Total formal votes | 68,347 | 98.0 | |||
| Informal votes | 1,394 | 2.0 | |||
| Turnout | 69,741 | 95.3 | |||
| Two-party-preferred result | |||||
| Liberal | Graham Harris | 35,652 | 52.2 | −6.7 | |
| Labor | Helen Mayer | 32,695 | 47.8 | +6.7 | |
| Liberal hold | Swing | −6.7 | |||
Corangamite
- This section is an excerpt from Electoral results for the Division of Corangamite § 1980
| Party | Candidate | Votes | % | ±% | |
|---|---|---|---|---|---|
| Liberal | Tony Street | 37,913 | 56.6 | −1.9 | |
| Labor | Neil Gedge | 20,959 | 31.3 | +4.9 | |
| Democrats | Kathleen May | 5,031 | 7.5 | −2.4 | |
| Democratic Labor | Bernie Finn | 3,043 | 4.5 | +0.2 | |
| Total formal votes | 66,946 | 98.3 | |||
| Informal votes | 1,164 | 1.7 | |||
| Turnout | 68,110 | 96.4 | |||
| Two-party-preferred result | |||||
| Liberal | Tony Street | 62.8 | −5.0 | ||
| Labor | Neil Gedge | 37.2 | +5.0 | ||
| Liberal hold | Swing | −5.0 | |||
Corio
- This section is an excerpt from Electoral results for the Division of Corio § 1980
| Party | Candidate | Votes | % | ±% | |
|---|---|---|---|---|---|
| Labor | Gordon Scholes | 39,138 | 56.6 | +8.2 | |
| Liberal | Mieczyslaw Parks | 24,051 | 34.8 | −5.5 | |
| Democrats | Reginald Sweeten | 3,418 | 4.9 | −2.4 | |
| Democratic Labor | James Jordan | 2,528 | 3.7 | −0.4 | |
| Total formal votes | 69,135 | 97.5 | |||
| Informal votes | 1,781 | 2.5 | |||
| Turnout | 70,916 | 95.0 | |||
| Two-party-preferred result | |||||
| Labor | Gordon Scholes | 59.8 | +6.9 | ||
| Liberal | Mieczyslaw Parks | 40.2 | −6.9 | ||
| Labor hold | Swing | +6.9 | |||
Deakin
- This section is an excerpt from Electoral results for the Division of Deakin § 1980
| Party | Candidate | Votes | % | ±% | |
|---|---|---|---|---|---|
| Liberal | Alan Jarman | 33,011 | 43.7 | -2.4 | |
| Labor | John Madden | 31,277 | 41.4 | +9.0 | |
| Democrats | Edwin Adamson | 9,014 | 11.9 | -4.4 | |
| Democratic Labor | Peter Ferwerda | 2,291 | 3.0 | -2.2 | |
| Total formal votes | 75,593 | 98.1 | |||
| Informal votes | 1,469 | 1.9 | |||
| Turnout | 77,062 | 96.3 | |||
| Two-party-preferred result | |||||
| Liberal | Alan Jarman | 39,561 | 52.3 | -5.1 | |
| Labor | John Madden | 36,032 | 47.7 | +5.1 | |
| Liberal hold | Swing | -5.1 | |||
Diamond Valley
- This section is an excerpt from Electoral results for the Division of Diamond Valley § 1980
| Party | Candidate | Votes | % | ±% | |
|---|---|---|---|---|---|
| Liberal | Neil Brown | 35,082 | 48.6 | +0.1 | |
| Labor | John Scomparin | 29,186 | 40.4 | +9.2 | |
| Democrats | Geoffrey Loftus-Hills | 7,936 | 11.0 | -5.2 | |
| Total formal votes | 72,204 | 98.0 | |||
| Informal votes | 1,438 | 2.0 | |||
| Turnout | 73,642 | 96.3 | |||
| Two-party-preferred result | |||||
| Liberal | Neil Brown | 38,750 | 53.7 | -6.6 | |
| Labor | John Scomparin | 33,454 | 46.3 | +6.6 | |
| Liberal hold | Swing | -6.6 | |||
Flinders
- This section is an excerpt from Electoral results for the Division of Flinders § 1980
| Party | Candidate | Votes | % | ±% | |
|---|---|---|---|---|---|
| Liberal | Phillip Lynch | 36,587 | 50.3 | -0.2 | |
| Labor | Jean McLean | 28,565 | 39.2 | +9.4 | |
| Democrats | William Towers | 7,643 | 10.5 | -5.0 | |
| Total formal votes | 72,795 | 98.1 | |||
| Informal votes | 1,433 | 1.9 | |||
| Turnout | 74,228 | 95.1 | |||
| Two-party-preferred result | |||||
| Liberal | Phillip Lynch | 54.6 | -6.1 | ||
| Labor | Jean McLean | 45.4 | +6.1 | ||
| Liberal hold | Swing | -6.1 | |||
Gellibrand
- This section is an excerpt from Electoral results for the Division of Gellibrand § 1980
| Party | Candidate | Votes | % | ±% | |
|---|---|---|---|---|---|
| Labor | Ralph Willis | 43,474 | 65.5 | +7.2 | |
| Liberal | John Kelly | 14,711 | 22.2 | −0.9 | |
| Democrats | Shirley Bold | 5,955 | 9.0 | +0.4 | |
| Socialist Workers | Lynne Bryer | 2,268 | 3.4 | +3.4 | |
| Total formal votes | 66,408 | 94.4 | |||
| Informal votes | 3,184 | 4.6 | |||
| Turnout | 69,592 | 95.0 | |||
| Two-party-preferred result | |||||
| Labor | Ralph Willis | 73.4 | +8.9 | ||
| Liberal | John Kelly | 26.6 | −8.9 | ||
| Labor hold | Swing | +8.9 | |||
Gippsland
- This section is an excerpt from Electoral results for the Division of Gippsland § 1980
| Party | Candidate | Votes | % | ±% | |
|---|---|---|---|---|---|
| National Country | Peter Nixon | 37,180 | 56.7 | -1.3 | |
| Labor | Graeme McIntyre | 19,791 | 30.2 | +6.5 | |
| Democrats | Pierre Forcier | 6,861 | 10.5 | +0.1 | |
| Independent | Bruce Ingle | 1,684 | 2.6 | +2.6 | |
| Total formal votes | 65,516 | 97.9 | |||
| Informal votes | 1,385 | 2.1 | |||
| Turnout | 66,901 | 95.1 | |||
| Two-party-preferred result | |||||
| National Country | Peter Nixon | 61.9 | -2.6 | ||
| Labor | Graeme McIntyre | 38.1 | +2.6 | ||
| National Country hold | Swing | -2.6 | |||
Henty
- This section is an excerpt from Electoral results for the Division of Henty § 1980
| Party | Candidate | Votes | % | ±% | |
|---|---|---|---|---|---|
| Labor | Joan Child | 32,102 | 49.1 | +7.6 | |
| Liberal | Ken Aldred | 27,702 | 42.3 | -2.7 | |
| Democrats | Jonathan Melland | 3,926 | 6.0 | -3.9 | |
| Democratic Labor | John Mulholland | 1,698 | 2.6 | -0.5 | |
| Total formal votes | 65,428 | 97.8 | |||
| Informal votes | 1,441 | 2.2 | |||
| Turnout | 66,869 | 95.2 | |||
| Two-party-preferred result | |||||
| Labor | Joan Child | 34,541 | 52.8 | +5.5 | |
| Liberal | Ken Aldred | 30,887 | 47.2 | -5.5 | |
| Labor gain from Liberal | Swing | +5.5 | |||
Higgins
- This section is an excerpt from Electoral results for the Division of Higgins § 1980
| Party | Candidate | Votes | % | ±% | |
|---|---|---|---|---|---|
| Liberal | Roger Shipton | 37,292 | 57.0 | +1.8 | |
| Labor | Jennifer Bundy | 22,512 | 34.4 | +8.2 | |
| Democrats | James Thornley | 4,554 | 7.0 | −5.5 | |
| Imperial British | Maureen Holmes | 636 | 1.0 | +1.0 | |
| Independent | Wilhelm Kapphan | 437 | 0.7 | +0.7 | |
| Total formal votes | 65,431 | 97.9 | |||
| Informal votes | 1,412 | 2.1 | |||
| Turnout | 66,843 | 93.4 | |||
| Two-party-preferred result | |||||
| Liberal | Roger Shipton | 60.7 | −5.3 | ||
| Labor | Jennifer Bundy | 39.3 | +5.3 | ||
| Liberal hold | Swing | −5.3 | |||
Holt
- This section is an excerpt from Electoral results for the Division of Holt § 1980
| Party | Candidate | Votes | % | ±% | |
|---|---|---|---|---|---|
| Labor | Michael Duffy | 39,232 | 52.1 | +11.9 | |
| Liberal | William Yates | 28,940 | 38.4 | -4.6 | |
| Democrats | Brian Stockton | 5,810 | 7.7 | -5.1 | |
| Democratic Labor | Michael Rowe | 1,352 | 1.8 | -2.3 | |
| Total formal votes | 75,334 | 97.2 | |||
| Informal votes | 2,191 | 2.8 | |||
| Turnout | 77,525 | 95.5 | |||
| Two-party-preferred result | |||||
| Labor | Michael Duffy | 56.9 | +8.7 | ||
| Liberal | William Yates | 43.1 | -8.7 | ||
| Labor gain from Liberal | Swing | +8.7 | |||
Hotham
- This section is an excerpt from Electoral results for the Division of Hotham § 1980
| Party | Candidate | Votes | % | ±% | |
|---|---|---|---|---|---|
| Labor | Lewis Kent | 35,201 | 48.5 | +10.4 | |
| Liberal | Roger Johnston | 28,054 | 38.7 | −1.7 | |
| Democrats | Robyn Groves | 8,138 | 11.2 | −7.2 | |
| Democratic Labor | Edward Woods | 1,128 | 1.6 | −1.5 | |
| Total formal votes | 72,521 | 97.0 | |||
| Informal votes | 2,250 | 3.0 | |||
| Turnout | 74,771 | 95.9 | |||
| Two-party-preferred result | |||||
| Labor | Lewis Kent | 39,177 | 54.0 | +5.7 | |
| Liberal | Roger Johnston | 33,344 | 46.0 | −5.7 | |
| Labor gain from Liberal | Swing | +5.7 | |||
Indi
- This section is an excerpt from Electoral results for the Division of Indi § 1980
| Party | Candidate | Votes | % | ±% | |
|---|---|---|---|---|---|
| Liberal | Ewen Cameron | 26,745 | 41.8 | +15.6 | |
| Labor | Carole Marple | 21,190 | 33.1 | +7.9 | |
| National Country | Allan Garrett | 12,486 | 19.5 | −16.4 | |
| Democrats | Ralph Fleming | 2,695 | 4.2 | −2.9 | |
| Independent | Patrick Flanagan | 581 | 0.9 | +0.9 | |
| Independent | Brian Lumsden | 334 | 0.5 | +0.5 | |
| Total formal votes | 64,031 | 97.0 | |||
| Informal votes | 1,972 | 3.0 | |||
| Turnout | 66,003 | 95.9 | |||
| Two-party-preferred result | |||||
| Liberal | Ewen Cameron | 39,947 | 62.4 | +7.3 | |
| Labor | Carole Marple | 24,084 | 37.6 | +37.6 | |
| Liberal hold | Swing | +7.3 | |||
Isaacs
- This section is an excerpt from Electoral results for the Division of Isaacs § 1980
| Party | Candidate | Votes | % | ±% | |
|---|---|---|---|---|---|
| Labor | David Charles | 31,192 | 45.1 | +10.5 | |
| Liberal | Bill Burns | 26,293 | 38.0 | −6.4 | |
| Democrats | Michael Bakos | 9,777 | 14.1 | −2.9 | |
| Independent | Sydney Balhorn | 1,955 | 2.8 | +2.8 | |
| Total formal votes | 69,217 | 97.8 | |||
| Informal votes | 1,534 | 2.2 | |||
| Turnout | 70,751 | 95.4 | |||
| Two-party-preferred result | |||||
| Labor | David Charles | 35,856 | 51.8 | +9.1 | |
| Liberal | Bill Burns | 33,361 | 48.2 | −9.1 | |
| Labor gain from Liberal | Swing | +9.1 | |||
Kooyong
- This section is an excerpt from Electoral results for the Division of Kooyong § 1980
| Party | Candidate | Votes | % | ±% | |
|---|---|---|---|---|---|
| Liberal | Andrew Peacock | 38,013 | 57.6 | +2.0 | |
| Labor | Wesley Blackmore | 22,356 | 33.9 | +8.2 | |
| Democrats | James Lysaght | 5,630 | 8.5 | −3.9 | |
| Total formal votes | 65,999 | 98.2 | |||
| Informal votes | 1,181 | 1.8 | |||
| Turnout | 67,180 | 93.6 | |||
| Two-party-preferred result | |||||
| Liberal | Andrew Peacock | 61.1 | −6.6 | ||
| Labor | Wesley Blackmore | 38.9 | +6.6 | ||
| Liberal hold | Swing | −6.6 | |||
La Trobe
- This section is an excerpt from Electoral results for the Division of La Trobe § 1980
| Party | Candidate | Votes | % | ±% | |
|---|---|---|---|---|---|
| Labor | Peter Milton | 31,439 | 45.2 | +4.9 | |
| Liberal | Marshall Baillieu | 28,282 | 40.7 | −0.9 | |
| Democrats | James Leicester | 7,201 | 10.4 | −3.7 | |
| United Christian | Cornelis Hellema | 1,487 | 2.1 | +2.1 | |
| Democratic Labor | Desmond Burke | 867 | 1.2 | −1.1 | |
| Independent | Wilhelm Kapphan | 262 | 0.4 | +0.4 | |
| Total formal votes | 69,538 | 97.2 | |||
| Informal votes | 2,015 | 2.8 | |||
| Turnout | 71,553 | 95.4 | |||
| Two-party-preferred result | |||||
| Labor | Peter Milton | 36,360 | 52.3 | +3.1 | |
| Liberal | Marshall Baillieu | 33,178 | 47.7 | −3.1 | |
| Labor gain from Liberal | Swing | +3.1 | |||
Lalor
- This section is an excerpt from Electoral results for the Division of Lalor § 1980
| Party | Candidate | Votes | % | ±% | |
|---|---|---|---|---|---|
| Labor | Barry Jones | 50,509 | 68.3 | +17.8 | |
| Liberal | Thomas Meskos | 18,944 | 25.6 | −2.5 | |
| Democrats | Ivan Pollock | 4,446 | 6.0 | −3.9 | |
| Total formal votes | 73,899 | 96.0 | |||
| Informal votes | 3,103 | 4.0 | |||
| Turnout | 77,002 | 95.6 | |||
| Two-party-preferred result | |||||
| Labor | Barry Jones | 71.9 | +14.3 | ||
| Liberal | Thomas Meskos | 28.1 | −14.3 | ||
| Labor hold | Swing | +14.3 | |||
Mallee
- This section is an excerpt from Electoral results for the Division of Mallee § 1980
| Party | Candidate | Votes | % | ±% | |
|---|---|---|---|---|---|
| National Country | Peter Fisher | 29,502 | 47.2 | −1.1 | |
| Labor | Geoffrey Ferns | 14,967 | 23.9 | +2.1 | |
| Liberal | Neville Goodwin | 13,393 | 21.4 | −2.4 | |
| Democrats | Colin Kavanagh | 2,736 | 4.4 | +4.4 | |
| Independent | Leslie Connolly | 1,592 | 2.5 | +2.5 | |
| Independent | Ronald Nicholson | 362 | 0.6 | +0.6 | |
| Total formal votes | 62,552 | 96.5 | |||
| Informal votes | 2,254 | 3.5 | |||
| Turnout | 64,806 | 95.6 | |||
| Two-party-preferred result | |||||
| National Country | Peter Fisher | 44,303 | 70.8 | −2.5 | |
| Labor | Geoffrey Ferns | 18,249 | 29.2 | +2.5 | |
| National Country hold | Swing | −2.5 | |||
Maribyrnong
- This section is an excerpt from Electoral results for the Division of Maribyrnong § 1980
| Party | Candidate | Votes | % | ±% | |
|---|---|---|---|---|---|
| Labor | Moss Cass | 37,991 | 54.6 | +11.0 | |
| Liberal | Geoffrey Ireland | 24,439 | 35.1 | -1.6 | |
| Democrats | Henrik Jersic | 7,129 | 10.2 | -3.3 | |
| Total formal votes | 69,559 | 97.4 | |||
| Informal votes | 1,880 | 2.6 | |||
| Turnout | 71,439 | 96.2 | |||
| Two-party-preferred result | |||||
| Labor | Moss Cass | 60.7 | +8.7 | ||
| Liberal | Geoffrey Ireland | 39.3 | -8.7 | ||
| Labor hold | Swing | +8.7 | |||
McMillan
- This section is an excerpt from Electoral results for the Division of McMillan § 1980
| Party | Candidate | Votes | % | ±% | |
|---|---|---|---|---|---|
| Liberal | Barry Simon | 28,957 | 44.2 | -0.3 | |
| Labor | Barry Cunningham | 28,100 | 42.9 | +7.5 | |
| Democrats | Sandra Burke | 4,748 | 7.3 | -6.9 | |
| Democratic Labor | Brian Handley | 3,295 | 5.0 | +0.2 | |
| Independent | Robert McCracken | 378 | 0.6 | +0.6 | |
| Total formal votes | 65,478 | 97.3 | |||
| Informal votes | 1,803 | 2.7 | |||
| Turnout | 67,281 | 95.7 | |||
| Two-party-preferred result | |||||
| Labor | Barry Cunningham | 33,647 | 51.4 | +6.2 | |
| Liberal | Barry Simon | 31,831 | 48.6 | -6.2 | |
| Labor gain from Liberal | Swing | +6.2 | |||
Melbourne
- This section is an excerpt from Electoral results for the Division of Melbourne § 1980
| Party | Candidate | Votes | % | ±% | |
|---|---|---|---|---|---|
| Labor | Ted Innes | 35,812 | 60.7 | +6.6 | |
| Liberal | Robert Fallshaw | 16,573 | 28.1 | +4.5 | |
| Democrats | Alan Hughes | 4,199 | 7.1 | -1.8 | |
| Communist | Max Ogden | 1,534 | 2.6 | +0.1 | |
| Imperial British | James Ferrari | 879 | 1.5 | +1.5 | |
| Total formal votes | 58,997 | 95.7 | |||
| Informal votes | 2,677 | 4.3 | |||
| Turnout | 61,674 | 90.1 | |||
| Two-party-preferred result | |||||
| Labor | Ted Innes | 68.1 | +6.3 | ||
| Liberal | Robert Fallshaw | 31.9 | -6.3 | ||
| Labor hold | Swing | +6.3 | |||
Melbourne Ports
- This section is an excerpt from Electoral results for the Division of Melbourne Ports § 1980
| Party | Candidate | Votes | % | ±% | |
|---|---|---|---|---|---|
| Labor | Clyde Holding | 33,992 | 57.0 | +7.0 | |
| Liberal | Colin Bell | 20,252 | 33.9 | +0.9 | |
| Democrats | Stephen Duthy | 4,336 | 7.3 | -2.5 | |
| Independent | Gordon Moffatt | 806 | 1.4 | +1.4 | |
| Independent | Wilhelm Kapphan | 270 | 0.5 | +0.5 | |
| Total formal votes | 59,656 | 96.2 | |||
| Informal votes | 2,373 | 3.8 | |||
| Turnout | 62,029 | 89.5 | |||
| Two-party-preferred result | |||||
| Labor | Clyde Holding | 62.3 | +6.8 | ||
| Liberal | Colin Bell | 37.7 | -6.8 | ||
| Labor hold | Swing | +6.8 | |||
Murray
- This section is an excerpt from Electoral results for the Division of Murray § 1980
| Party | Candidate | Votes | % | ±% | |
|---|---|---|---|---|---|
| National Country | Bruce Lloyd | 30,338 | 46.2 | -6.6 | |
| Labor | Joan Groves | 15,679 | 23.9 | +6.9 | |
| Liberal | Bill Hunter | 14,616 | 22.3 | +7.4 | |
| Democrats | Douglas Linford | 3,856 | 5.9 | -4.7 | |
| Independent | Diane Teasdale | 1,171 | 1.8 | +1.8 | |
| Total formal votes | 65,660 | 97.0 | |||
| Informal votes | 2,009 | 3.0 | |||
| Turnout | 67,669 | 96.5 | |||
| Two-party-preferred result | |||||
| National Country | Bruce Lloyd | 44,323 | 67.5 | +1.3 | |
| Labor | Joan Groves | 21,337 | 32.5 | -1.3 | |
| National Country hold | Swing | +1.3 | |||
Scullin
- This section is an excerpt from Electoral results for the Division of Scullin § 1980
| Party | Candidate | Votes | % | ±% | |
|---|---|---|---|---|---|
| Labor | Harry Jenkins | 46,883 | 67.1 | +15.3 | |
| Liberal | Geoffrey Lutz | 18,892 | 27.0 | -6.5 | |
| Democrats | Brian Kidd | 4,068 | 5.8 | -3.6 | |
| Total formal votes | 69,843 | 96.8 | |||
| Informal votes | 2,304 | 3.2 | |||
| Turnout | 72,147 | 95.4 | |||
| Two-party-preferred result | |||||
| Labor | Harry Jenkins | 70.6 | +13.6 | ||
| Liberal | Geoffrey Lutz | 29.4 | -13.6 | ||
| Labor hold | Swing | +13.6 | |||
Wannon
- This section is an excerpt from Electoral results for the Division of Wannon § 1980
| Party | Candidate | Votes | % | ±% | |
|---|---|---|---|---|---|
| Liberal | Malcolm Fraser | 37,680 | 58.4 | +1.7 | |
| Labor | Keith Wilson | 22,670 | 35.1 | +4.1 | |
| Democrats | Bernhard Kruger | 2,625 | 4.1 | -1.7 | |
| Independent | Joseph Young | 1,546 | 2.4 | -6.9 | |
| Total formal votes | 64,521 | 98.3 | |||
| Informal votes | 1,089 | 1.7 | |||
| Turnout | 65,610 | 96.5 | |||
| Two-party-preferred result | |||||
| Liberal | Malcolm Fraser | 61.2 | -4.4 | ||
| Labor | Keith Wilson | 38.8 | +4.4 | ||
| Liberal hold | Swing | -4.4 | |||
Wills
- This section is an excerpt from Electoral results for the Division of Wills § 1980
| Party | Candidate | Votes | % | ±% | |
|---|---|---|---|---|---|
| Labor | Bob Hawke | 42,815 | 65.1 | +7.5 | |
| Liberal | Vincenzo d'Aquino | 17,337 | 26.4 | +0.0 | |
| Democrats | Kenneth Goss | 2,407 | 3.7 | -4.8 | |
| Democratic Labor | Thomas Stewart | 1,256 | 1.9 | -5.5 | |
| Socialist Workers | Solomon Salby | 677 | 1.0 | +1.0 | |
| Socialist Labour | Michael Head | 490 | 0.7 | +0.7 | |
| Independent | Martin Newell | 410 | 0.6 | +0.6 | |
| Communist | Philip Herington | 368 | 0.6 | +0.6 | |
| Total formal votes | 65,760 | 94.5 | |||
| Informal votes | 3,846 | 5.5 | |||
| Turnout | 69,606 | 94.3 | |||
| Two-party-preferred result | |||||
| Labor | Bob Hawke | 69.9 | +7.3 | ||
| Liberal | Vincenzo d'Aquino | 30.1 | -7.3 | ||
| Labor hold | Swing | +7.3 | |||
Queensland
| ||||||||||||||||||||||||||||||||||
All 19 Queensland seats in the House of Representatives 10 seats needed for a majority | ||||||||||||||||||||||||||||||||||
|---|---|---|---|---|---|---|---|---|---|---|---|---|---|---|---|---|---|---|---|---|---|---|---|---|---|---|---|---|---|---|---|---|---|---|
| ||||||||||||||||||||||||||||||||||
Bowman
- This section is an excerpt from Electoral results for the Division of Bowman § 1980
| Party | Candidate | Votes | % | ±% | |
|---|---|---|---|---|---|
| Liberal | David Jull | 33,695 | 48.8 | −1.2 | |
| Labor | Len Keogh | 31,722 | 45.9 | +6.2 | |
| Democrats | Thomas Martin | 3,648 | 5.3 | −3.3 | |
| Total formal votes | 69,065 | 98.6 | |||
| Informal votes | 978 | 1.4 | |||
| Turnout | 70,043 | 94.5 | |||
| Two-party-preferred result | |||||
| Liberal | David Jull | 35,351 | 51.2 | −5.1 | |
| Labor | Len Keogh | 33,714 | 48.8 | +5.1 | |
| Liberal hold | Swing | −5.1 | |||
Brisbane
- This section is an excerpt from Electoral results for the Division of Brisbane § 1980
| Party | Candidate | Votes | % | ±% | |
|---|---|---|---|---|---|
| Labor | Manfred Cross | 29,621 | 48.1 | +6.8 | |
| Liberal | Peter Johnson | 27,497 | 44.7 | −2.4 | |
| Democrats | Anthony Walters | 3,664 | 6.0 | −4.0 | |
| Independent | William Kenney | 788 | 1.3 | +1.3 | |
| Total formal votes | 61,570 | 98.1 | |||
| Informal votes | 1,180 | 1.9 | |||
| Turnout | 62,750 | 94.5 | |||
| Two-party-preferred result | |||||
| Labor | Manfred Cross | 31,881 | 51.8 | +5.0 | |
| Liberal | Peter Johnson | 29,689 | 48.2 | −5.0 | |
| Labor gain from Liberal | Swing | +5.0 | |||
Capricornia
- This section is an excerpt from Electoral results for the Division of Capricornia § 1980
| Party | Candidate | Votes | % | ±% | |
|---|---|---|---|---|---|
| Labor | Doug Everingham | 32,688 | 50.9 | +2.0 | |
| National Country | Colin Carige | 21,292 | 33.2 | −8.1 | |
| Liberal | William Park | 7,781 | 12.1 | +6.2 | |
| Democrats | Lloyd Webber | 2,177 | 3.4 | −0.2 | |
| Progress | Paul Rackemann | 225 | 0.4 | +0.1 | |
| Total formal votes | 64,162 | 98.7 | |||
| Informal votes | 855 | 1.3 | |||
| Turnout | 65,017 | 95.9 | |||
| Two-party-preferred result | |||||
| Labor | Doug Everingham | 54.3 | +3.1 | ||
| National Country | Colin Carige | 45.7 | −3.1 | ||
| Labor hold | Swing | +3.1 | |||
Darling Downs
- This section is an excerpt from Electoral results for the Division of Darling Downs § 1980
| Party | Candidate | Votes | % | ±% | |
|---|---|---|---|---|---|
| National Country | Tom McVeigh | 41,011 | 63.3 | -4.8 | |
| Labor | Janet Hunt | 19,379 | 29.9 | +0.3 | |
| Democrats | Maria Hayboer | 3,551 | 5.5 | +5.5 | |
| Progress | David Proud | 870 | 1.3 | -1.1 | |
| Total formal votes | 64,811 | 98.7 | |||
| Informal votes | 850 | 1.3 | |||
| Turnout | 65,661 | 94.8 | |||
| Two-party-preferred result | |||||
| National Country | Tom McVeigh | 65.8 | -4.5 | ||
| Labor | Janet Hunt | 34.2 | +4.5 | ||
| National Country hold | Swing | -4.5 | |||
Dawson
- This section is an excerpt from Electoral results for the Division of Dawson § 1980
| Party | Candidate | Votes | % | ±% | |
|---|---|---|---|---|---|
| National Country | Ray Braithwaite | 33,205 | 50.1 | -5.8 | |
| Labor | Barbara Hill | 29,960 | 45.2 | +3.3 | |
| Democrats | Brian Caldwell | 2,299 | 3.5 | +3.5 | |
| Independent | Robert Oakes | 539 | 0.8 | +0.8 | |
| Progress | Kelly Crombie | 330 | 0.5 | -1.7 | |
| Total formal votes | 66,333 | 98.4 | |||
| Informal votes | 1,080 | 1.6 | |||
| Turnout | 67,413 | 93.8 | |||
| Two-party-preferred result | |||||
| National Country | Ray Braithwaite | 52.2 | -5.7 | ||
| Labor | Barbara Hill | 47.8 | +5.7 | ||
| National Country hold | Swing | -5.7 | |||
Fadden
- This section is an excerpt from Electoral results for the Division of Fadden § 1980
| Party | Candidate | Votes | % | ±% | |
|---|---|---|---|---|---|
| Liberal | Don Cameron | 37,170 | 48.0 | +14.4 | |
| Labor | David Beddall | 33,736 | 43.6 | +5.2 | |
| Democrats | Janice Barber | 5,812 | 7.5 | -1.4 | |
| Progress | Dallas Graham | 648 | 0.8 | +0.5 | |
| Total formal votes | 77,366 | 98.1 | |||
| Informal votes | 1,506 | 1.9 | |||
| Turnout | 78,872 | 94.0 | |||
| Two-party-preferred result | |||||
| Liberal | Don Cameron | 39,808 | 51.5 | -4.5 | |
| Labor | David Beddall | 37,558 | 48.5 | +4.5 | |
| Liberal hold | Swing | -4.5 | |||
Fisher
- This section is an excerpt from Electoral results for the Division of Fisher § 1980
| Party | Candidate | Votes | % | ±% | |
|---|---|---|---|---|---|
| National Country | Evan Adermann | 41,167 | 53.3 | -6.3 | |
| Labor | Fay Price | 26,865 | 34.8 | +5.7 | |
| Democrats | Gavin Black | 6,250 | 8.1 | -1.7 | |
| Independent | Gail Perry | 2,134 | 2.8 | +2.8 | |
| Progress | Rodney Jeanneret | 848 | 1.1 | -0.5 | |
| Total formal votes | 77,264 | 97.9 | |||
| Informal votes | 1,653 | 2.1 | |||
| Turnout | 78,917 | 94.8 | |||
| Two-party-preferred result | |||||
| National Country | Evan Adermann | 58.9 | -7.0 | ||
| Labor | Fay Price | 41.1 | +7.0 | ||
| National Country hold | Swing | -7.0 | |||
Griffith
- This section is an excerpt from Electoral results for the Division of Griffith § 1980
| Party | Candidate | Votes | % | ±% | |
|---|---|---|---|---|---|
| Labor | Ben Humphreys | 32,249 | 55.8 | +8.8 | |
| Liberal | Dennis Young | 16,019 | 27.7 | -5.8 | |
| National Country | Noel Willersdorf | 4,732 | 8.2 | -1.5 | |
| Democrats | Gillian Newman | 2,474 | 4.3 | -3.6 | |
| Socialist Workers | Mark Carey | 2,293 | 4.0 | +4.0 | |
| Total formal votes | 57,767 | 97.1 | |||
| Informal votes | 1,707 | 2.9 | |||
| Turnout | 59,474 | 91.9 | |||
| Two-party-preferred result | |||||
| Labor | Ben Humphreys | 62.9 | +9.4 | ||
| Liberal | Dennis Young | 37.1 | -9.4 | ||
| Labor hold | Swing | +9.4 | |||
Herbert
- This section is an excerpt from Electoral results for the Division of Herbert § 1980
| Party | Candidate | Votes | % | ±% | |
|---|---|---|---|---|---|
| Liberal | Gordon Dean | 31,538 | 47.9 | +14.4 | |
| Labor | Ted Lindsay | 30,575 | 46.5 | +9.5 | |
| Democrats | John Lamb | 3,690 | 5.6 | -2.2 | |
| Total formal votes | 65,803 | 98.5 | |||
| Informal votes | 978 | 1.5 | |||
| Turnout | 66,781 | 93.3 | |||
| Two-party-preferred result | |||||
| Liberal | Gordon Dean | 33,462 | 50.9 | -6.8 | |
| Labor | Ted Lindsay | 32,341 | 49.1 | +6.8 | |
| Liberal hold | Swing | -6.8 | |||
Kennedy
- This section is an excerpt from Electoral results for the Division of Kennedy § 1980
| Party | Candidate | Votes | % | ±% | |
|---|---|---|---|---|---|
| National Country | Bob Katter, Sr. | 33,744 | 60.2 | -1.2 | |
| Labor | Susan Hadlow | 20,194 | 36.0 | +3.3 | |
| Progress | James Fryar | 2,103 | 3.8 | +2.0 | |
| Total formal votes | 56,041 | 98.2 | |||
| Informal votes | 1,021 | 1.8 | |||
| Turnout | 57,062 | 92.4 | |||
| Two-party-preferred result | |||||
| National Country | Bob Katter, Sr. | 62.7 | -1.5 | ||
| Labor | Susan Hadlow | 37.3 | +1.5 | ||
| National Country hold | Swing | -1.5 | |||
Leichhardt
- This section is an excerpt from Electoral results for the Division of Leichhardt § 1980
| Party | Candidate | Votes | % | ±% | |
|---|---|---|---|---|---|
| National Country | David Thomson | 30,105 | 48.9 | +1.6 | |
| Labor | Anthony Mijo | 28,500 | 46.3 | +0.0 | |
| Democrats | Ian Paul | 2,985 | 4.8 | -1.7 | |
| Total formal votes | 61,590 | 97.9 | |||
| Informal votes | 1,308 | 2.1 | |||
| Turnout | 62,898 | 92.3 | |||
| Two-party-preferred result | |||||
| National Country | David Thomson | 31,459 | 51.1 | +0.2 | |
| Labor | Anthony Mijo | 30,131 | 48.9 | -0.2 | |
| National Country hold | Swing | +0.2 | |||
Lilley
- This section is an excerpt from Electoral results for the Division of Lilley § 1980
| Party | Candidate | Votes | % | ±% | |
|---|---|---|---|---|---|
| Labor | Elaine Darling | 29,434 | 48.0 | +8.8 | |
| Liberal | Kevin Cairns | 28,964 | 47.2 | -1.4 | |
| Democrats | Joan Hadley | 2,920 | 4.8 | -3.6 | |
| Total formal votes | 61,318 | 98.4 | |||
| Informal votes | 977 | 1.6 | |||
| Turnout | 62,295 | 94.0 | |||
| Two-party-preferred result | |||||
| Labor | Elaine Darling | 31,126 | 50.8 | +6.8 | |
| Liberal | Kevin Cairns | 30,192 | 49.2 | -6.8 | |
| Labor gain from Liberal | Swing | +6.8 | |||
Maranoa
- This section is an excerpt from Electoral results for the Division of Maranoa § 1980
| Party | Candidate | Votes | % | ±% | |
|---|---|---|---|---|---|
| National Country | Ian Cameron | 35,035 | 57.3 | -11.4 | |
| Labor | Kenneth Abbey | 18,047 | 29.5 | +5.8 | |
| Liberal | Reginald Kerslake | 5,655 | 9.2 | +9.2 | |
| Democrats | Austin Brannigan | 2,412 | 3.9 | +0.6 | |
| Total formal votes | 61,149 | 98.5 | |||
| Informal votes | 902 | 1.5 | |||
| Turnout | 62,051 | 94.5 | |||
| Two-party-preferred result | |||||
| National Country | Ian Cameron | 67.1 | -6.5 | ||
| Labor | Kenneth Abbey | 32.9 | +6.5 | ||
| National Country hold | Swing | -6.5 | |||
McPherson
- This section is an excerpt from Electoral results for the Division of McPherson § 1980
| Party | Candidate | Votes | % | ±% | |
|---|---|---|---|---|---|
| Liberal | Eric Robinson | 32,459 | 43.3 | -16.8 | |
| Labor | Walter Ehrich | 23,061 | 30.8 | +3.2 | |
| Independent | Louis Rowan | 14,350 | 19.1 | +19.1 | |
| Democrats | Ian Crick | 3,761 | 5.0 | -4.2 | |
| Independent | William Aabraham-Steer | 1,339 | 1.8 | +0.3 | |
| Total formal votes | 74,970 | 97.7 | |||
| Informal votes | 1,778 | 2.3 | |||
| Turnout | 76,748 | 92.7 | |||
| Two-party-preferred result | |||||
| Liberal | Eric Robinson | 40,170 | 53.6 | -12.7 | |
| Labor | Walter Ehrich | 34,800 | 46.4 | +12.7 | |
| Liberal hold | Swing | -12.7 | |||
Moreton
- This section is an excerpt from Electoral results for the Division of Moreton § 1980
| Party | Candidate | Votes | % | ±% | |
|---|---|---|---|---|---|
| Liberal | James Killen | 31,157 | 50.7 | -5.3 | |
| Labor | Barbara Robson | 25,997 | 42.3 | +8.2 | |
| Democrats | Betty Whitworth | 2,877 | 4.7 | -2.3 | |
| Independent | Graham Bell | 1,064 | 1.7 | +0.2 | |
| Progress | Patrick Dixon | 407 | 0.7 | -0.7 | |
| Total formal votes | 61,502 | 98.1 | |||
| Informal votes | 1,221 | 1.9 | |||
| Turnout | 62,723 | 94.7 | |||
| Two-party-preferred result | |||||
| Liberal | James Killen | 54.6 | -7.4 | ||
| Labor | Barbara Robson | 45.4 | +7.4 | ||
| Liberal hold | Swing | -7.4 | |||
Oxley
- This section is an excerpt from Electoral results for the Division of Oxley § 1980
| Party | Candidate | Votes | % | ±% | |
|---|---|---|---|---|---|
| Labor | Bill Hayden | 45,094 | 64.1 | +9.1 | |
| Liberal | Ronda Herrmann | 20,461 | 29.1 | -7.9 | |
| Democrats | Wayne Martin | 2,896 | 4.1 | -2.7 | |
| Independent | Miriam Cope | 1,311 | 1.9 | +1.9 | |
| Robert Voysey | 620 | 0.9 | +0.9 | ||
| Total formal votes | 70,382 | 98.0 | |||
| Informal votes | 1,432 | 2.0 | |||
| Turnout | 71,814 | 95.1 | |||
| Two-party-preferred result | |||||
| Labor | Bill Hayden | 68.8 | +10.3 | ||
| Liberal | Ronda Herrmann | 31.2 | -10.3 | ||
| Labor hold | Swing | +10.3 | |||
Petrie
- This section is an excerpt from Electoral results for the Division of Petrie § 1980
| Party | Candidate | Votes | % | ±% | |
|---|---|---|---|---|---|
| Liberal | John Hodges | 32,979 | 48.0 | -4.8 | |
| Labor | Deane Wells | 29,319 | 42.7 | +8.7 | |
| Democrats | Pauline Moylan | 4,668 | 6.8 | -5.1 | |
| Progress | Phillip Grimson | 1,768 | 2.6 | +1.3 | |
| Total formal votes | 68,734 | 98.4 | |||
| Informal votes | 1,091 | 1.6 | |||
| Turnout | 69,825 | 94.9 | |||
| Two-party-preferred result | |||||
| Liberal | John Hodges | 36,671 | 53.4 | -6.5 | |
| Labor | Deane Wells | 32,063 | 46.6 | +6.5 | |
| Liberal hold | Swing | -6.5 | |||
Ryan
- This section is an excerpt from Electoral results for the Division of Ryan § 1980
| Party | Candidate | Votes | % | ±% | |
|---|---|---|---|---|---|
| Liberal | John Moore | 36,780 | 55.1 | -5.9 | |
| Labor | Peter Beattie | 22,697 | 34.0 | +0.8 | |
| Democrats | Geoffrey Rees | 6,004 | 9.0 | +3.2 | |
| Progress | Philip Sturgess | 1,297 | 1.9 | +1.9 | |
| Total formal votes | 66,778 | 98.6 | |||
| Informal votes | 921 | 1.4 | |||
| Turnout | 67,699 | 94.6 | |||
| Two-party-preferred result | |||||
| Liberal | John Moore | 60.4 | -3.0 | ||
| Labor | Peter Beattie | 39.6 | +3.0 | ||
| Liberal hold | Swing | -3.0 | |||
Wide Bay
- This section is an excerpt from Electoral results for the Division of Wide Bay § 1980
| Party | Candidate | Votes | % | ±% | |
|---|---|---|---|---|---|
| National Country | Clarrie Millar | 33,377 | 50.4 | -2.8 | |
| Labor | James Finemore | 26,708 | 40.4 | +3.6 | |
| Democrats | Geoffrey Schuh | 4,414 | 6.7 | -3.3 | |
| Progress | Raymond Bird | 1,675 | 2.5 | +2.5 | |
| Total formal votes | 66,174 | 98.5 | |||
| Informal votes | 997 | 1.5 | |||
| Turnout | 67,171 | 95.3 | |||
| Two-party-preferred result | |||||
| National Country | Clarrie Millar | 54.4 | -3.8 | ||
| Labor | James Finemore | 45.6 | +3.8 | ||
| National Country hold | Swing | -3.8 | |||
South Australia
| ||||||||||||||||||||||||||||||||||
All 11 SA seats in the House of Representatives 5 seats needed for a majority | ||||||||||||||||||||||||||||||||||
|---|---|---|---|---|---|---|---|---|---|---|---|---|---|---|---|---|---|---|---|---|---|---|---|---|---|---|---|---|---|---|---|---|---|---|
| ||||||||||||||||||||||||||||||||||
Adelaide
- This section is an excerpt from Electoral results for the Division of Adelaide § 1980
| Party | Candidate | Votes | % | ±% | |
|---|---|---|---|---|---|
| Labor | Chris Hurford | 36,124 | 52.1 | +1.2 | |
| Liberal | Peter Camm | 25,057 | 36.2 | −2.1 | |
| Democrats | Peter Adamson | 8,109 | 11.7 | +0.9 | |
| Total formal votes | 69,290 | 97.2 | |||
| Informal votes | 2,008 | 2.8 | |||
| Turnout | 71,298 | 94.1 | |||
| Two-party-preferred result | |||||
| Labor | Chris Hurford | 58.5 | +2.2 | ||
| Liberal | Peter Camm | 41.5 | −2.2 | ||
| Labor hold | Swing | +2.2 | |||
Barker
- This section is an excerpt from Electoral results for the Division of Barker § 1980
| Party | Candidate | Votes | % | ±% | |
|---|---|---|---|---|---|
| Liberal | James Porter | 40,445 | 57.5 | −5.9 | |
| Labor | Norman Napper | 20,323 | 28.9 | +1.0 | |
| Democrats | Ivor Childs | 3,924 | 5.6 | −3.1 | |
| National Country | Anthony Beck | 3,774 | 5.4 | +5.4 | |
| National Country | Kim Ross | 1,920 | 2.7 | +2.7 | |
| Total formal votes | 70,386 | 97.1 | |||
| Informal votes | 2,090 | 2.9 | |||
| Turnout | 72,476 | 95.8 | |||
| Two-party-preferred result | |||||
| Liberal | James Porter | 57.5 | −5.9 | ||
| Labor | Norman Napper | 42.5 | +5.9 | ||
| Liberal hold | Swing | −5.9 | |||
Bonython
- This section is an excerpt from Electoral results for the Division of Bonython § 1980
| Party | Candidate | Votes | % | ±% | |
|---|---|---|---|---|---|
| Labor | Neal Blewett | 40,825 | 54.4 | +3.9 | |
| Liberal | Mark Mau | 24,507 | 32.7 | +1.9 | |
| Democrats | John Longhurst | 8,288 | 11.1 | −7.5 | |
| Socialist Labour | John Villain | 716 | 1.0 | +1.0 | |
| Prog. Conservative | Donald Keitel | 656 | 0.9 | +0.9 | |
| Total formal votes | 74,992 | 96.7 | |||
| Informal votes | 2,535 | 3.3 | |||
| Turnout | 77,527 | 94.4 | |||
| Two-party-preferred result | |||||
| Labor | Neal Blewett | 62.4 | +2.6 | ||
| Liberal | Mark Mau | 37.6 | −2.6 | ||
| Labor hold | Swing | +2.6 | |||
Boothby
- This section is an excerpt from Electoral results for the Division of Boothby § 1980
| Party | Candidate | Votes | % | ±% | |
|---|---|---|---|---|---|
| Liberal | John McLeay | 41,542 | 56.2 | −1.2 | |
| Labor | Bruce Whyatt | 22,001 | 29.7 | +3.9 | |
| Democrats | Martin Holt | 9,664 | 13.1 | −3.7 | |
| Prog. Conservative | James Russell | 762 | 1.0 | +1.0 | |
| Total formal votes | 73,969 | 98.1 | |||
| Informal votes | 1,408 | 1.9 | |||
| Turnout | 75,377 | 94.4 | |||
| Two-party-preferred result | |||||
| Liberal | John McLeay | 62.6 | −3.2 | ||
| Labor | Bruce Whyatt | 37.4 | +3.2 | ||
| Liberal hold | Swing | −3.2 | |||
Grey
- This section is an excerpt from Electoral results for the Division of Grey § 1980
| Party | Candidate | Votes | % | ±% | |
|---|---|---|---|---|---|
| Labor | Laurie Wallis | 33,871 | 50.1 | +3.4 | |
| Liberal | Brian Fitzgerald | 27,263 | 40.4 | +1.2 | |
| National Country | Anthony Haskett | 3,342 | 4.9 | -4.2 | |
| Democrats | Mary Good | 3,084 | 4.6 | -0.4 | |
| Total formal votes | 67,560 | 97.4 | |||
| Informal votes | 1,801 | 2.6 | |||
| Turnout | 69,361 | 95.0 | |||
| Two-party-preferred result | |||||
| Labor | Laurie Wallis | 53.4 | +3.4 | ||
| Liberal | Brian Fitzgerald | 46.6 | -3.4 | ||
| Labor hold | Swing | +3.4 | |||
Hawker
- This section is an excerpt from Electoral results for the Division of Hawker § 1980
| Party | Candidate | Votes | % | ±% | |
|---|---|---|---|---|---|
| Labor | Ralph Jacobi | 34,066 | 49.4 | +4.6 | |
| Liberal | Mark Hanckel | 29,187 | 42.3 | -1.7 | |
| Democrats | Kenneth Johnson | 5,720 | 8.3 | -1.9 | |
| Total formal votes | 68,973 | 97.7 | |||
| Informal votes | 1,590 | 2.3 | |||
| Turnout | 70,563 | 94.7 | |||
| Two-party-preferred result | |||||
| Labor | Ralph Jacobi | 37,073 | 53.8 | +3.2 | |
| Liberal | Mark Hanckel | 31,900 | 46.2 | -3.2 | |
| Labor hold | Swing | +3.2 | |||
Hindmarsh
- This section is an excerpt from Electoral results for the Division of Hindmarsh § 1980
| Party | Candidate | Votes | % | ±% | |
|---|---|---|---|---|---|
| Labor | John Scott | 34,106 | 48.0 | -7.2 | |
| Liberal | George Basisovs | 27,379 | 38.5 | +6.0 | |
| Democrats | Peter Gagliardi | 6,535 | 9.2 | -3.0 | |
| Socialist Workers | Therese Doyle | 1,531 | 2.2 | +2.2 | |
| Independent | Alf Gard | 1,500 | 2.1 | +2.1 | |
| Total formal votes | 71,051 | 96.1 | |||
| Informal votes | 2,891 | 3.9 | |||
| Turnout | 73,942 | 95.1 | |||
| Two-party-preferred result | |||||
| Labor | John Scott | 56.2 | -5.1 | ||
| Liberal | George Basisovs | 43.8 | +5.1 | ||
| Labor hold | Swing | -5.1 | |||
Kingston
- This section is an excerpt from Electoral results for the Division of Kingston § 1980
| Party | Candidate | Votes | % | ±% | |
|---|---|---|---|---|---|
| Liberal | Grant Chapman | 35,069 | 46.3 | +1.0 | |
| Labor | Richard Gun | 33,822 | 44.7 | +2.8 | |
| Democrats | Judith Jenkins | 6,813 | 9.0 | -3.8 | |
| Total formal votes | 75,704 | 98.1 | |||
| Informal votes | 1,485 | 1.9 | |||
| Turnout | 77,189 | 95.8 | |||
| Two-party-preferred result | |||||
| Liberal | Grant Chapman | 38,034 | 50.2 | -1.6 | |
| Labor | Richard Gun | 37,670 | 49.8 | +1.6 | |
| Liberal hold | Swing | -1.6 | |||
Port Adelaide
- This section is an excerpt from Electoral results for the Division of Port Adelaide § 1980
| Party | Candidate | Votes | % | ±% | |
|---|---|---|---|---|---|
| Labor | Mick Young | 43,746 | 63.0 | +3.0 | |
| Liberal | Shirley de Garis | 19,580 | 28.2 | -2.2 | |
| Democrats | Robert Manhire | 4,846 | 7.0 | -0.3 | |
| Communist | Elliott Johnston | 1,261 | 1.8 | -0.5 | |
| Total formal votes | 69,433 | 96.1 | |||
| Informal votes | 2,837 | 3.9 | |||
| Turnout | 72,270 | 94.9 | |||
| Two-party-preferred result | |||||
| Labor | Mick Young | 68.8 | +3.1 | ||
| Liberal | Shirley de Garis | 31.2 | -3.1 | ||
| Labor hold | Swing | +3.1 | |||
Sturt
- This section is an excerpt from Electoral results for the Division of Sturt § 1980
| Party | Candidate | Votes | % | ±% | |
|---|---|---|---|---|---|
| Liberal | Ian Wilson | 37,018 | 50.9 | -0.1 | |
| Labor | Andrew Dunstan | 29,457 | 40.5 | -0.1 | |
| Democrats | David d'Angelo | 5,903 | 8.1 | -5.4 | |
| Prog. Conservative | Colin Wuttke | 354 | 0.5 | +0.5 | |
| Total formal votes | 72,732 | 97.5 | |||
| Informal votes | 1,902 | 2.5 | |||
| Turnout | 74,634 | 95.2 | |||
| Two-party-preferred result | |||||
| Liberal | Ian Wilson | 54.0 | -3.3 | ||
| Labor | Andrew Dunstan | 46.0 | +3.3 | ||
| Liberal hold | Swing | -3.3 | |||
Wakefield
- This section is an excerpt from Electoral results for the Division of Wakefield § 1980
| Party | Candidate | Votes | % | ±% | |
|---|---|---|---|---|---|
| Liberal | Geoffrey Giles | 41,934 | 59.8 | -2.1 | |
| Labor | Alan Reid | 20,308 | 29.0 | -0.9 | |
| Democrats | Rowland Beech | 5,971 | 8.5 | +0.3 | |
| National Country | Duncan Rose | 1,901 | 2.7 | +2.7 | |
| Total formal votes | 70,144 | 97.3 | |||
| Informal votes | 1,944 | 2.7 | |||
| Turnout | 72,058 | 95.6 | |||
| Two-party-preferred result | |||||
| Liberal | Geoffrey Giles | 66.2 | +0.2 | ||
| Labor | Alan Reid | 33.8 | -0.2 | ||
| Liberal hold | Swing | +0.2 | |||
Western Australia
| ||||||||||||||||||||||||||||||||||
All 11 WA seats in the House of Representatives 5 seats needed for a majority | ||||||||||||||||||||||||||||||||||
|---|---|---|---|---|---|---|---|---|---|---|---|---|---|---|---|---|---|---|---|---|---|---|---|---|---|---|---|---|---|---|---|---|---|---|
| ||||||||||||||||||||||||||||||||||
Canning
- This section is an excerpt from Electoral results for the Division of Canning § 1980
| Party | Candidate | Votes | % | ±% | |
|---|---|---|---|---|---|
| Liberal | Mel Bungey | 31,821 | 47.3 | +0.6 | |
| Labor | James Hansen | 28,206 | 42.0 | +13.6 | |
| Democrats | Theresa Cunningham | 6,285 | 9.4 | -0.7 | |
| Independent | Pamela Wells | 896 | 1.3 | +1.3 | |
| Total formal votes | 67,208 | 97.3 | |||
| Informal votes | 1,839 | 2.7 | |||
| Turnout | 69,047 | 94.1 | |||
| Two-party-preferred result | |||||
| Liberal | Mel Bungey | 34,806 | 51.8 | -13.0 | |
| Labor | James Hansen | 32,402 | 48.2 | +13.0 | |
| Liberal hold | Swing | -13.0 | |||
Curtin
- This section is an excerpt from Electoral results for the Division of Curtin § 1980
| Party | Candidate | Votes | % | ±% | |
|---|---|---|---|---|---|
| Liberal | Victor Garland | 35,373 | 58.9 | +0.1 | |
| Labor | Richard Grounds | 19,680 | 32.8 | +8.4 | |
| Democrats | Gary Payne | 4,985 | 8.3 | −6.1 | |
| Total formal votes | 60,038 | 97.8 | |||
| Informal votes | 1,321 | 2.2 | |||
| Turnout | 61,359 | 93.0 | |||
| Two-party-preferred result | |||||
| Liberal | Victor Garland | 62.3 | −6.5 | ||
| Labor | Richard Grounds | 37.7 | +6.5 | ||
| Liberal hold | Swing | −6.5 | |||
Forrest
- This section is an excerpt from Electoral results for the Division of Forrest § 1980
| Party | Candidate | Votes | % | ±% | |
|---|---|---|---|---|---|
| Liberal | Peter Drummond | 31,005 | 51.3 | +4.4 | |
| Labor | Walter MacMillan | 21,749 | 36.0 | +6.7 | |
| Democrats | Alfred Bussell | 4,206 | 7.0 | +0.0 | |
| National Country | Francis Timms | 3,468 | 5.7 | -7.2 | |
| Total formal votes | 60,428 | 97.3 | |||
| Informal votes | 1,663 | 2.7 | |||
| Turnout | 62,091 | 94.0 | |||
| Two-party-preferred result | |||||
| Liberal | Peter Drummond | 59.8 | -4.4 | ||
| Labor | Walter MacMillan | 40.2 | +4.4 | ||
| Liberal hold | Swing | -4.4 | |||
Fremantle
- This section is an excerpt from Electoral results for the Division of Fremantle § 1980
| Party | Candidate | Votes | % | ±% | |
|---|---|---|---|---|---|
| Labor | John Dawkins | 36,272 | 58.1 | +8.5 | |
| Liberal | Donald McLeod | 21,425 | 34.3 | -2.8 | |
| Democrats | Graham Hull | 3,791 | 6.1 | -3.8 | |
| Socialist Workers | Angelo Lopez | 915 | 1.5 | +1.5 | |
| Total formal votes | 62,403 | 96.9 | |||
| Informal votes | 1,982 | 3.1 | |||
| Turnout | 64,385 | 94.0 | |||
| Two-party-preferred result | |||||
| Labor | John Dawkins | 63.1 | +6.8 | ||
| Liberal | Donald McLeod | 36.9 | -6.8 | ||
| Labor hold | Swing | +6.8 | |||
Kalgoorlie
- This section is an excerpt from Electoral results for the Division of Kalgoorlie § 1980
| Party | Candidate | Votes | % | ±% | |
|---|---|---|---|---|---|
| Liberal | Mick Cotter | 26,562 | 46.5 | -1.8 | |
| Labor | Graeme Campbell | 25,845 | 45.2 | +6.8 | |
| Democrats | Trevor Butler | 4,723 | 8.3 | +2.0 | |
| Total formal votes | 57,130 | 97.6 | |||
| Informal votes | 1,419 | 2.4 | |||
| Turnout | 58,549 | 87.7 | |||
| Two-party-preferred result | |||||
| Labor | Graeme Campbell | 28,889 | 50.6 | +8.1 | |
| Liberal | Mick Cotter | 28,241 | 49.4 | -8.1 | |
| Labor gain from Liberal | Swing | +8.1 | |||
Moore
- This section is an excerpt from Electoral results for the Division of Moore § 1980
| Party | Candidate | Votes | % | ±% | |
|---|---|---|---|---|---|
| Liberal | John Hyde | 31,021 | 47.0 | +3.2 | |
| Labor | Allen Blanchard | 28,267 | 42.9 | +15.1 | |
| Democrats | Donald McComish | 5,152 | 7.8 | -4.4 | |
| National Country | Gladwin Wood | 1,506 | 2.3 | -9.9 | |
| Total formal votes | 65,946 | 97.5 | |||
| Informal votes | 1,658 | 2.5 | |||
| Turnout | 67,604 | 94.1 | |||
| Two-party-preferred result | |||||
| Liberal | John Hyde | 34,852 | 52.8 | -11.1 | |
| Labor | Allen Blanchard | 31,094 | 47.2 | +11.1 | |
| Liberal hold | Swing | -11.1 | |||
O'Connor
- This section is an excerpt from Electoral results for the Division of O'Connor § 1980
| Party | Candidate | Votes | % | ±% | |
|---|---|---|---|---|---|
| Liberal | Wilson Tuckey | 23,998 | 40.3 | -6.5 | |
| Labor | Robert Duncannon | 13,814 | 23.2 | +5.0 | |
| National Country | Anthony Hassell | 10,863 | 18.2 | -8.0 | |
| National | Eric Charlton | 8,915 | 15.0 | +15.0 | |
| Democrats | Guy Wroth | 1,994 | 3.3 | -2.0 | |
| Total formal votes | 59,584 | 96.7 | |||
| Informal votes | 2,041 | 3.3 | |||
| Turnout | 61,625 | 94.2 | |||
| Two-candidate-preferred result | |||||
| Liberal | Wilson Tuckey | 37,249 | 62.5 | -2.7 | |
| National Country | Anthony Hassell | 22,335 | 37.5 | +2.7 | |
| Liberal notional hold | Swing | -2.7 | |||
Perth
- This section is an excerpt from Electoral results for the Division of Perth § 1980
| Party | Candidate | Votes | % | ±% | |
|---|---|---|---|---|---|
| Liberal | Ross McLean | 29,131 | 48.2 | -2.6 | |
| Labor | William Delaney | 27,599 | 45.7 | +10.4 | |
| Democrats | Robert Foster | 3,112 | 5.2 | -4.6 | |
| Prog. Conservative | June Steen-Olsen | 551 | 0.9 | +0.9 | |
| Total formal votes | 60,403 | 97.0 | |||
| Informal votes | 1,843 | 3.0 | |||
| Turnout | 62,246 | 93.0 | |||
| Two-party-preferred result | |||||
| Liberal | Ross McLean | 30,807 | 51.0 | -8.5 | |
| Labor | William Delaney | 29,596 | 49.0 | +8.5 | |
| Liberal hold | Swing | -8.5 | |||
Stirling
- This section is an excerpt from Electoral results for the Division of Stirling § 1980
| Party | Candidate | Votes | % | ±% | |
|---|---|---|---|---|---|
| Liberal | Ian Viner | 30,307 | 48.9 | -1.3 | |
| Labor | Richard Pitts | 26,135 | 42.2 | +10.1 | |
| Democrats | Jean Jenkins | 4,242 | 6.8 | -8.0 | |
| Independent | Roger Broinowski | 1,301 | 2.1 | +2.1 | |
| Total formal votes | 61,985 | 97.3 | |||
| Informal votes | 1,716 | 2.7 | |||
| Turnout | 63,701 | 94.2 | |||
| Two-party-preferred result | |||||
| Liberal | Ian Viner | 32,206 | 52.0 | -7.7 | |
| Labor | Richard Pitts | 29,779 | 48.0 | +7.7 | |
| Liberal hold | Swing | -7.7 | |||
Swan
- This section is an excerpt from Electoral results for the Division of Swan § 1980
| Party | Candidate | Votes | % | ±% | |
|---|---|---|---|---|---|
| Labor | Kim Beazley | 32,476 | 53.3 | +13.7 | |
| Liberal | John Martyr | 24,401 | 40.1 | -2.8 | |
| Democrats | Jean Ritter | 3,288 | 5.4 | -6.4 | |
| Socialist Workers | Stephen Painter | 750 | 1.2 | +1.2 | |
| Total formal votes | 60,915 | 97.1 | |||
| Informal votes | 1,790 | 2.9 | |||
| Turnout | 62,705 | 93.3 | |||
| Two-party-preferred result | |||||
| Labor | Kim Beazley | 57.6 | +8.1 | ||
| Liberal | John Martyr | 42.4 | -8.1 | ||
| Labor gain from Liberal | Swing | +8.1 | |||
Tangney
- This section is an excerpt from Electoral results for the Division of Tangney § 1980
| Party | Candidate | Votes | % | ±% | |
|---|---|---|---|---|---|
| Liberal | Peter Shack | 32,592 | 50.1 | -0.1 | |
| Labor | Maureen Wong | 26,216 | 40.3 | +8.6 | |
| Democrats | Robert McCormack | 6,288 | 9.7 | -4.8 | |
| Total formal votes | 65,096 | 97.7 | |||
| Informal votes | 1,549 | 2.3 | |||
| Turnout | 66,645 | 94.3 | |||
| Two-party-preferred result | |||||
| Liberal | Peter Shack | 54.6 | -5.3 | ||
| Labor | Maureen Wong | 45.4 | +5.3 | ||
| Liberal hold | Swing | -5.3 | |||
Tasmania
| ||||||||||||||||||||||||||||||||||
All 5 Tasmanian seats in the House of Representatives 3 seats needed for a majority | ||||||||||||||||||||||||||||||||||
|---|---|---|---|---|---|---|---|---|---|---|---|---|---|---|---|---|---|---|---|---|---|---|---|---|---|---|---|---|---|---|---|---|---|---|
| ||||||||||||||||||||||||||||||||||
Bass
- This section is an excerpt from Electoral results for the Division of Bass § 1980
| Party | Candidate | Votes | % | ±% | |
|---|---|---|---|---|---|
| Liberal | Kevin Newman | 27,586 | 53.0 | −2.7 | |
| Labor | Patti Warn | 23,199 | 44.5 | +7.8 | |
| Independent | Olga Scully | 1,310 | 2.5 | +2.5 | |
| Total formal votes | 52,095 | 97.5 | |||
| Informal votes | 1,320 | 2.5 | |||
| Turnout | 53,415 | 96.7 | |||
| Two-party-preferred result | |||||
| Liberal | Kevin Newman | 54.3 | −5.7 | ||
| Labor | Patti Warn | 45.7 | +5.7 | ||
| Liberal hold | Swing | −5.7 | |||
Braddon
- This section is an excerpt from Electoral results for the Division of Braddon § 1980
| Party | Candidate | Votes | % | ±% | |
|---|---|---|---|---|---|
| Liberal | Ray Groom | 27,307 | 55.1 | −3.1 | |
| Labor | Lance Fee | 22,275 | 44.9 | +3.1 | |
| Total formal votes | 49,582 | 97.1 | |||
| Informal votes | 1,496 | 2.9 | |||
| Turnout | 51,078 | 94.8 | |||
| Liberal hold | Swing | −3.1 | |||
Denison
- This section is an excerpt from Electoral results for the Division of Denison § 1980
| Party | Candidate | Votes | % | ±% | |
|---|---|---|---|---|---|
| Liberal | Michael Hodgman | 25,751 | 50.2 | -0.7 | |
| Labor | Ken Wriedt | 23,538 | 45.9 | +1.2 | |
| Democrats | Peter Creet | 1,998 | 3.9 | -0.5 | |
| Total formal votes | 51,287 | 97.5 | |||
| Informal votes | 1,340 | 2.5 | |||
| Turnout | 52,627 | 96.6 | |||
| Two-party-preferred result | |||||
| Liberal | Michael Hodgman | 52.4 | -0.7 | ||
| Labor | Ken Wriedt | 47.6 | +0.7 | ||
| Liberal hold | Swing | -0.7 | |||
Franklin
- This section is an excerpt from Electoral results for the Division of Franklin § 1980
| Party | Candidate | Votes | % | ±% | |
|---|---|---|---|---|---|
| Liberal | Bruce Goodluck | 26,893 | 51.3 | -3.4 | |
| Labor | Fran Bladel | 23,809 | 45.4 | +0.1 | |
| Democrats | John Thomson | 1,734 | 3.3 | +3.3 | |
| Total formal votes | 52,436 | 97.6 | |||
| Informal votes | 1,264 | 2.4 | |||
| Turnout | 53,700 | 96.9 | |||
| Two-party-preferred result | |||||
| Liberal | Bruce Goodluck | 52.7 | -2.0 | ||
| Labor | Fran Bladel | 47.3 | +2.0 | ||
| Liberal hold | Swing | -2.0 | |||
Wilmot
- This section is an excerpt from Electoral results for the Division of Wilmot § 1980
| Party | Candidate | Votes | % | ±% | |
|---|---|---|---|---|---|
| Liberal | Max Burr | 25,607 | 50.1 | -3.5 | |
| Labor | David Llewellyn | 25,515 | 49.9 | +3.5 | |
| Total formal votes | 51,122 | 97.1 | |||
| Informal votes | 1,547 | 2.9 | |||
| Turnout | 52,699 | 96.7 | |||
| Liberal hold | Swing | -5.7 | |||
Australian Capital Territory
| ||||||||||||||||||||||||||||||||||
All 3 ACT seats in the House of Representatives 2 seats needed for a majority | ||||||||||||||||||||||||||||||||||
|---|---|---|---|---|---|---|---|---|---|---|---|---|---|---|---|---|---|---|---|---|---|---|---|---|---|---|---|---|---|---|---|---|---|---|
| ||||||||||||||||||||||||||||||||||
Canberra
- This section is an excerpt from Electoral results for the Division of Canberra § 1980
| Party | Candidate | Votes | % | ±% | |
|---|---|---|---|---|---|
| Labor | Ros Kelly | 32,352 | 52.4 | +11.6 | |
| Liberal | John Haslem | 25,957 | 42.1 | −1.1 | |
| Democrats | Leo Nesic | 2,845 | 4.6 | −10.4 | |
| Independent | Kevin Wise | 574 | 0.9 | +0.9 | |
| Total formal votes | 61,728 | 98.1 | |||
| Informal votes | 1,215 | 1.9 | |||
| Turnout | 62,943 | 94.9 | |||
| Two-party-preferred result | |||||
| Labor | Ros Kelly | 55.7 | +6.7 | ||
| Liberal | John Haslem | 44.3 | −6.7 | ||
| Labor gain from Liberal | Swing | +6.7 | |||
Fraser
- This section is an excerpt from Electoral results for the Division of Fraser (Australian Capital Territory) § 1980
| Party | Candidate | Votes | % | ±% | |
|---|---|---|---|---|---|
| Labor | Ken Fry | 36,564 | 57.3 | −2.1 | |
| Liberal | Michael Yabsley | 22,059 | 34.6 | −6.0 | |
| Democrats | Dimmen de Graaff | 4,156 | 6.5 | +6.5 | |
| Independent | Kevin Wise | 636 | 1.0 | +1.0 | |
| Independent | Basil Yakimov | 367 | 0.6 | +0.6 | |
| Total formal votes | 63,782 | 97.6 | |||
| Informal votes | 1,537 | 2.4 | |||
| Turnout | 65,319 | 93.8 | |||
| Two-party-preferred result | |||||
| Labor | Ken Fry | 62.5 | +3.1 | ||
| Liberal | Michael Yabsley | 37.5 | −3.1 | ||
| Labor hold | Swing | +3.1 | |||
Northern Territory
| ||||||||||||||||||||||||||||||||||
Division of Northern Territory | ||||||||||||||||||||||||||||||||||
|---|---|---|---|---|---|---|---|---|---|---|---|---|---|---|---|---|---|---|---|---|---|---|---|---|---|---|---|---|---|---|---|---|---|---|
| ||||||||||||||||||||||||||||||||||
- This section is an excerpt from Electoral results for the Division of Northern Territory § 1980
| Party | Candidate | Votes | % | ±% | |
|---|---|---|---|---|---|
| Country Liberal | Grant Tambling | 18,805 | 43.6 | -3.8 | |
| Labor | John Waters | 17,426 | 40.4 | -2.2 | |
| Democrats | Max Stewart | 2,509 | 5.8 | -1.3 | |
| Independent | Galarrwuy Yunupingu | 2,415 | 5.6 | +5.6 | |
| Independent | Pamela Gardiner | 1,129 | 2.6 | +2.6 | |
| Marijuana | Graham Gillian | 486 | 1.1 | +1.1 | |
| Christian Democrat | John McElroy | 272 | 0.6 | +0.6 | |
| Independent | Malcolm Womersley | 130 | 0.3 | +0.3 | |
| Total formal votes | 43,172 | 95.1 | |||
| Informal votes | 2,231 | 4.9 | |||
| Turnout | 45,403 | 82.3 | |||
| Two-party-preferred result | |||||
| Country Liberal | Grant Tambling | 22,090 | 51.2 | -1.3 | |
| Labor | John Waters | 21,082 | 48.8 | +1.3 | |
| Country Liberal hold | Swing | -1.3 | |||
See also
References
- "1980 House of Representatives". Psephos Adam Carr's Election Archive. Retrieved 29 May 2022.
- "1980 House of Representatives: NSW". Psephos Adam Carr's Election Archive. Retrieved 29 May 2022.
- "1980 House of Representatives: Victoria". Psephos Adam Carr's Election Archive. Retrieved 29 May 2022.
- "1980 House of Representatives: Queensland". Psephos Adam Carr's Election Archive. Retrieved 29 May 2022.
- "1980 House of Representatives: South Australia". Psephos Adam Carr's Election Archive. Retrieved 29 May 2022.
- "1980 House of Representatives: Western Australia". Psephos Adam Carr's Election Archive. Retrieved 29 May 2022.
- "1980 House of Representatives: Tasmania". Psephos Adam Carr's Election Archive. Retrieved 29 May 2022.
- "1980 House of Representatives: Australian Capital Territory". Psephos Adam Carr's Election Archive. Retrieved 29 May 2022.
- "1980 House of Representatives: Northern Territory". Psephos Adam Carr's Election Archive. Retrieved 29 May 2022.
| House of Representatives | |||
|---|---|---|---|
| Senate | |||
| By-elections | |||
This article is issued from Wikipedia. The text is licensed under Creative Commons - Attribution - Sharealike. Additional terms may apply for the media files.