Results of the 2001 Australian federal election (House of Representatives)
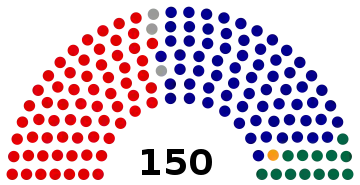
The following tables show results for the Australian House of Representatives at the 2001 federal election held on 10 November 2001. The parliament increased from 148 to 150 seats, with a new seat in Western Australia and a new seat in the Northern Territory.
| ||||||||||||||||||||||||||||||||||
All 150 seats in the Australian House of Representatives 76 seats needed for a majority | ||||||||||||||||||||||||||||||||||
| Turnout | 94.3% | |||||||||||||||||||||||||||||||||
|---|---|---|---|---|---|---|---|---|---|---|---|---|---|---|---|---|---|---|---|---|---|---|---|---|---|---|---|---|---|---|---|---|---|---|
| ||||||||||||||||||||||||||||||||||

2001 Australian federal election |
|---|
| National results |
| State and territory results |
|
|
Australia
| Party | Votes | % | Swing | Seats | Change | |||
|---|---|---|---|---|---|---|---|---|
| Liberal | 4,254,072 | 37.08 | +3.19 | 68 | ||||
| National | 643,926 | 5.61 | +0.32 | 13 | ||||
| Country Liberal | 36,961 | 0.32 | –0.00 | 1 | ||||
| Liberal–National coalition | 4,934,959 | 42.92 | +3.41 | 82 | ||||
| Labor | 4,341,420 | 37.84 | −2.26 | 65 | ||||
| Democrats | 620,197 | 5.41 | +0.28 | 0 | ||||
| Greens | 569,074 | 4.96 | +2.82 | 0 | ||||
| One Nation | 498,032 | 4.34 | −4.09 | 0 | ||||
| Independents | 332,118 | 2.89 | +1.00 | 3 | ||||
| Total | 11,474,074 | 150 | ||||||
| Two-party-preferred vote | ||||||||
| Coalition | 5,655,791 | 51.03 | +2.01 | 82 | ||||
| Labor | 5,427,569 | 48.97 | −2.01 | 65 | ||||
| Invalid/blank votes | 580,362 | 4.81 | +1.04 | |||||
| Turnout | 12,054,455 | 95.39 | ||||||
| Registered voters | 12,636,631 | |||||||
| Source: AEC Tally Room | ||||||||
Independents: Peter Andren, Tony Windsor, Bob Katter
States
New South Wales
| ||||||||||||||||||||||||||||||||||
All 50 New South Wales seats in the Australian House of Representatives and 6 seats in the Australian Senate | ||||||||||||||||||||||||||||||||||
|---|---|---|---|---|---|---|---|---|---|---|---|---|---|---|---|---|---|---|---|---|---|---|---|---|---|---|---|---|---|---|---|---|---|---|
| ||||||||||||||||||||||||||||||||||

| Party | Votes | % | Swing | Seats | Change | ||
|---|---|---|---|---|---|---|---|
| Liberal | 1,272,208 | 33.58 | 3.09 | 21 | |||
| National | 349,372 | 9.22 | 1.32 | 7 | |||
| Liberal/National Coalition | 1,621,580 | 42.80 | 4.41 | 28 | |||
| Labor | 1,380,822 | 36.45 | –3.67 | 20 | |||
| One Nation | 180,812 | 4.77 | –4.19 | ||||
| Greens | 180,079 | 4.75 | 2.09 | ||||
| Democrats | 160,706 | 4.24 | 0.08 | ||||
| Independent | 148,042 | 3.91 | 3.02 | 2 | |||
| Christian Democrats | 46,059 | 1.22 | 0.19 | ||||
| Unity | 24,653 | 0.65 | –0.90 | ||||
| Against Further Immigration | 12,033 | 0.32 | |||||
| Save the ADI Site | 6,029 | 0.16 | |||||
| Citizens Electoral Council | 5,746 | 0.15 | |||||
| No GST | 4,858 | 0.13 | |||||
| Progressive Labour | 4,467 | 0.12 | |||||
| Lower Excise Fuel | 3,098 | 0.08 | |||||
| HEMP | 2,193 | 0.06 | |||||
| Non-Custodial Parents | 0,769 | 0.02 | |||||
| Fishing Party | 0,720 | 0.02 | |||||
| Total | 3,788,459 | 50 | |||||
| Two-party-preferred vote | |||||||
| Liberal/National Coalition | 1,811,019 | 52.14 | +3.68 | 28 | |||
| Labor | 1,662,190 | 48.46 | –3.68 | 20 | |||
| Invalid/blank votes | 217,024 | 5.42 | +1.41 | ||||
| Turnout | 4,005,483 | 95.27 | |||||
| Registered voters | 4,204,383 | ||||||
| Source: AEC Tally Room | |||||||
Victoria
| ||||||||||||||||||||||||||||||||||
All 37 Victoria seats in the Australian House of Representatives and 6 seats in the Australian Senate | ||||||||||||||||||||||||||||||||||
|---|---|---|---|---|---|---|---|---|---|---|---|---|---|---|---|---|---|---|---|---|---|---|---|---|---|---|---|---|---|---|---|---|---|---|
| ||||||||||||||||||||||||||||||||||
| Party | Votes | % | Swing | Seats | Change | |||
|---|---|---|---|---|---|---|---|---|
| Liberal | 1,154,493 | 39.07 | 1.99 | 15 | ||||
| National | 91,049 | 3.08 | 0.36 | 2 | ||||
| Liberal/National Coalition | 1,245,542 | 42.15 | 2.35 | 17 | ||||
| Labor | 1,230,757 | 41.65 | –2.72 | 20 | ||||
| Democrats | 184,582 | 6.25 | 0.23 | |||||
| Greens | 174,399 | 5.90 | 3.81 | |||||
| Independents | 60,801 | 0.02 | ||||||
| One Nation | 37,811 | 1.28 | –2.44 | |||||
| Citizens Electoral Council | 6,692 | 0.23 | 0.08 | |||||
| Christian Democrats | 6,188 | 0.21 | 0.08 | |||||
| No GST | 5,104 | 0.17 | ||||||
| Liberals for Forests | 1,960 | 0.07 | ||||||
| Lower Excise Fuel | 1,194 | 0.04 | ||||||
| Total | 2,955,031 | 37 | ||||||
| Two-party-preferred vote | ||||||||
| Labor | 1,540,614 | 52.14 | –1.39 | 20 | ||||
| Liberal/National Coalition | 1,414,417 | 46.47 | +1.39 | 17 | ||||
| Invalid/blank votes | 122,525 | 3.68 | +0.47 | |||||
| Turnout | 2,955,031 | 95.61 | ||||||
| Registered voters | 3,218,746 | |||||||
| Source: AEC Tally Room | ||||||||
Queensland
| ||||||||||||||||||||||||||||||||||
All 27 Queensland seats in the Australian House of Representatives and 6 seats in the Australian Senate | ||||||||||||||||||||||||||||||||||
|---|---|---|---|---|---|---|---|---|---|---|---|---|---|---|---|---|---|---|---|---|---|---|---|---|---|---|---|---|---|---|---|---|---|---|
| ||||||||||||||||||||||||||||||||||
| Party | Votes | % | Swing | Seats | Change | |||
|---|---|---|---|---|---|---|---|---|
| Liberal | 767,959 | 36.46 | 5.60 | 15 | ||||
| National | 192,451 | 9.14 | –0.86 | 4 | ||||
| Liberal/National Coalition | 960,410 | 45.60 | +4.74 | 19 | ||||
| Labor | 730,920 | 34.70 | –1.40 | 7 | ||||
| One Nation | 148,930 | 7.07 | –7.28 | 0 | ||||
| Independent | 148,620 | 7.06 | 1 | |||||
| Democrats | 90,679 | 4.31 | 0.29 | |||||
| Greens | 73,467 | 3.49 | 1.11 | |||||
| Citizens Electoral Council | 2,849 | 0.14 | ||||||
| HEMP | 1,084 | 0.05 | ||||||
| Outdoor Recreation | 485 | 0.02 | ||||||
| Total | 2,106,255 | 28 | ||||||
| Two-party-preferred vote | ||||||||
| Liberal | 1,110,905 | 53.05 | +1.65 | 19 | ||||
| Labor | 919,867 | 46.95 | –1.65 | 7 | ||||
| Invalid/blank votes | 106,976 | 4.83 | +1.50 | |||||
| Turnout | 2,213,231 | 95.42 | ||||||
| Registered voters | 2,319,481 | |||||||
| Source: AEC Tally Room | ||||||||
Western Australia
| ||||||||||||||||||||||||||||||||||
All 15 Western Australian seats in the Australian House of Representatives and 6 seats in the Australian Senate | ||||||||||||||||||||||||||||||||||
|---|---|---|---|---|---|---|---|---|---|---|---|---|---|---|---|---|---|---|---|---|---|---|---|---|---|---|---|---|---|---|---|---|---|---|
| ||||||||||||||||||||||||||||||||||
| Party | Votes | % | Swing | Seats | Change | ||
|---|---|---|---|---|---|---|---|
| Liberal | 449,036 | 41.39 | +3.24 | 8 | |||
| Labor | 402,927 | 37.14 | -0.29 | 7 | |||
| One Nation | 67,992 | 6.27 | -3.01 | ||||
| Greens | 64,939 | 5.99 | +0.93 | ||||
| Democrats | 50,581 | 4.66 | +0.70 | ||||
| Liberals for Forests | 13,116 | 1.21 | |||||
| Christian Democrats | 12,792 | 1.18 | |||||
| National | 11,052 | 1.02 | |||||
| Independent | 6,957 | 0.64 | |||||
| Citizens Electoral Council | 2,907 | 0.27 | |||||
| Curtin Labor Alliance | 2,496 | 0.23 | |||||
| Total | 1,084,795 | 15 | |||||
| Two-party-preferred vote | |||||||
| Liberal | 48.38 | -1.08 | 8 | ||||
| Labor | 51.62 | 1.08 | 7 | ||||
South Australia
| ||||||||||||||||||||||||||||||||||
All 12 South Australian seats in the Australian House of Representatives and 6 seats in the Australian Senate | ||||||||||||||||||||||||||||||||||
|---|---|---|---|---|---|---|---|---|---|---|---|---|---|---|---|---|---|---|---|---|---|---|---|---|---|---|---|---|---|---|---|---|---|---|
| ||||||||||||||||||||||||||||||||||
| Party | Votes | % | Swing | Seats | Change | |
|---|---|---|---|---|---|---|
| Liberal | 430,442 | 45.90 | 3.85 | 9 | ||
| Labor | 316,362 | 33.74 | -0.74 | 3 | ||
| Democrats | 98,849 | 10.54 | 0.40 | |||
| One Nation | 44,574 | 4.75 | -5.05 | |||
| Greens | 34,141 | 3.64 | 3.15 | |||
| Independents | 7,921 | 0.80 | ||||
| No GST | 4,202 | 0.42 | +0.42 | |||
| Communist | 0,672 | 0.07 | ||||
| Total | 937,708 | 12 | ||||
| Two-party-preferred vote | ||||||
| Liberal | 45.92 | -0.97 | 9 | |||
| Labor | 54.08 | 0.97 | 3 | |||
Tasmania
| ||||||||||||||||||||||||||||||||||
All 5 Tasmanian seats in the Australian House of Representatives and 6 seats in the Australian Senate | ||||||||||||||||||||||||||||||||||
|---|---|---|---|---|---|---|---|---|---|---|---|---|---|---|---|---|---|---|---|---|---|---|---|---|---|---|---|---|---|---|---|---|---|---|
| ||||||||||||||||||||||||||||||||||
| Party | Votes | % | Swing | Seats | Change | ||
|---|---|---|---|---|---|---|---|
| Labor | 145,305 | 47.17 | –1.73 | 5 | |||
| Liberal | 114,283 | 37.10 | –1.07 | 0 | |||
| Greens | 24,052 | 7.81 | +2.25 | ||||
| Democrats | 13,785 | 4.48 | +1.22 | ||||
| One Nation | 8,847 | 2.87 | +0.42 | ||||
| Liberals for Forests | 966 | 1.59 | +1.59 | ||||
| Tasmania First | 621 | 1.02 | –0.89 | ||||
| Citizens Electoral Council | 159 | 0.26 | +0.26 | ||||
| Total | 308,018 | 5 | |||||
| Two-party-preferred vote | |||||||
| Labor | 57.73 | +0.41 | 5 | ||||
| Liberal | 42.27 | –0.41 | 0 | ||||
Territories
Australian Capital Territory
| ||||||||||||||||||||||||||||||||||
All 2 Australian Capital Territory seats in the Australian House of Representatives and all 2 seats in the Australian Senate | ||||||||||||||||||||||||||||||||||
|---|---|---|---|---|---|---|---|---|---|---|---|---|---|---|---|---|---|---|---|---|---|---|---|---|---|---|---|---|---|---|---|---|---|---|
| ||||||||||||||||||||||||||||||||||
| Party | Votes | % | Swing | Seats | Change | |
|---|---|---|---|---|---|---|
| Labor | 95,215 | 46.98 | –3.66 | 2 | ||
| Liberal | 65,651 | 32.39 | 1.87 | 0 | ||
| Democrats | 16,266 | 8.03 | 0.63 | |||
| Greens | 14,335 | 7.07 | 2.89 | |||
| One Nation | 5,576 | 2.75 | –2.33 | |||
| Christian Democrats | 5,623 | 2.77 | 0.60 | |||
| Total | 202,666 | 2 | ||||
| Two-party-preferred vote | ||||||
| Labor | 61.08 | –1.36 | 2 | |||
| Liberal | 38.92 | 1.36 | 0 | |||
Northern Territory
| ||||||||||||||||||||||||||||||||||
All 2 Northern Territory seats in the Australian House of Representatives and all 2 seats in the Australian Senate | ||||||||||||||||||||||||||||||||||
|---|---|---|---|---|---|---|---|---|---|---|---|---|---|---|---|---|---|---|---|---|---|---|---|---|---|---|---|---|---|---|---|---|---|---|
| ||||||||||||||||||||||||||||||||||
| Party | Votes | % | Swing | Seats | Change | |
|---|---|---|---|---|---|---|
| Labor | 39,111 | 42.90 | 0.60 | 1 | ||
| Country Liberal | 36,961 | 40.54 | 0.94 | 1 | ||
| Democrats | 4,795 | 5.26 | 0.14 | |||
| Greens | 3,665 | 4.02 | 0.99 | |||
| One Nation | 3,486 | 3.82 | -4.31 | |||
| Independents | 3,143 | 3.45 | 2.33 | |||
| Total | 91,161 | 2 | ||||
| Two-party-preferred vote | ||||||
| Labor | 52.49 | 1.92 | 1 | |||
| Country Liberal | 47.51 | –1.92 | 1 | |||
References
- "2001 First preference votes for New South Wales". Australian Electoral Commission. Retrieved 8 June 2022.
- "2001 First preference votes for Victoria". Australian Electoral Commission. Retrieved 8 June 2022.
- "2001 First preference votes for Queensland". Australian Electoral Commission. Retrieved 8 June 2022.
- "2001 First preference votes for Western Australia". Australian Electoral Commission. Retrieved 8 June 2022.
- "2001 First preference votes for South Australia". Australian Electoral Commission. Retrieved 8 June 2022.
- "2001 First preference votes for Tasmania". Australian Electoral Commission. Retrieved 8 June 2022.
- "2001 First preference votes for the Australian Capital Territory". Australian Electoral Commission. Retrieved 7 June 2022.
- "2001 First preference votes for the Northern Territory". Australian Electoral Commission. Retrieved 7 June 2022.
| House of Representatives | |||
|---|---|---|---|
| Senate | |||
| By-elections | |||
This article is issued from Wikipedia. The text is licensed under Creative Commons - Attribution - Sharealike. Additional terms may apply for the media files.