Results of the 2022 Australian federal election (House of Representatives)
| ||||||||||||||||||||||||||||||||||||||||||||||||||||||
All 151 seats in the Australian House of Representatives 76 seats needed for a majority | ||||||||||||||||||||||||||||||||||||||||||||||||||||||
| Turnout | 89.82% | |||||||||||||||||||||||||||||||||||||||||||||||||||||
|---|---|---|---|---|---|---|---|---|---|---|---|---|---|---|---|---|---|---|---|---|---|---|---|---|---|---|---|---|---|---|---|---|---|---|---|---|---|---|---|---|---|---|---|---|---|---|---|---|---|---|---|---|---|---|
| ||||||||||||||||||||||||||||||||||||||||||||||||||||||

.jpg.webp)
2022 Australian federal election |
|---|
| National results |
| State and territory results |
The number of seats won by each party in the Australian House of Representatives at the 2022 federal election were: Coalition 58, Labor 77, Australian Greens 4, Centre Alliance 1, Katter's Australian Party 1, and Independents 10.[1]
This election was held using instant-runoff voting. In almost all the districts, the candidate who led in the first count was elected. Overall, only in 13 districts did a candidate who did not lead in the first count succeed in taking a seat in the end.
Australia

Labor (77)
Opposition (58)
Coalition
Liberal (27)
LNP (Qld) (21)[lower-alpha 5]
National (10)
Crossbench (16)
Independent (10)
Greens (4)
Centre Alliance (1)
Katter's Australian (1)
 | |||||||||
| Party | Primary vote | Seats | |||||||
|---|---|---|---|---|---|---|---|---|---|
| Votes | % | Swing (pp) | Seats | Change | |||||
| Liberal | 3,502,713 | 23.89 | −4.09 | 27 | |||||
| Liberal National (Qld) | 1,172,515 | 8.00 | −0.68 | 21 | |||||
| National | 528,442 | 3.60 | −0.90 | 10 | |||||
| Country Liberal (NT) | 29,664 | 0.20 | −0.07 | 0 | |||||
| Liberal/National Coalition | 5,233,334 | 35.70 | −5.73 | 58 | |||||
| Labor | 4,776,030 | 32.58 | −0.76 | 77 | |||||
| Greens | 1,795,985 | 12.25 | +1.85 | 4 | |||||
| One Nation | 727,464 | 4.96 | +1.89 | 0 | |||||
| United Australia | 604,536 | 4.12 | +0.69 | 0 | |||||
| Liberal Democrats | 252,963 | 1.73 | +1.49 | 0 | |||||
| Animal Justice | 87,451 | 0.60 | –0.22 | 0 | |||||
| Australian Federation | 57,555 | 0.39 | +0.39 | 0 | |||||
| Katter's Australian | 55,863 | 0.38 | −0.11 | 1 | |||||
| Centre Alliance | 36,500 | 0.25 | −0.08 | 1 | |||||
| Western Australia | 33,263 | 0.23 | +0.05 | 0 | |||||
| Great Australian | 30,392 | 0.21 | +0.17 | 0 | |||||
| Victorian Socialists | 27,226 | 0.19 | +0.10 | 0 | |||||
| Informed Medical Options | 25,850 | 0.18 | +0.17 | 0 | |||||
| Jacqui Lambie Network | 23,730 | 0.16 | +0.16 | 0 | |||||
| Australian Christians | 19,867 | 0.14 | −0.03 | 0 | |||||
| Shooters, Fishers and Farmers | 18,422 | 0.13 | –0.16 | 0 | |||||
| Fusion | 13,319 | 0.09 | +0.09 | 0 | |||||
| Socialist Alliance | 11,971 | 0.08 | +0.06 | 0 | |||||
| Indigenous-Aboriginal | 7,326 | 0.05 | +0.05 | 0 | |||||
| Justice | 6,494 | 0.04 | –0.15 | 0 | |||||
| TNL | 6,331 | 0.04 | +0.04 | 0 | |||||
| Legalise Cannabis | 6,025 | 0.04 | +0.04 | 0 | |||||
| Australian Values | 5,622 | 0.04 | +0.04 | 0 | |||||
| Australian Citizens | 4,886 | 0.03 | +0.01 | 0 | |||||
| Local | 4,254 | 0.03 | +0.03 | 0 | |||||
| Sustainable Australia | 3,866 | 0.03 | –0.22 | 0 | |||||
| Democratic Alliance | 2,215 | 0.02 | +0.02 | 0 | |||||
| Reason | 1,458 | 0.01 | –0.05 | 0 | |||||
| Australian Progressives | 1,063 | 0.01 | –0.04 | 0 | |||||
| Australian Democrats | 651 | 0.00 | –0.01 | 0 | |||||
| Independents | 776,169 | 5.29 | +1.92 | 10 | |||||
| Total | 14,659,042 | 100.00 | 151 | ||||||
| Two-party-preferred vote | |||||||||
| Labor | 7,642,161 | 52.13 | +3.66 | ||||||
| Liberal/National Coalition | 7,016,881 | 47.87 | −3.66 | ||||||
| Invalid/blank votes | 802,337 | 5.19 | –0.35 | – | – | ||||
| Turnout | 15,461,379 | 89.82 | –2.07 | – | – | ||||
| Registered voters | 17,213,433 | – | – | – | – | ||||
| Source: AEC for both votes and seats | |||||||||
Maps
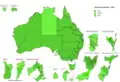 Greens
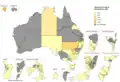 Liberal Democrats
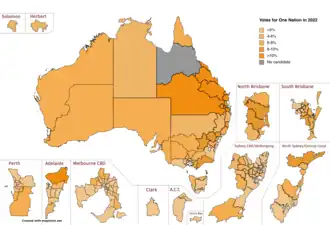 One Nation
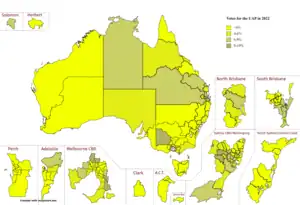 UAP
UAP
States
New South Wales
| ||||||||||||||||||||||||||||||||||
All 47 New South Wales seats in the Australian House of Representatives and 6 seats in the Australian Senate | ||||||||||||||||||||||||||||||||||
|---|---|---|---|---|---|---|---|---|---|---|---|---|---|---|---|---|---|---|---|---|---|---|---|---|---|---|---|---|---|---|---|---|---|---|
| ||||||||||||||||||||||||||||||||||
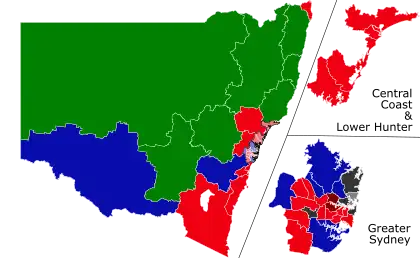 Results by electorate; Labor hold Labor gain Independent hold Independent gain Liberal hold National hold | ||||||||||||||||||||||||||||||||||

| Party | Votes | % | Swing (pp) | Seats | Change (seats) | |||
|---|---|---|---|---|---|---|---|---|
| Liberal Party of Australia | 1,316,134 | 28.30 | −4.49 | 9 | ||||
| National Party of Australia | 383,189 | 8.24 | −1.52 | 7 | ||||
| Liberal/National Coalition | 1,699,324 | 36.54 | −6.01 | 16 | ||||
| Australian Labor Party | 1,552,684 | 33.38 | −1.18 | 26 | ||||
| Australian Greens | 466,069 | 10.02 | +1.31 | 0 | ||||
| Pauline Hanson's One Nation | 224,965 | 4.84 | +3.53 | 0 | ||||
| United Australia Party | 183,174 | 3.94 | +0.56 | 0 | ||||
| Liberal Democratic Party | 96,898 | 2.08 | +1.65 | 0 | ||||
| Animal Justice Party | 16,979 | 0.37 | −0.29 | 0 | ||||
| Shooters, Fishers and Farmers Party | 14,727 | 0.32 | −0.08 | 0 | ||||
| Informed Medical Options Party | 14,171 | 0.30 | +0.27 | 0 | ||||
| Fusion | 8,520 | 0.18 | +0.18 | 0 | ||||
| Indigenous-Aboriginal Party of Australia | 7,326 | 0.16 | +0.16 | 0 | ||||
| Sustainable Australia | 3,423 | 0.07 | −0.53 | 0 | ||||
| Australian Federation Party | 2,647 | 0.06 | +0.06 | 0 | ||||
| Australian Citizens Party | 2,372 | 0.05 | +0.05 | 0 | ||||
| TNL | 1,704 | 0.04 | +0.04 | 0 | ||||
| Socialist Alliance | 1,518 | 0.03 | +0.03 | 0 | ||||
| Drew Pavlou Democratic Alliance | 1,208 | 0.03 | +0.03 | 0 | ||||
| Australian Democrats | 651 | 0.01 | +0.01 | 0 | ||||
| Independent | 351,620 | 7.56 | +2.94 | 5 | ||||
| Non Affiliated | 961 | 0.02 | +0.02 | 0 | ||||
| Total | 4,650,940 | 100.00 | 47 | |||||
| Invalid/blank votes | 308,644 | 6.22 | −0.79 | – | – | |||
| Turnout | 4,959,584 | 90.70 | −1.46 | – | – | |||
| Registered voters | 5,467,993 | – | – | – | – | |||
| Two-party-preferred vote | ||||||||
| Labor | 2,391,301 | 51.42 | +3.20 | |||||
| Liberal/National Coalition | 2,259,639 | 48.58 | −3.20 | |||||
| Source: AEC for both and | ||||||||
Victoria
| |||||||||||||||||||||||||||||||||||||||||||||
All 39 Victorian seats in the Australian House of Representatives and 6 seats in the Australian Senate | |||||||||||||||||||||||||||||||||||||||||||||
|---|---|---|---|---|---|---|---|---|---|---|---|---|---|---|---|---|---|---|---|---|---|---|---|---|---|---|---|---|---|---|---|---|---|---|---|---|---|---|---|---|---|---|---|---|---|
| |||||||||||||||||||||||||||||||||||||||||||||
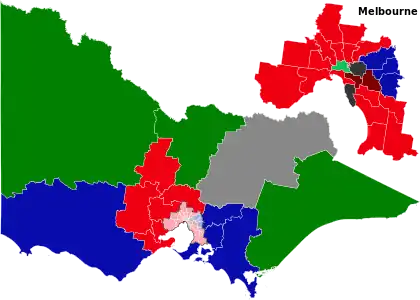 Results by electorate; Labor hold Labor gain Independent hold Independent gain Liberal hold National hold Greens hold | |||||||||||||||||||||||||||||||||||||||||||||
.png.webp)
| Party | Votes | % | Swing (pp) | Seats | Change (seats)[lower-alpha 6] | |||
|---|---|---|---|---|---|---|---|---|
| Liberal Party of Australia | 1,105,718 | 29.51 | −5.37 | 8 | ||||
| National Party of Australia | 133,562 | 3.57 | −0.13 | 3 | ||||
| Liberal/National Coalition | 1,239,280 | 33.08 | −5.18 | 11 | ||||
| Australian Labor Party | 1,230,842 | 32.85 | −4.01 | 24 | ||||
| Australian Greens | 514,893 | 13.74 | +1.85 | 1 | ||||
| United Australia Party | 177,745 | 4.74 | +1.10 | 0 | ||||
| Pauline Hanson's One Nation | 143,558 | 3.83 | +2.88 | 0 | ||||
| Liberal Democratic Party | 94,626 | 2.53 | +2.53 | 0 | ||||
| Animal Justice Party | 28,205 | 0.75 | −0.37 | 0 | ||||
| Victorian Socialists | 27,226 | 0.73 | +0.39 | 0 | ||||
| Australian Federation Party | 20,439 | 0.55 | +0.55 | 0 | ||||
| Derryn Hinch's Justice Party | 6,494 | 0.17 | −0.56 | 0 | ||||
| Socialist Alliance | 5,540 | 0.15 | +0.15 | 0 | ||||
| The Great Australian Party | 4,880 | 0.13 | +0.06 | 0 | ||||
| TNL | 2,405 | 0.06 | +0.06 | 0 | ||||
| Fusion | 2,238 | 0.06 | +0.06 | 0 | ||||
| Australian Citizens Party | 2,017 | 0.05 | −0.04 | 0 | ||||
| Reason Party | 1,458 | 0.04 | −0.20 | 0 | ||||
| Sustainable Australia | 443 | 0.01 | −0.17 | 0 | ||||
| Australian Values Party | 152 | 0.00 | +0.00 | 0 | ||||
| Independent | 243,992 | 6.51 | +2.59 | 3 | ||||
| Total | 3,746,433 | 100.00 | 39 | |||||
| Invalid/blank votes | 185,174 | 4.71 | +0.05 | – | – | |||
| Turnout | 3,931,607 | 90.59 | −2.03 | – | – | |||
| Registered voters | 4,339,960 | – | – | – | – | |||
| Two-party-preferred vote | ||||||||
| Labor | 2,023,880 | 54.58 | +1.44 | |||||
| Liberal/National Coalition | 1,684,528 | 45.42 | −1.44 | |||||
| Source: AEC for both votes and seats | ||||||||
Queensland
| |||||||||||||||||||||||||||||||||||||||||||||||||||||||||||||||||
All 30 Queensland seats in the Australian House of Representatives and 6 seats in the Australian Senate | |||||||||||||||||||||||||||||||||||||||||||||||||||||||||||||||||
|---|---|---|---|---|---|---|---|---|---|---|---|---|---|---|---|---|---|---|---|---|---|---|---|---|---|---|---|---|---|---|---|---|---|---|---|---|---|---|---|---|---|---|---|---|---|---|---|---|---|---|---|---|---|---|---|---|---|---|---|---|---|---|---|---|---|
| |||||||||||||||||||||||||||||||||||||||||||||||||||||||||||||||||
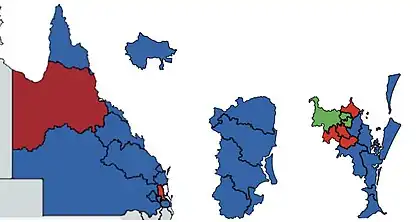 Results by electorate. | |||||||||||||||||||||||||||||||||||||||||||||||||||||||||||||||||

| Party | Votes | % | Swing (pp) | Seats | Change (seats) | |||
|---|---|---|---|---|---|---|---|---|
| Liberal National Party (Qld) | 1,172,515 | 39.64 | −4.06 | 21 | ||||
| Australian Labor Party | 811,069 | 27.42 | +0.74 | 5 | ||||
| Australian Greens | 382,900 | 12.94 | +2.62 | 3 | ||||
| Pauline Hanson's One Nation | 221,640 | 7.49 | −1.37 | 0 | ||||
| United Australia Party | 149,255 | 5.05 | +1.54 | 0 | ||||
| Katter's Australian Party | 55,863 | 1.89 | −0.58 | 1 | ||||
| Liberal Democratic Party | 28,737 | 0.97 | +0.52 | 0 | ||||
| Animal Justice Party | 24,813 | 0.84 | +0.40 | 0 | ||||
| Informed Medical Options Party | 10,894 | 0.37 | +0.37 | 0 | ||||
| Australian Federation Party | 8,195 | 0.28 | +0.28 | 0 | ||||
| The Great Australian Party | 7,775 | 0.26 | +0.26 | 0 | ||||
| Legalise Cannabis | 6,025 | 0.20 | +0.20 | 0 | ||||
| Australian Values Party | 5,470 | 0.18 | +0.18 | 0 | ||||
| Socialist Alliance | 3,729 | 0.13 | +0.08 | 0 | ||||
| Shooters, Fishers and Farmers Party | 3,695 | 0.12 | +0.12 | 0 | ||||
| TNL | 1,971 | 0.07 | +0.07 | 0 | ||||
| Fusion | 930 | 0.03 | +0.03 | 0 | ||||
| Australian Progressives | 606 | 0.02 | −0.01 | 0 | ||||
| Independent | 61,944 | 2.09 | +0.82 | 0 | ||||
| Total | 2,958,026 | 100.00 | – | 30 | ||||
| Invalid/blank votes | 128,732 | 4.17 | −0.78 | – | – | |||
| Turnout | 3,086,758 | 88.16 | –3.06 | – | – | |||
| Registered voters | 3,501,287 | – | – | – | – | |||
| Two-party-preferred vote | ||||||||
| Liberal National | 1,598,802 | 54.05 | –4.39 | – | – | |||
| Labor | 1,359,224 | 45.95 | +4.39 | – | – | |||
| Source: AEC for both votes and seats | ||||||||
Western Australia
| ||||||||||||||||||||||||||||||||||
All 15 Western Australian seats in the Australian House of Representatives and 6 (of 12) Western Australian seats in the Australian Senate | ||||||||||||||||||||||||||||||||||
|---|---|---|---|---|---|---|---|---|---|---|---|---|---|---|---|---|---|---|---|---|---|---|---|---|---|---|---|---|---|---|---|---|---|---|
| ||||||||||||||||||||||||||||||||||
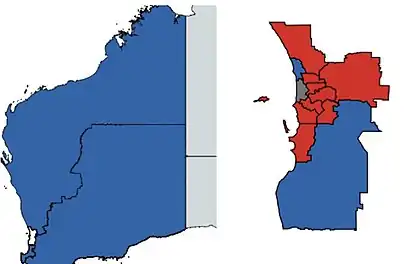 Results by electorate. | ||||||||||||||||||||||||||||||||||
| Party | Votes | % | Swing (pp) | Seats | Change (seats) | |||
|---|---|---|---|---|---|---|---|---|
| Labor | 542,667 | 36.84 | +7.04 | 9 | ||||
| Liberal | 503,254 | 34.16 | −9.63 | 5 | ||||
| National | 9,160 | 0.62 | −0.81 | 0 | ||||
| Coalition total | 512,414 | 34.78 | −10.44 | 5 | ||||
| Greens | 184,094 | 12.50 | +0.88 | 0 | ||||
| One Nation | 58,226 | 3.95 | −1.36 | 0 | ||||
| United Australia | 33,863 | 2.30 | +0.27 | 0 | ||||
| Western Australia | 33,263 | 2.26 | +0.46 | 0 | ||||
| Christians | 19,867 | 1.35 | −0.35 | 0 | ||||
| Great Australian | 16,553 | 1.12 | +1.06 | 0 | ||||
| Australian Federation | 15,920 | 1.08 | +1.08 | 0 | ||||
| Liberal Democrats | 12,897 | 0.88 | +0.88 | 0 | ||||
| Animal Justice | 5,524 | 0.37 | +0.28 | 0 | ||||
| Socialist Alliance | 1,184 | 0.08 | +0.01 | 0 | ||||
| Informed Medical Options | 785 | 0.05 | +0.05 | 0 | ||||
| Independents | 35,968 | 2.44 | +1.34 | 1 | ||||
| Total | 1,473,225 | 100.00 | – | 15 | ||||
| Invalid/blank votes | 86,057 | 5.52 | +0.08 | – | – | |||
| Turnout | 1,559,282 | 87.99 | −2.06 | – | – | |||
| Registered voters | 1,772,065 | – | – | – | – | |||
| Two-party-preferred vote | ||||||||
| Labor | 810,206 | 55.00 | +10.55 | |||||
| Liberal | 663,019 | 45.00 | −10.55 | |||||
| Source: AEC for both votes and seats | ||||||||
South Australia
| |||||||||||||||||||||||||||||||||||||||||||||
All 10 South Australian seats in the Australian House of Representatives and 6 seats in the Australian Senate | |||||||||||||||||||||||||||||||||||||||||||||
|---|---|---|---|---|---|---|---|---|---|---|---|---|---|---|---|---|---|---|---|---|---|---|---|---|---|---|---|---|---|---|---|---|---|---|---|---|---|---|---|---|---|---|---|---|---|
| |||||||||||||||||||||||||||||||||||||||||||||
 Results by electorate. | |||||||||||||||||||||||||||||||||||||||||||||
| Party | Votes | % | Swing | Seats | Change | |||
|---|---|---|---|---|---|---|---|---|
| Liberal | 387,664 | 35.31 | –5.26 | 3 | ||||
| National | 2,531 | 0.23 | –0.03 | 0 | ||||
| Liberal/National Coalition | 390,195 | 35.54 | −5.29 | 3 | ||||
| Labor | 378,329 | 34.46 | –0.92 | 6 | ||||
| Greens | 140,227 | 12.77 | +3.16 | 0 | ||||
| One Nation | 53,057 | 4.83 | +3.99 | 0 | ||||
| United Australia | 42,688 | 3.89 | –0.40 | 0 | ||||
| Centre Alliance | 36,500 | 3.32 | –1.06 | 1 | ||||
| Australian Federation | 10,354 | 0.94 | +0.94 | 0 | ||||
| Animal Justice | 7,158 | 0.65 | –2.13 | 0 | ||||
| Liberal Democrats | 5,248 | 0.48 | +0.48 | 0 | ||||
| Fusion | 1,631 | 0.15 | +0.15 | 0 | ||||
| Great Australian | 1,184 | 0.11 | +0.11 | 0 | ||||
| Democratic Alliance | 1,007 | 0.09 | +0.09 | 0 | ||||
| Progressives | 457 | 0.04 | –0.01 | 0 | ||||
| TNL | 251 | 0.02 | +0.02 | 0 | ||||
| Independents | 29,500 | 2.69 | +1.48 | 0 | ||||
| Total | 1,097,786 | 10 | ||||||
| Invalid/blank votes | 59,222 | 5.12 | +0.31 | – | – | |||
| Turnout | 1,157,008 | 91.07 | –2.00 | – | – | |||
| Registered voters | 1,270,400 | – | – | – | – | |||
| Two-party-preferred vote | ||||||||
| Labor | 592,512 | 53.97 | +3.26 | – | – | |||
| Liberal | 505,274 | 46.03 | –3.26 | – | – | |||
| Source: AEC for both votes and seats | ||||||||
Tasmania
| ||||||||||||||||||||||||||||||||||
All 5 Tasmanian seats in the Australian House of Representatives and 6 seats in the Australian Senate | ||||||||||||||||||||||||||||||||||
|---|---|---|---|---|---|---|---|---|---|---|---|---|---|---|---|---|---|---|---|---|---|---|---|---|---|---|---|---|---|---|---|---|---|---|
| ||||||||||||||||||||||||||||||||||
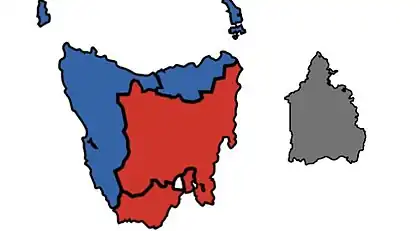 Results by electorate. | ||||||||||||||||||||||||||||||||||
| Party | Votes | % | Swing (pp) | Seats | Change (seats) | |||
|---|---|---|---|---|---|---|---|---|
| Liberal Party of Australia | 115,184 | 32.94 | +2.31 | 2 | ||||
| Australian Labor Party | 95,322 | 27.26 | −6.35 | 2 | ||||
| Australian Greens | 41,972 | 12.00 | +1.88 | 0 | ||||
| Jacqui Lambie Network | 23,730 | 6.79 | +6.79 | 0 | ||||
| Pauline Hanson's One Nation | 13,970 | 3.99 | +1.20 | 0 | ||||
| United Australia Party | 6,437 | 1.84 | −3.01 | 0 | ||||
| Liberal Democratic Party | 5,064 | 1.45 | +1.45 | 0 | ||||
| Animal Justice Party | 4,772 | 1.36 | +0.88 | 0 | ||||
| Local Party | 4,254 | 1.22 | +1.22 | 0 | ||||
| Independent | 38,993 | 11.50 | −1.84 | 1 | ||||
| Total | 349,698 | 5 | ||||||
| Invalid/blank votes | 21,734 | 5.85 | +1.46 | – | – | |||
| Turnout | 371,432 | 92.43 | –1.91 | – | – | |||
| Registered voters | 401,852 | – | – | – | – | |||
| Two-party-preferred vote | ||||||||
| Labor | 189,993 | 54.33 | −1.63 | – | – | |||
| Liberal | 159,705 | 45.67 | +1.63 | – | – | |||
| Source: AEC for both votes and seats | ||||||||
Territories
Australian Capital Territory
| ||||||||||||||||||||||||||||||||||
All 3 Australian Capital Territory seats in the Australian House of Representatives and all 2 seats in the Australian Senate | ||||||||||||||||||||||||||||||||||
|---|---|---|---|---|---|---|---|---|---|---|---|---|---|---|---|---|---|---|---|---|---|---|---|---|---|---|---|---|---|---|---|---|---|---|
| ||||||||||||||||||||||||||||||||||
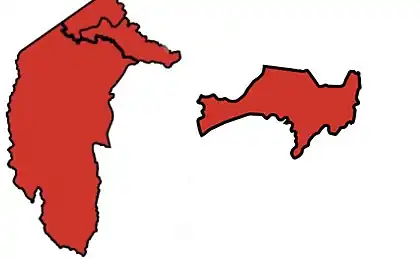 Results by electorate. | ||||||||||||||||||||||||||||||||||
| Party | Votes | % | Swing (pp) | Seats | Change (seats) | |||
|---|---|---|---|---|---|---|---|---|
| Australian Labor Party | 126,595 | 44.89 | +3.80 | 3 | ||||
| Liberal Party of Australia | 74,759 | 26.51 | −4.81 | 0 | ||||
| Australian Greens | 52,648 | 18.67 | +1.82 | 0 | ||||
| United Australia Party | 6,864 | 2.43 | −0.25 | 0 | ||||
| Pauline Hanson's One Nation | 6,630 | 2.35 | +2.35 | 0 | ||||
| Liberal Democratic Party | 1,706 | 0.60 | –0.35 | 0 | ||||
| Independent | 12,795 | 4.54 | +0.12 | 0 | ||||
| Total | 281,997 | 100.00 | 3 | |||||
| Invalid/blank votes | 7,116 | 2.46 | −1.03 | – | – | |||
| Turnout | 289,113 | 92.07 | –1.08 | – | – | |||
| Registered voters | 314,025 | – | – | – | – | |||
| Two-party-preferred vote | ||||||||
| Labor | 188,799 | 66.95 | +5.34 | – | – | |||
| Liberal | 93,198 | 33.05 | –5.34 | – | – | |||
| Source: AEC for both votes and seats | ||||||||
Northern Territory
| ||||||||||||||||||||||||||||||||||
All 2 Northern Territory seats in the Australian House of Representatives and all 2 seats in the Australian Senate | ||||||||||||||||||||||||||||||||||
|---|---|---|---|---|---|---|---|---|---|---|---|---|---|---|---|---|---|---|---|---|---|---|---|---|---|---|---|---|---|---|---|---|---|---|
| ||||||||||||||||||||||||||||||||||
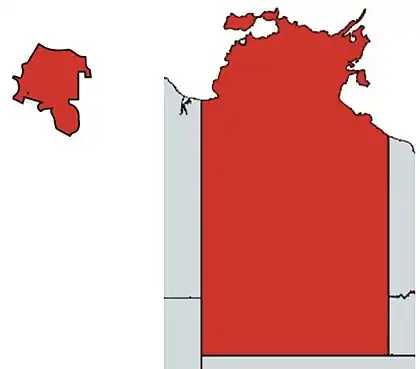 Results by electorate. | ||||||||||||||||||||||||||||||||||
| Party | Votes | % | Swing (pp) | Seats | Change (seats) | |||
|---|---|---|---|---|---|---|---|---|
| Australian Labor Party | 38,522 | 38.16 | −4.11 | 2 | ||||
| Country Liberal Party | 29,664 | 29.39 | −8.13 | 0 | ||||
| Australian Greens | 13,182 | 13.06 | +2.91 | 0 | ||||
| Liberal Democratic Party | 7,787 | 7.71 | +7.71 | 0 | ||||
| Pauline Hanson's One Nation | 5,418 | 5.37 | +5.37 | 0 | ||||
| United Australia Party | 4,510 | 4.47 | +1.62 | 0 | ||||
| Australian Citizens Party | 497 | 0.49 | +0.49 | 0 | ||||
| Independent | 1,357 | 1.34 | −3.30 | 0 | ||||
| Total | 100,937 | 100.00 | 2 | |||||
| Invalid/blank votes | 5,658 | 5.31 | +0.62 | – | – | |||
| Turnout | 106,595 | 73.08 | –4.86 | – | – | |||
| Registered voters | 145,851 | – | – | – | – | |||
| Two-party-preferred vote | ||||||||
| Labor | 56,065 | 55.54 | +1.34 | – | – | |||
| Liberal | 44,872 | 44.46 | –1.34 | – | – | |||
| Source: AEC for both votes and seats | ||||||||
Two party preferred preference flow
| Party | Coalition | Labor | |||||||
|---|---|---|---|---|---|---|---|---|---|
| Votes | % | ± | Votes | % | ± | ||||
| Greens | 257,566 | 14.34% | –3.45 | 1,538,419 | 85.66% | +3.45 | |||
| One Nation | 467,768 | 64.30% | –0.92 | 259,696 | 35.70% | +0.92 | |||
| United Australia Party | 373,988 | 61.86% | –3.36 | 230,548 | 38.14% | +3.36 | |||
| Liberal Democratic Party | 181,659 | 71.81% | –5.43 | 71,304 | 28.19% | +5.43 | |||
| Animal Justice Party | 31,736 | 36.29% | –2.13 | 55,715 | 63.71% | +2.13 | |||
| Australian Federation Party | 32,466 | 56.41% | — | 25,089 | 43.59% | — | |||
| Katter's Australian | 34,251 | 61.31% | –5.73 | 21,612 | 38.69% | +5.73 | |||
| Centre Alliance | 14,513 | 39.76% | +6.86 | 21,987 | 60.24% | –6.86 | |||
| Western Australia Party | 14,741 | 44.32% | –4.56 | 18,522 | 55.68% | +4.56 | |||
| The Great Australian Party | 15,891 | 52.29% | –0.78 | 14,501 | 47.71% | +0.78 | |||
| Victorian Socialists | 4,507 | 16.55% | +4.14 | 22,719 | 83.45% | –4.14 | |||
| Informed Medical Options Party | 13,896 | 53.76% | +17.37 | 11,954 | 46.24% | –17.37 | |||
| Jacqui Lambie Network | 9,709 | 40.91% | – | 14,021 | 59.09% | – | |||
| Australian Christians | 15,175 | 76.38% | –4.41 | 4,692 | 23.62% | +4.41 | |||
| Shooters, Fishers and Farmers Party | 10,798 | 58.61% | –0.45 | 7,624 | 41.39% | +0.45 | |||
| Fusion | 4,091 | 30.72% | –1.82 | 9,228 | 69.28% | +1.82 | |||
| Socialist Alliance | 3,035 | 25.35% | +5.05 | 8,936 | 74.65% | –5.05 | |||
| Indigenous-Aboriginal Party of Australia | 3,495 | 47.71% | – | 3,831 | 52.29% | – | |||
| Derryn Hinch's Justice Party | 3,128 | 48.17% | +1.93 | 3,366 | 51.83% | –1.93 | |||
| TNL | 2,268 | 35.82% | – | 4,063 | 64.18% | – | |||
| Legalise Cannabis | 2,574 | 42.72% | – | 3,451 | 57.28% | – | |||
| Australian Values Party | 3,076 | 54.71% | – | 2,546 | 45.29% | – | |||
| Australian Citizens Party | 2,171 | 44.43% | +18.01 | 2,715 | 55.57% | –18.01 | |||
| Local Party | 997 | 23.44% | – | 3,257 | 76.56% | – | |||
| Sustainable Australia | 1,351 | 34.95% | –11.06 | 2,515 | 65.05% | +11.06 | |||
| Drew Pavlou Democratic Alliance | 940 | 42.44% | – | 1,275 | 57.56% | – | |||
| Reason Party | 281 | 19.27% | –11.94 | 1,177 | 80.73% | +11.94 | |||
| Australian Progressives | 251 | 23.61% | –9.16 | 812 | 76.39% | +9.16 | |||
| Australian Democrats | 222 | 34.10% | +3.15 | 429 | 65.90% | –3.15 | |||
| Independents | 281,211 | 36.23% | –4.37 | 494,958 | 63.77% | +4.37 | |||
| Total | 14,659,042 | 100.00 | 151 | ||||||
| Two-party-preferred vote | |||||||||
| Labor | 7,642,161 | 52.13 | +3.66 | ||||||
| Liberal/National Coalition | 7,016,881 | 47.87 | −3.66 | ||||||
| Invalid/blank votes | 802,376 | 5.19 | –0.35 | – | – | ||||
| Turnout | 15,461,418 | 89.82 | –2.07 | – | – | ||||
| Registered voters | 17,213,433 | – | – | – | – | ||||
| Source: AEC for both votes | |||||||||
Analysis
The vast majority of electorates outside Tasmania swung to Labor. This is especially true for inner-city seats. The vast majority of inner-city seats held by the Liberal Party were won by either Labor, teal independents or the Greens.
Despite losing the two-party preferred vote both nationally and in every state except Queensland, the Coalition won the first preference vote nationally and in every state except Western Australia and the two territories. Nevertheless, both major parties had swings against them nationally and in all but four states and territories; Labor's vote increased in Queensland, Western Australia and the Australian Capital Territory, while the Liberal Party's vote increased in Tasmania. Tasmania was also the only state that swung to the Coalition on a two-party preferred vote. Outside Tasmania, the Coalition's vote dropped more than Labor's.
The Coalition's losses in seats were limited to the Liberal Party, as the National Party retained all of its seats, despite both Coalition parties having swings against them in the vast majority of seats.
On a two-party preferred basis, few electorates swung to the Coalition outside Victoria and Tasmania. These were the electorates of Calare, Fowler, Gilmore, Lindsay, Page, Parkes, Paterson and Whitlam in New South Wales; Herbert and Kennedy in Queensland; and Lingiari in the Northern Territory.
While teal independents contested in a number of Coalition-held seats in every state except Queensland (and not in the two territories), they were most successful in wealthy inner-city seats, usually held by Moderates, where they were elected on preferences (as the Liberal Party still and more first preference votes). The seats they gained were all from Liberals: Mackellar, North Sydney and Wentworth in Sydney, Goldstein and Kooyong in Melbourne and Curtin in Perth. These seats are all economically liberal, but environmentally progressive, which has previously seen the Greens finish ahead of Labor in these seats. Furthermore, teals held three other seats before the election (which they subsequently retained): Warringah in Sydney, Clark in Hobart and Indi in regional Victoria. The absence of teal candidates in Queensland may have boosted the Greens vote in inner-city Brisbane, where they won three seats (Brisbane and Ryan from the LNP and Griffith from Labor, which they won in addition to retaining the seat of Melbourne).
Swing table
| State/territory | TPP | ||
|---|---|---|---|
| ALP | LNP | Swing (to ALP) | |
| 66.95% | 33.05% | +5.34 | |
| 51.42% | 48.58% | +3.20 | |
| 55.54% | 44.46% | +1.34 | |
| 45.95% | 54.05% | +4.39 | |
| 53.97% | 46.03% | +3.26 | |
| 54.33% | 45.67% | –1.63 | |
| 54.83% | 45.17% | +1.64 | |
| 55.00% | 45.00% | +10.55 | |
Notes
- This party is a result of the merger between the Liberal and National Parties in Queensland in 2008. It is part of the Coalition, and its MPS sit in either the Liberal or National party rooms, meaning the LNP does not have its own federal leader. The party's leader in the Queensland Parliament, David Crisafulli, did not contest this election.
- In 2020 Katter officially handed leadership of the party to his son Robbie Katter, who sits in the Queensland Parliament and did not contest this election.
- Sharkie was the only candidate running for Centre Alliance in this election.
- 7 of the 10 elected independents were associated with the Teal independents movement, but they were elected as independents with no shared party or leader.
- 15 LNP MPs sit in the Liberal party room and 6 in the National party room
- Due to Victoria gaining an extra seat with the creation of the Division of Hawke, numbers of seats lost and gained do not add up.
References
- "House Party Representation Leading". Aec.gov.au. Retrieved 24 May 2022.
- "First preferences by party". Australian Electoral Commission. Retrieved 28 May 2022.
- "House Party Representation Leading". aec.gov.au. Retrieved 24 June 2022.
- "First preferences by party - VIC". Tally Room. Australian Electoral Commission. 27 May 2022. Retrieved 27 May 2022.
- "First preferences by party". Australian Electoral Commission. Retrieved 28 May 2022.
- "House Party Representation Leading". aec.gov.au. Retrieved 24 June 2022.
| ||
| Campaign |  | |
| Results | ||
| House of Representatives | |||
|---|---|---|---|
| Senate | |||
| By-elections | |||