Saint-Rambert-en-Bugey
Saint-Rambert-en-Bugey (French pronunciation: [sɛ̃ ʁɑ̃'bɛʁ ɑ̃ by'ʒɛ] ⓘ, literally Saint-Rambert in Bugey) is a commune in the Ain department in eastern France.
Saint-Rambert-en-Bugey | |
|---|---|
Commune | |
 | |
.svg.png.webp) Coat of arms | |
Location of Saint-Rambert-en-Bugey | |
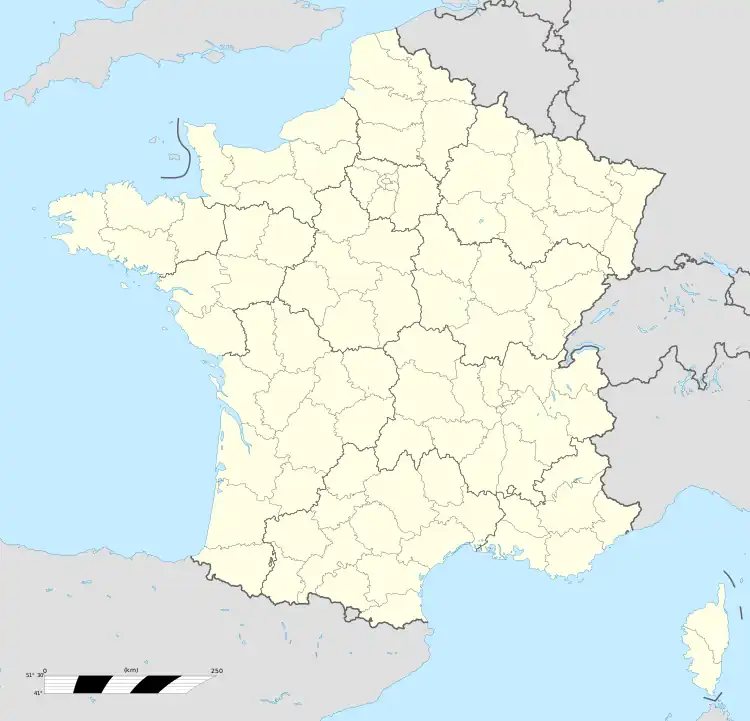 Saint-Rambert-en-Bugey 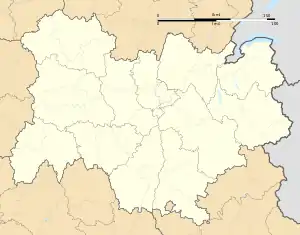 Saint-Rambert-en-Bugey | |
| Coordinates: 45°57′00″N 5°26′00″E | |
| Country | France |
| Region | Auvergne-Rhône-Alpes |
| Department | Ain |
| Arrondissement | Belley |
| Canton | Ambérieu-en-Bugey |
| Government | |
| • Mayor (2020–2026) | Gilbert Bouchon[1] |
| Area 1 | 28.55 km2 (11.02 sq mi) |
| Population | 2,172 |
| • Density | 76/km2 (200/sq mi) |
| Time zone | UTC+01:00 (CET) |
| • Summer (DST) | UTC+02:00 (CEST) |
| INSEE/Postal code | 01384 /01230 |
| Elevation | 271–819 m (889–2,687 ft) (avg. 290 m or 950 ft) |
| 1 French Land Register data, which excludes lakes, ponds, glaciers > 1 km2 (0.386 sq mi or 247 acres) and river estuaries. | |
History
The commune takes its name from St Rambert (or Ragnebert) who was assassinated here in the 7th century. The site soon became popular for pilgrimage and an influential abbey was built in the town.
Geography
The river Albarine flows southwest through the commune. Saint-Rambert-en-Bugey station has rail connections to Lyon, Ambérieu-en-Bugey and Chambéry.
Climate
Saint-Rambert-en-Bugey has a oceanic climate (Köppen climate classification Cfb). The average annual temperature in Saint-Rambert-en-Bugey is 11.4 °C (52.5 °F). The average annual rainfall is 1,512.4 mm (59.54 in) with November as the wettest month. The temperatures are highest on average in July, at around 20.4 °C (68.7 °F), and lowest in January, at around 2.6 °C (36.7 °F). The highest temperature ever recorded in Saint-Rambert-en-Bugey was 39.6 °C (103.3 °F) on 13 August 2003; the coldest temperature ever recorded was −17.0 °C (1.4 °F) on 5 February 2012.
| Climate data for Saint-Rambert-en-Bugey (1991–2020 averages, extremes 1991−2020) | |||||||||||||
|---|---|---|---|---|---|---|---|---|---|---|---|---|---|
| Month | Jan | Feb | Mar | Apr | May | Jun | Jul | Aug | Sep | Oct | Nov | Dec | Year |
| Record high °C (°F) | 16.2 (61.2) |
19.8 (67.6) |
24.3 (75.7) |
29.3 (84.7) |
33.2 (91.8) |
37.5 (99.5) |
39.3 (102.7) |
39.6 (103.3) |
33.0 (91.4) |
27.5 (81.5) |
23.5 (74.3) |
17.7 (63.9) |
39.6 (103.3) |
| Average high °C (°F) | 6.0 (42.8) |
8.2 (46.8) |
13.5 (56.3) |
17.4 (63.3) |
21.5 (70.7) |
25.3 (77.5) |
27.6 (81.7) |
27.2 (81.0) |
22.4 (72.3) |
17.1 (62.8) |
10.4 (50.7) |
6.2 (43.2) |
16.9 (62.4) |
| Daily mean °C (°F) | 2.6 (36.7) |
3.8 (38.8) |
7.5 (45.5) |
11.0 (51.8) |
14.9 (58.8) |
18.4 (65.1) |
20.4 (68.7) |
20.1 (68.2) |
16.1 (61.0) |
12.1 (53.8) |
6.7 (44.1) |
3.2 (37.8) |
11.4 (52.5) |
| Average low °C (°F) | −0.7 (30.7) |
−0.7 (30.7) |
1.6 (34.9) |
4.6 (40.3) |
8.4 (47.1) |
11.5 (52.7) |
13.2 (55.8) |
12.9 (55.2) |
9.8 (49.6) |
7.1 (44.8) |
2.9 (37.2) |
0.2 (32.4) |
5.9 (42.6) |
| Record low °C (°F) | −14.5 (5.9) |
−17.0 (1.4) |
−15.5 (4.1) |
−5.0 (23.0) |
−1.2 (29.8) |
1.3 (34.3) |
4.0 (39.2) |
3.6 (38.5) |
0.0 (32.0) |
−6.0 (21.2) |
−10.0 (14.0) |
−16.0 (3.2) |
−17.0 (1.4) |
| Average precipitation mm (inches) | 134.0 (5.28) |
114.0 (4.49) |
112.1 (4.41) |
123.0 (4.84) |
134.7 (5.30) |
104.8 (4.13) |
107.6 (4.24) |
98.5 (3.88) |
128.3 (5.05) |
151.3 (5.96) |
159.4 (6.28) |
144.7 (5.70) |
1,512.4 (59.54) |
| Average precipitation days (≥ 1.0 mm) | 12.4 | 10.7 | 11.6 | 10.8 | 12.3 | 10.0 | 9.1 | 8.5 | 9.3 | 12.2 | 12.2 | 13.3 | 132.3 |
| Source: Meteociel[3] | |||||||||||||
Population
|
| ||||||||||||||||||||||||||||||||||||||||||||||||||||||||||||||||||||||||||||||||||||||||||||||||||||||||||||||||||
| Source: EHESS[4] and INSEE (1968-2017)[5] | |||||||||||||||||||||||||||||||||||||||||||||||||||||||||||||||||||||||||||||||||||||||||||||||||||||||||||||||||||
See also
References
- "Répertoire national des élus: les maires". data.gouv.fr, Plateforme ouverte des données publiques françaises (in French). 2 December 2020.
- "Populations légales 2020". The National Institute of Statistics and Economic Studies. 29 December 2022.
- "Normales et records pour Saint Rambert en Bugey (01)". Meteociel. Retrieved 20 August 2022.
- Des villages de Cassini aux communes d'aujourd'hui: Commune data sheet Saint-Rambert-en-Bugey, EHESS (in French).
- Population en historique depuis 1968, INSEE
External links