Statistics of the COVID-19 pandemic in the United States
The CDC publishes official numbers of COVID-19 cases in the United States. The CDC estimates that, between February 2020 and September 2021, only 1 in 1.3 COVID-19 deaths were attributed to COVID-19.[2] The true COVID-19 death toll in the United States would therefore be higher than official reports, as modeled by a paper published in The Lancet Regional Health – Americas.[3] One way to estimate COVID-19 deaths that includes unconfirmed cases is to use the excess mortality, which is the overall number of deaths that exceed what would normally be expected.[4] From March 1, 2020, through the end of 2020, there were 522,368 excess deaths in the United States, or 22.9% more deaths than would have been expected in that time period.[5]

In February 2020, at the beginning of the pandemic, a shortage of tests made it impossible to confirm all possible COVID-19 cases[6] and resulting deaths, so the early numbers were likely undercounts.[7][8][9][10]
The following numbers are based on CDC data, which is incomplete.
Measuring case and mortality rates

| Location[lower-roman 1] | Cases[lower-roman 2] | Deaths | Recoveries[lower-roman 3] | Hospital[lower-roman 4] | Ref. | |
|---|---|---|---|---|---|---|
| 56 / 56 | 96,640,059 | 1,059,346 | — | — | ||
| Alabama | 1,528,739 | 20,505 | 275,245 | 45,250 | [11] | |
| Alaska | 284,076 | 1,356 | 7,165 | 1,260 | [12] | |
| American Samoa | 8,250 | 34 | 3 | — | [13] | |
| Arizona | 2,277,635 | 31,455 | — | 57,072 | [14] | |
| Arkansas | 954,822 | 12,334 | 306,382 | 14,617 | [15] | |
| California | 11,284,337 | 96,068 | — | — | [16] | |
| Colorado | 1,661,645 | 13,354 | — | 23,293 | [17] | |
| Connecticut | 903,688 | 11,402 | — | 12,257 | [18][19] | |
| Delaware | 310,699 | 3,121 | 18,371 | — | [20] | |
| District of Columbia | 168,796 | 1,392 | 28,532 | — | [21] | |
| Florida[lower-roman 5] | 7,137,526 | 81,865 | — | 78,472 | [22] | |
| Georgia | 2,913,382 | 40,448 | — | 55,167 | [23] | |
| Guam | 58,647 | 401 | 7,377 | — | [24] | |
| Hawaii | 349,598 | 1,687 | 11,385 | 2,196 | [25] | |
| Idaho | 497,728 | 5,198 | 92,573 | 7,007 | [26][27] | |
| Illinois | 3,779,983 | 39,802 | — | — | [28] | |
| Indiana | 1,925,645 | 24,748 | 1,728,475 | 148,052 | [29][30] | |
| Iowa | 859,632 | 10,125 | 286,309 | — | [31] | |
| Kansas | 883,063 | 9,590 | — | 9,103 | [32] | |
| Kentucky | 1,599,943 | 17,162 | 47,067 | 18,768 | [33][34] | |
| Louisiana | 1,458,706 | 18,127 | 396,834 | — | [35] | |
| Maine | 293,141 | 2,621 | 12,772 | 1,511 | [36] | |
| Maryland | 1,258,064 | 15,464 | — | 34,577 | [37] | |
| Massachusetts | 2,060,884 | 21,771 | 477,796 | 19,176 | [38][39] | |
| Michigan | 2,861,595 | 38,919 | 2,747,446 | — | [40] | |
| Minnesota | 1,670,765 | 13,695 | 1,447,550 | 63,295 | [41] | |
| Mississippi | 930,438 | 12,945 | 273,437 | 9,012 | [42] | |
| Missouri | 1,655,669 | 21,564 | — | — | [43] | |
| Montana | 311,830 | 3,555 | 260,525 | 11,589 | [44] | |
| Nebraska | 539,389 | 4,552 | 142,336 | 6,048 | [45] | |
| Nevada | 849,745 | 11,531 | — | — | [46] | |
| New Hampshire | 352,870 | 2,713 | 70,040 | 1,095 | [47] | |
| New Jersey | 2,763,340 | 34,805 | — | 63,190 | [48] | |
| New Mexico | 621,483 | 8,599 | 135,608 | 12,989 | [49] | |
| New York | 6,162,077 | 71,411 | 150,100 | 89,995 | [50][51] | |
| North Carolina | 3,221,966 | 26,889 | 2,640,452 | — | [52][53] | |
| North Dakota | 270,288 | 2,383 | 97,286 | 3,859 | [54] | |
| Northern Mariana Islands | 13,171 | 40 | 29 | 4 | [55] | |
| Ohio | 3,153,743 | 39,950 | 2,640,920 | 115,481 | [56] | |
| Oklahoma | 1,203,469 | 14,924 | 401,945 | 23,700 | [57] | |
| Oregon | 902,319 | 8,622 | — | 8,457 | [58] | |
| Pennsylvania | 3,280,190 | 47,442 | 816,884 | — | [59] | |
| Puerto Rico | 964,435 | 5,193 | — | — | [60] | |
| Rhode Island | 406,546 | 3,674 | — | 8,835 | [61] | |
| South Carolina | 1,715,434 | 18,468 | — | — | [62] | |
| South Dakota | 262,837 | 3,046 | 107,745 | 6,548 | [63] | |
| Tennessee | 2,348,731 | 27,980 | 738,731 | 18,311 | [64] | |
| Texas | 7,893,859 | 89,375 | 4,260,877[lower-roman 6] | — | [65] | |
| US Virgin Islands | 23,233 | 123 | 2,483 | — | [66] | |
| Utah | 1,040,147 | 5,028 | 346,157 | 14,520 | [67] | |
| Vermont | 133,252 | 698 | 34,184 | — | [68] | |
| Virginia | 2,100,475 | 22,001 | — | 41,373 | [69][70] | |
| Washington | 1,825,841 | 14,430 | — | 19,110 | [71] | |
| West Virginia | 603,583 | 7,455 | 119,337 | — | [72] | |
| Wisconsin | 1,878,404 | 15,324 | 545,562 | 25,838 | [73] | |
| Wyoming | 177,635 | 1,904 | 52,688 | 1,373 | [74] | |
| Updated: October 13, 2022 · History of cases: United States | ||||||
| ||||||
In early 2020, deaths from all causes exceeded the seasonal average,[75] and data from early 2020 suggest additional deaths that were not counted in official reported coronavirus mortality statistics.[76] Until February 28, 2020, CDC testing protocols allowed tests only for people who had traveled to China.[77] In most U.S. locations, testing for some time was performed only on symptomatic people with a history of travel to Wuhan or with close contact to such people.[78][79][80] The numbers were reported every Monday, Wednesday, and Friday and were split into categories: individual travelers, people who contracted the disease from other people within the U.S., and repatriated citizens who returned to the U.S. from crisis locations, such as Wuhan, where the disease originated, and the cruise ship Diamond Princess.[81]
By March 26, 2020, the United States, with the world's third-largest population, surpassed China and Italy as the country with the world's highest number of confirmed cases.[82] By April 25, the U.S. had more than 905,000 confirmed coronavirus cases and nearly 52,000 deaths, giving it a mortality rate around 5.7 percent. (In comparison, Spain's mortality rate was 10.2 percent and Italy's was 13.5 percent.)[83][84]
In April 2020, more than 10,000 American deaths had occurred in nursing homes. Most nursing homes did not have easy access to testing, making the actual number unknown.[85] President Trump established a Coronavirus Commission for Safety and Quality in Nursing Homes.[86][87] Subsequently, a number of states including Maryland[88] and New Jersey[89] reported their own estimates of deaths at nursing homes, ranging from twenty to fifty percent of the states' total deaths. A PNAS report in September 2020 confirmed that the virus is much more dangerous for the elderly than the young, noting that about 70% of all U.S. COVID-19 deaths had occurred to those over the age of 70.[90]
As of early August 2020, among the 45 countries that had over 50,000 cases, the U.S. had the eighth highest number of deaths per-capita. Its case fatality ratio, however, was significantly better where it ranked 24th in the world, with 3.3% of its cases resulting in death.[91] Several studies suggested that the number of infections was far higher than officially reported, and thus that the infection fatality rate was far lower than the case fatality rate.[92][93]
The CDC estimates that 40% of people infected never show symptoms (i.e. are asymptomatic),[94] although there is a 75% chance they can still spread the disease. And while children have a lower risk of becoming ill or dying, the CDC warns that they can still function as asymptomatic carriers and transmit the virus to adults.[94] The American Academy of Pediatrics's weekly report[95] from when states started reporting to September 17, 2020, tracked 587,948 child COVID-19 cases, 5,016 child hospitalizations, and 109 child deaths.[96]
Epidemiologists depend on accurate reporting of cases and deaths to advise government response,[97] and some have questioned the reliability of the numbers of confirmed cases.[98] Rates differ among U.S. states, and there are also racial and economic disparities.[99][100][101] After a group of epidemiologists requested revisions in how the CDC counts cases and deaths, the CDC in mid-April 2020 updated its guidance for counting COVID-19 cases and deaths to recommend that U.S. states report both confirmed and probable ones, though the decision is left to each state.[102]
On September 25, 2020, The Lancet published the largest study at the time to measure COVID-19 antibody levels in the US population, finding that less than ten percent of the U.S. population had been exposed.[103][104][105] The study was published at a time when, according to Newsweek, "some U.S. officials have floated the concept of herd immunity as a possible strategy to manage the national outbreak,"[106] and according to the lead author of the study, Stanford Center for Tubulointerstitial Kidney Disease director Shuchi Anand, "this study does not support that there is herd immunity."[107] The research also uncovered racial and economic disparities in populations with COVID-19 antibodies[108][99] and highlighted the need for public health intervention to address the disparities.[100][101] At the time of the publication of the study, Anand announced that researchers would monitor the study participants for months to help determine the effectiveness of COVID-19 mitigation tactics.[106][108][104]
As of May 2021, the Centers for Disease Control estimated that there had been approximately 120 million infections in the United States.[109]
According to the Center for Systems Science and Engineering (CSSE) at Johns Hopkins University as of 19:21 Eastern Standard Time (EST) on 7 August 2021, the total COVID-19 cases in the US has crossed the 35.73 million mark, with the death toll reaching 616,712.[110]
Progression charts
New daily cases
Number of new daily cases, with a seven-day centered moving average:[111]
Deaths per day
Number of new daily deaths attributed to COVID-19, with a seven-day centered moving average:[111]
Weekly all-cause deaths
Weekly predicted deaths, non-COVID excess, and COVID-related excess deaths in the U.S. based on CDC data as of October 28, 2022 which is "Predicted (weighted)" (rather than tabulated) and commonly takes 60 days to fully collate.[112] As such, the data are split and the fields indicated by (*) are not confirmed, including both the 60-day window and any data from the CDC that had numerical inconsistencies (e.g. predicted + excess ≠ observed.) Also, key actions and milestones in the progression of the outbreak are annotated, selectively drawn from COVID-19 pandemic in the United States: Timeline.
Hospitalizations
Daily hospital and ICU occupancy numbers, as of October 16, 2022:[113]
Deaths by age
Number of COVID-19 deaths by age as of October 12, 2022:[114][115]
| Age group | Death count | % of deaths |
|---|---|---|
| All ages | 1,058,219 | 100% |
| Under 1y | 361 | <0.1% |
| 1-4y | 193 | <0.1% |
| 5-14y | 415 | <0.1% |
| 15-24y | 2,826 | 0.3% |
| 25-34y | 11,741 | 1% |
| 35-44y | 28,852 | 3% |
| 45-54y | 68,854 | 7% |
| 55-64y | 152,612 | 15% |
| 65-74y | 240,714 | 23% |
| 75-84y | 273,996 | 26% |
| 85y and over | 277,655 | 26% |
Deaths by sex
Number of COVID-19 deaths by sex and age as of October 12, 2022:[116]
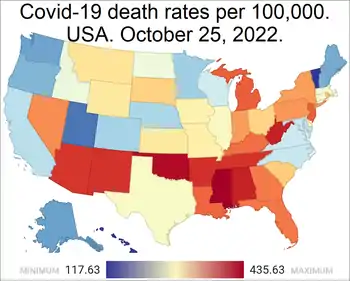
Deaths by state
COVID-19 deaths per million of the populations of each state, along with the District of Columbia and Puerto Rico,[117] as of September 14, 2022:
Vaccine distribution
Vaccinations in the U.S. per day:[113]
Cumulative vaccine doses administered in the U.S.[113]
Number of U.S. positive test individuals by state over time
Data for all state charts sourced from the NY Times COVID Data, as of October 1, 2022.[111] (This reference tends to include confirmed and suspected cases. This leads to some disparity with other sources).
> 2,000,000 positive test individuals
1,000,000–2,000,000 positive test individuals
400,000–1,000,000 positive test individuals
<400,000 positive test individuals
Death projections
On March 31, 2020, the CDC projected that eventually 100,000–240,000 Americans would die of coronavirus.[118] The lower end of the estimate was reached within two months after the CDC made its projection,[119] and the upper end was surpassed in November 2020.[120]
The CDC uses an ensemble forecast, meaning it receives predictions from multiple sources and aggregates them to make its own forecast. As of December 2020, the CDC included 37 modeling groups in its ensemble forecast and was predicting the death toll 4 weeks in advance.[121]
Examples:
- At the end of May 2020, the CDC correctly projected the death toll would surpass 115,000 by June 20.[122][123]
- At the end of July 2020, the CDC correctly projected the death toll would surpass 168,000 by August 22.[124]
- In mid-October 2020, the CDC correctly projected the death toll would reach 230,000–250,000 by mid-November.[124]
In mid-February 2021, when the death toll had already reached 470,000,[125] the IHME projected that the death toll would reach 600,000 by June 1.[126] However, the death rate dropped during this time period and the total death toll on June 1 was not as high as expected, having reached only about 592,000.[127] The total of 600,000 was reached two weeks later.[128]
In mid-September 2021, when the death toll had already reached 670,000, the IHME projected that the death toll would reach 775,000 by the end of the year.[129] That number was reached by the end of November 2021.[130]
On January 12, 2022, when the death toll had already reached 842,000, a CDC ensemble forecast predicted that 62,000 people would die over the next four weeks.[131]
Comparisons
Epidemics of similar size (the number is the U.S. death toll):
- HIV/AIDS in the United States: 700,000 as of 2018[132]
- 1918 Spanish Flu: 675,000[133]
Other large epidemics:
- 1957–1958 influenza pandemic: 116,000[133]
- 1968 Hong Kong flu: 100,000[133]
References
- COVID-19 Deaths per 100K. U.S. News & World Report. Run your cursor over the map to see the dates and data for each state. "The data on this page is courtesy of USAFacts – a nonprofit, nonpartisan civic initiative – and includes information from the Centers for Disease Control and Prevention and state and local health departments. See a detailed methodology at the USAFacts website."
- CDC (February 11, 2020). "Cases, Data, and Surveillance". Centers for Disease Control and Prevention. Retrieved December 19, 2021.
{{cite web}}: CS1 maint: url-status (link) - Iuliano, A. Danielle; Chang, Howard H.; Patel, Neha N.; Threlkel, Ryan; Kniss, Krista; Reich, Jeremy; Steele, Molly; Hall, Aron J.; Fry, Alicia M.; Reed, Carrie (July 13, 2021). "Estimating Under-recognized COVID-19 Deaths, United States, March 2020-May 2021 using an Excess Mortality Modelling Approach". The Lancet Regional Health – Americas. 1: 100019. doi:10.1016/j.lana.2021.100019. ISSN 2667-193X. PMC 8275579. PMID 34386789.
- "Excess Deaths Associated with COVID-19". Centers for Disease Control and Prevention—National Center for Health Statistics. Retrieved July 21, 2020.
- Woolf, Steven H.; Chapman, Derek A.; Sabo, Roy T. (April 2, 2021). "Excess Deaths From COVID-19 and Other Causes in the US, March 1, 2020, to January 2, 2021". JAMA. 325 (17): 1786. doi:10.1001/jama.2021.5199. PMC 8019132. PMID 33797550. S2CID 232763669. Retrieved August 20, 2021.
{{cite journal}}: CS1 maint: url-status (link) - Multiple sources:
- Eastwood, Joel; Overberg, Paul; Barry, Rob (April 4, 2020). "Why We Don't Know How Many Americans Are Infected With Coronavirus—and Might Never Know". The Wall Street Journal.
- "Lack of testing clouds virus picture on the North Coast | Coronavirus". dailyastorian.com. April 8, 2020. Retrieved April 27, 2020.
- "How Many People in the United States Actually Have COVID-19?". Healthline. March 18, 2020.
- Bosman, Julie (April 11, 2020). "Official Counts Understate the U.S. Coronavirus Death Toll—The New York Times". The New York Times. Retrieved April 27, 2020.
- "US coronavirus map: Tracking the United States outbreak". Usatoday.com. January 28, 2020. Retrieved April 27, 2020.
- Roberts, Jeff J. (April 3, 2020). "Can the private sector provide better coronavirus data? Experts are skeptical". Fortune. Retrieved April 10, 2020.
Confirmed coronavirus cases in the U.S. crossed 200,000 on Thursday, but experts agree the actual number of infected people is much higher. The lack of reliable data—a persistent problem since the pandemic began—has made it impossible to determine the actual size of the outbreak, hampering the U.S. response.
- Myer, Robinson; Madrigal, Alexis (April 16, 2020). "A New Statistic Reveals Why America's COVID-19 Numbers Are Flat". The Atlantic. Retrieved April 19, 2020.
- Kliff, Sarah; Bosman, Julie (April 5, 2020). "Official Counts Understate the U.S. Coronavirus Death Toll". The New York Times. Retrieved April 5, 2020.
- Abdelmalek, Mark; Margolin, Josh; Katersky, Aaron; David, Eden (April 7, 2020). "Coronavirus death toll in US likely worse than numbers say". ABC News. Retrieved April 10, 2020.
- Brown, Emma; Reinhard, Beth; Davis, Aaron C. (April 5, 2020). "Coronavirus death toll: Americans are almost certainly dying of covid-19 but being left out of the official count". The Washington Post. Retrieved April 10, 2020.
- Swan, Jonathan; Baker, Sam (May 6, 2020). "Trump and some top aides question the accuracy of virus death toll". Axios.
- "Alabama's COVID-19 Data and Surveillance Dashboard". Alabama Department of Public Health. Retrieved February 23, 2021.
- "COVID-19: Case Counts". Alaska Department of Health and Social Services. December 24, 2020. Retrieved February 23, 2020.
- "Covid 19 coronavirus: Samoan officials on alert after three sailors test positive". The New Zealand Herald. November 9, 2020. Archived from the original on November 9, 2020. Retrieved December 1, 2020.
- "ADHS - Data Dashboard". Arizona Department of Health Services. February 13, 2021. Retrieved February 13, 2021.
- "COVID-19 Arkansas Department of Health". December 12, 2020. Retrieved February 23, 2020.
- "COVID-19". California Department of Public Health. December 21, 2021. Retrieved December 21, 2021.
- "Case data | Colorado COVID-19 Updates". January 28, 2021. Retrieved February 23, 2021.
- "Connecticut COVID-19 Response". State of Connecticut. December 12, 2020. Retrieved February 23, 2020.
- "Daily Data Report for Connecticut" (PDF). State of Connecticut. December 24, 2020. Retrieved February 23, 2020.
- "Coronavirus Disease (COVID-19)". Delaware Division of Public Health, State of Delaware's Latest Status. December 24, 2020. Retrieved February 23, 2020.
- "Coronavirus Data". coronavirus.dc.gov. December 24, 2020. Retrieved February 23, 2020.
- "Florida COVID-19 Data". experience.arcgis.com. Retrieved December 21, 2021.
- "Georgia - COVID-19 Overview - Johns Hopkins". Johns Hopkins Coronavirus Resource Center. Retrieved December 21, 2021.
- "COVID-19". dphss.guam.gov. December 12, 2020. Retrieved February 23, 2020.
- "Current Situation in Hawaii". health.hawaii.gov. Retrieved February 2, 2021.
{{cite web}}: CS1 maint: url-status (link) - "Idaho Official Resources for the Novel Coronavirus (COVID-19)". Idaho Official Government Website. Retrieved February 2, 2021.
{{cite web}}: CS1 maint: url-status (link) - "COVID-19 in Idaho". public.tableau.com. Retrieved February 2, 2021.
{{cite web}}: CS1 maint: url-status (link) - "Coronavirus Disease 2019 (COVID-19), Illinois Test Results". Illinois Department of Public Health. Retrieved December 21, 2021.
- "ISDH - Novel Coronavirus: Novel Coronavirus (COVID-19)". Retrieved February 13, 2021.
{{cite web}}: CS1 maint: url-status (link) - "COVID-19 Dashboard". Regenstrief Institute. February 25, 2021. Retrieved February 25, 2021.
- "Novel-Coronavirus - COVID-19-Reporting". idph.iowa.gov. May 1, 2021. Retrieved May 1, 2021.
- "COVID-19 Cases in Kansas | KDHE COVID-19". coronavirus.kdheks.gov. December 24, 2020. Retrieved February 23, 2020.
- "kycovid19.ky.gov". govstatus.egov.com. January 28, 2021. Retrieved February 23, 2021.
- "COVID-19 Daily Report" (PDF). chfs.ky.gov. January 28, 2021. Retrieved February 23, 2021.
- "Coronavirus (COVID-19) | Department of Health | State of Louisiana". ldh.la.gov. January 28, 2021. Retrieved February 23, 2021.
- "Novel Coronavirus 2019 (COVID-19)". Maine Center for Disease Control & Prevention: Division of Disease Surveillance. December 24, 2020. Retrieved February 23, 2020.
- "Coronavirus – Maryland Department of Health". coronavirus.maryland.gov. January 28, 2021. Retrieved February 23, 2021.
- "COVID-19 Daily Dashboard". mass.gov. Commonwealth of Massachusetts. January 28, 2021. Retrieved February 23, 2021.
- "COVID-19 Weekly Public Health Report". mass.gov. January 21, 2021. Retrieved February 23, 2021.
- "Coronavirus - Michigan Data". Worldometers. October 31, 2021. Retrieved February 13, 2021.
- "Situation Update for COVID-19". Minnesota Department of Health. January 17, 2021. Retrieved February 23, 2021.
- "Coronavirus Disease 2019 (COVID-19)". Mississippi State Department of Health. December 24, 2020. Retrieved February 23, 2020.
- "COVID-19 Outbreak". Missouri Department of Health and Senior Services. January 28, 2021. Retrieved February 23, 2021.
- "Montana Response: COVID-19 - Coronavirus - Global, National, and State Information Resources". Retrieved February 23, 2020.
- "Coronavirus COVID-19 Nebraska Cases by the Nebraska Department of Health and Human Services (DHHS)". nebraska.maps.arcgis.com. December 24, 2020. Retrieved February 23, 2020.
- "COVID-19 (Coronavirus)". State of Nevada Department of Health and Human Services: Office of Analytics. December 24, 2020. Retrieved February 23, 2020.
- "Novel Coronavirus 2019 (COVID-19)". New Hampshire Department of Health and Human Services. December 24, 2020. Retrieved February 23, 2020.
- "New Jersey COVID-19 Information Hub". February 13, 2021. Retrieved February 13, 2021.
- "NMDOH COVID-19 Public Dashboard". Retrieved February 19, 2021.
- Times, The New York (April 1, 2020). "New York Coronavirus Map and Case Count". The New York Times. ISSN 0362-4331. Retrieved December 21, 2021.
- "The COVID Tracking Project". February 23, 2021. Retrieved February 25, 2021.
- "NC DHHS COVID-19: Cases". February 12, 2021. Retrieved February 13, 2021.
- "COVID-19 Recovery Report (North Carolina)" (PDF). February 8, 2021. Retrieved February 13, 2021.
- "North Dakota Coronavirus Cases". North Dakota Department of Health. December 24, 2020. Retrieved February 23, 2020.
- "Information about COVID-19". February 1, 2021. Retrieved February 2, 2021.
- "Ohio Department of Health". coronavirus.ohio.gov. February 13, 2021. Retrieved February 13, 2020.
- "COVID-19 | Oklahoma State Department of Health". coronavirus.health.ok.gov. January 28, 2021. Retrieved February 23, 2021.
- "Oregon Health Authority : Emerging Respiratory Infections: COVID-19 : Diseases A to Z : State of Oregon". oregon.gov. December 24, 2020. Retrieved February 23, 2020.
- "Cases". health.pa.gov. Pennsylvania Department of Health. Retrieved February 13, 2021.
- "Departamento De Salud" (in Spanish). December 12, 2020. Retrieved February 23, 2020.
- "Rhode Island COVID-19 Response Data". RI Department of Health. December 24, 2020. Retrieved February 23, 2020.
- "Testing & SC Data (COVID-19) | SCDHEC". scdhec.gov. January 28, 2021. Retrieved February 23, 2021.
- "Novel Coronavirus (COVID-19) Updates and Information". South Dakota Department of Health. December 12, 2020. Retrieved February 23, 2020.
- "Coronavirus Disease (COVID-19)". Tennessee Department of Health. February 13, 2021. Retrieved February 13, 2021.
- "COVID-19 in Texas (Dashboard)". txdshs.maps.arcgis.com. Texas DSHS. Retrieved December 20, 2021.
- "Coronavirus Disease 2019 (COVID-19)". January 11, 2021. Retrieved February 23, 2021.
- "Latest Information". December 24, 2020. Retrieved February 23, 2020.
- "Case Dashboard Vermont Department of Health". Vermont Department of Health. January 8, 2021. Retrieved February 23, 2021.
- "Coronavirus". Virginia Department of Health. January 28, 2021. Retrieved February 23, 2021.
- "Virginia Hospital COVID-19 Dashboard". www.vhha.com. Virginia Hospital & Healthcare Association. January 28, 2021. Retrieved February 23, 2021.
- "2019 Novel Coronavirus Outbreak (COVID-19)". Washington Department of Health. December 24, 2020. Retrieved February 23, 2020.
- "Coronavirus Disease 2019 (COVID-19)". West Virginia Department of Health & Human Resources. December 24, 2020. Retrieved February 23, 2020.
- "2019 Novel Coronavirus Outbreak (COVID-19)". Wisconsin Department of Health Services. February 13, 2021. Retrieved February 13, 2021.
- "COVID-19 Map and Statistics". Wyoming Department of Health. December 24, 2020. Retrieved February 23, 2020.
- Wu J, McCann A, Katz J, Peltier E. "28,000 Missing Deaths: Tracking the True Toll of the Coronavirus Crisis". The New York Times. ISSN 0362-4331. Retrieved April 22, 2020.
- Katz, Josh; Lu, Denise; Sanger-Katz, Margot (April 28, 2020). "U.S. Coronavirus Death Toll Is Far Higher Than Reported, C.D.C. Data Suggests". The New York Times. Retrieved April 29, 2020.
- Moon, Sarah; Yan, Holly; Christensen, Jen; Maxouris, Christina. "The CDC has changed its criteria for testing patients for coronavirus after the first case of unknown origin was confirmed". CNN. Retrieved March 12, 2020.
- Madrigal, Robinson Meyer, Alexis C. (March 6, 2020). "Exclusive: The Strongest Evidence Yet That America Is Botching Coronavirus Testing". The Atlantic. Retrieved July 23, 2020.
- "Persons Evaluated for 2019 Novel Coronavirus—US, Jan 2020". Medscape. Retrieved March 12, 2020.
- McFall-Johnsen, Morgan. "A New York City man wasn't tested for the coronavirus even though he had symptoms and had gone to Japan. It highlights the troublingly limited scope of US testing". Business Insider. Retrieved March 12, 2020.
- "International Locations with Confirmed COVID-19 Cases". Centers for Disease Control and Prevention. February 11, 2020. Archived from the original on February 22, 2020. Retrieved February 18, 2020.
- Nicole Chavez; Holly Yan; Madeline Holcombe. "US has more known cases of coronavirus than any other country". CNN. Retrieved June 14, 2020.
- "U.S. Has One of the Lowest Coronavirus Mortality Rates Worldwide but Highest Number of Deaths". Newsweek. April 21, 2020.
- "Coronavirus (COVID-19) deaths worldwide per one million population as of November 20, 2020, by country". Statista. November 20, 2020. Retrieved November 20, 2020.
- "10,000 deaths: Ravaged nursing homes plead for more testing". KMGH. Associated Press. April 23, 2020. Archived from the original on April 25, 2020.
- "President Donald J. Trump Remains Committed to Caring for Our Nation's Seniors During the Coronavirus Pandemic and Beyond". whitehouse.gov. April 30, 2020 – via National Archives.
- "President Trump delivers remarks on senior citizens and COVID-19". USA Today. April 30, 2020.
- "Nursing homes account for more than half of Maryland's coronavirus deaths. Some want the state to do more". Baltimore Sun. April 28, 2020.
- "Coronavirus deaths in nursing homes grow, as N.J. still tries to sort out the grim toll in each facility". NJ.com. April 27, 2020.
- "Demographic perspectives on the mortality of COVID-19 and other epidemics", Proceedings of the National Academy of Sciences, Sept. 8, 2020
- "Charts: How The U.S. Ranks On COVID-19 Deaths Per Capita—And By Case Count", NPR, August 5, 2020
- Donnelly, Claire (July 2, 2020). "Wake Forest COVID Study: Death Rate, Severity Of Symptoms Is Lower Than First Thought". www.wunc.org. Retrieved August 1, 2020.
- Sheyner, Gennady. "Los Angeles study backs Stanford researchers' conclusion about high prevalence of COVID-19". paloaltoonline.com. Retrieved August 1, 2020.
- "40% of people infected with COVID-19 are asymptomatic, a new CDC estimate says", Business Insider, July 13, 2020
- "Children and COVID-19: State-Level Data Report". aap.org. American Academy of Pediatrics. Retrieved September 22, 2020.
- American Academy of Pediatrics and the Children's Hospital Association (September 17, 2020). Children and COVID-19: State Data Report (PDF) (Report). American Academy of Pediatrics. pp. 9–11. Retrieved September 22, 2020.
- "WHO says China revised coronavirus infection data to 'leave no case undocumented'". CNBC. April 17, 2020.
- Rothwell, Jonathan; Desai, Sonal (December 20, 2020). "How misinformation is distorting COVID policies and behaviors". The Brookings Institution. Retrieved March 10, 2021.
- Foster, Robin; Mundell, E.J. (September 29, 2020). "Global Death Toll From COVID-19 Passes One Million". U.S. News & World Report. Retrieved March 10, 2021.
- Ghosh, Abantika (September 26, 2020). "Stanford study estimates fewer than 10% US adults had Covid antibodies in July". The Print. Retrieved March 10, 2021.
- Van Beusekom, Mary. "Less than 10% of US population has COVID-19 antibodies, data show". Center for Infectious Disease Research and Policy. University of Minnesota. Retrieved March 10, 2021.
- "How Accurate Are Coronavirus Death Counts?". WebMD. April 17, 2020.
- White, Tracie (September 28, 2020). "Fewer than 1 in 10 Americans have antibodies to coronavirus, study finds". Stanford University News Center. Retrieved March 9, 2021.
- Weintraub, Karen (September 28, 2020). "About 9% of Americans exposed to COVID-19 by midsummer. That's a long way from herd immunity". USA Today. Retrieved March 10, 2021.
- Cortez, Michelle Fay (September 25, 2020). "Covid Immunity Remains Low With Under 10% of U.S. Adults Exposed". Bloomberg News. Retrieved March 9, 2021.
- Czachor, Emily (September 27, 2020). "National Coronavirus Antibody Study Suggests Herd Immunity 'Remains Out of Reach' in the U.S." Newsweek. Retrieved March 9, 2021.
- Feuer, Will (September 26, 2020). "Fewer than 10% of Americans show signs of past coronavirus infection, study finds". CNBC. Retrieved March 13, 2021.
- Cortez, Michelle Fay (September 28, 2020). "Covid Insights Come From Dialysis Patients". Bloomberg. Retrieved March 10, 2021.
- "Estimated COVID-19 Burden". Centers for Disease Control and Prevention. July 27, 2021. Retrieved October 18, 2021.
- "US cumulative Covid cases reach 36mn mark, toll at 6,16,712". Connectedtoindia. August 9, 2021. Retrieved August 9, 2021.
- "NY Times COVID 19 Dataset". NY Times COVID 19 Data. NY Times. Retrieved March 19, 2021.
- "Excess Deaths Associated with COVID-19". www.cdc.gov. October 28, 2022.
- "owid/covid19-data/public/data/". GitHub.
- "Provisional COVID-19 Death Counts by Sex, Age, and Week)". CDC. Retrieved August 22, 2021.
- "COVID-19 Provisional Counts - Weekly Updates by Select Demographic and Geographic Characteristics". www.cdc.gov. February 17, 2021. Retrieved February 17, 2021.
- "COVID-19 Provisional Counts - Weekly Updates by Select Demographic and Geographic Characteristics". www.cdc.gov. August 18, 2021. Retrieved August 22, 2021.
- "Coronavirus (COVID-19) U.S. Deaths". RealClearPolitics. Retrieved February 10, 2022.
{{cite web}}: CS1 maint: url-status (link) - Shear, Michael D.; Crowley, Michael; Glanz, James (March 31, 2020). "Coronavirus May Kill 100,000 to 240,000 in U.S. Despite Actions, Officials Say". The New York Times. Retrieved April 1, 2020.
- "Coronavirus Live Updates: Four Months After First Case, U.S. Death Toll Passes 100,000". The New York Times. May 28, 2020. ISSN 0362-4331. Retrieved May 28, 2020.
- "US COVID-19 Deaths Reach 240K as Daily Cases Set Another Record". NBC Connecticut. November 9, 2020. Retrieved December 17, 2020.
- CDC (February 11, 2020). "Coronavirus Disease 2019 (COVID-19)". Centers for Disease Control and Prevention. Retrieved December 17, 2020.
- Holcombe, Madeline (May 29, 2020). "With the coronavirus pandemic entering a new phase in the US, world health experts shift focus to new hot spots". CNN. Retrieved September 5, 2020.
- CDC (March 28, 2020). "Coronavirus Disease 2019 (COVID-19) in the U.S." Centers for Disease Control and Prevention. Retrieved June 21, 2020.
- "Forecasts of COVID-19 Deaths". CDC.gov. July 31, 2020.
- CDC (March 28, 2020). "COVID Data Tracker". Centers for Disease Control and Prevention. Retrieved February 14, 2021.
- Marsh, Jenni (February 14, 2021). "More than 600,000 Americans will have died of coronavirus by June 1, model forecasts". CNN. Retrieved February 14, 2021.
- CDC (March 28, 2020). "COVID Data Tracker". Centers for Disease Control and Prevention. Retrieved June 4, 2021.
- Ang, Katerina; Berger, Miriam; Bellware, Kim (June 16, 2021). "United States surpasses 600,000 coronavirus deaths". Washington Post. Retrieved June 16, 2021.
- "IHME | COVID-19 Projections". Institute for Health Metrics and Evaluation. Retrieved September 21, 2021.
- CDC (March 28, 2020). "COVID Data Tracker". Centers for Disease Control and Prevention. Retrieved November 29, 2021.
- Guy, Jack; Strange, Hannah; Mogul, Rhea; Renton, Adam (January 12, 2022). "CDC forecast predicts more than 62,000 Covid-19 deaths in the US in the next four weeks". CNN. Retrieved January 12, 2022.
{{cite web}}: CS1 maint: url-status (link) - "The HIV/AIDS Epidemic in the United States: The Basics". KFF.org. Kaiser Family Foundation. Retrieved April 26, 2020.
- "Past Pandemics". June 11, 2019. Archived from the original on July 3, 2020. Retrieved June 22, 2020.
External links
 Media related to COVID-19 pandemic in the United States at Wikimedia Commons
| |||||||||||||||||||||||||||||||||||||||||||||||||||||||||||||||||||||||||||||||||||||||||||||||||||||||||||||||||||||||||||||||||||||||||||||||||||||||||||||||||||||||||||||||||||||||||||||||||||||||||||||||||||||||||||||||||||||||||||||||||||||
.jpg.webp)