Atlantic hurricane season
The Atlantic hurricane season is the period in a year from June through November when tropical cyclones form in the Atlantic Ocean, referred to in North American countries as hurricanes, tropical storms, or tropical depressions. In addition, there have been several storms over the years that have not been fully tropical and are categorized as subtropical depressions and subtropical storms. Even though subtropical storms and subtropical depressions are not technically as strong as tropical cyclones, the damages can still be devastating.
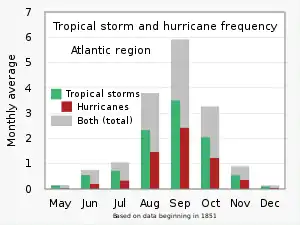
Worldwide, tropical cyclone activity peaks in late summer, when the difference between temperatures aloft and sea surface temperatures is the greatest. However, each tropical cyclone basin has its own seasonal patterns. On a worldwide scale, May is the least active month, while September is the most active.[2] In the Northern Atlantic Ocean, a distinct hurricane season occurs from June 1 to November 30, sharply peaking from late August through September;[2] the season's climatological peak of activity occurs around September 10 each season.[3] This is the norm, but in 1938, the Atlantic hurricane season started as early as January 3.
Tropical disturbances that reach tropical storm intensity are named from a pre-determined list. On average, 10.1 named storms occur each season, with an average of 5.9 becoming hurricanes and 2.5 becoming major hurricanes (Category 3 or greater). The most active season on record was 2020, during which 30 named tropical cyclones formed. Despite this, the 2005 season had more hurricanes, developing a record of 15 such storms. The least active season was 1914, with only one known tropical cyclone developing during that year.[4] The Atlantic hurricane season is a time when most tropical cyclones are expected to develop across the northern Atlantic Ocean. It is currently defined as the time frame from June 1 through November 30, though in the past the season was defined as a shorter time frame. During the season, regular tropical weather outlooks are issued by the National Hurricane Center, and coordination between the Weather Prediction Center and National Hurricane Center occurs for systems which have not yet formed but may develop during the next three to seven days. There is also a season within a season. The strongest time for hurricane activity seems to be between mid-August through mid-October. Wind factors and temperature and moisture are perfect during this time to encourage cyclonic activity.[5]
Concept
The basic concept of a hurricane season began during 1935,[6] when dedicated wire circuits known as hurricane circuits began to be set up along the Gulf and Atlantic coasts,[7] a process completed by 1955.[8] It was originally the time frame when the tropics were monitored routinely for tropical cyclone activity, and was originally defined as from June 15 through October 31.[9] Over the years, the beginning date was shifted back to June 1, while the end date was shifted to November 15,[7] before settling at November 30 by 1965.[10][11] This was when hurricane reconnaissance planes were sent out to fly across the Atlantic and Gulf of Mexico on a routine basis to look for potential tropical cyclones, in the years before the continuous weather satellite era.[9] Since regular satellite surveillance began, hurricane hunter aircraft fly only into storm areas which are first spotted by satellite imagery.[12]
Operations
During the hurricane season, the National Hurricane Center routinely issues their Tropical Weather Outlook product, which identifies areas of concern within the tropics which could develop into tropical cyclones. If systems occur outside the defined hurricane season, special Tropical Weather Outlooks will be issued.[13] Routine coordination occurs at 1700 UTC each day between the Weather Prediction Center and National Hurricane Center to identify systems for the pressure maps three to seven days into the future within the tropics, and points for existing tropical cyclones six to seven days into the future.[14] Possible tropical cyclones are depicted with a closed isobar, while systems with less certainty to develop are depicted as "spot lows" with no isobar surrounding them.
HURDAT
The North Atlantic hurricane database, or HURDAT, is the database for all tropical storms and hurricanes for the Atlantic Ocean, Gulf of Mexico and Caribbean Sea, including those that have made landfall in the United States. The original database of six-hourly positions and intensities were put together in the 1960s in support of the Apollo space program to help provide statistical track forecast guidance. In the intervening years, this database — which is now freely and easily accessible on the Internet from the National Hurricane Center's (NHC) webpage — has been utilized for a wide variety of uses: climatic change studies, seasonal forecasting, risk assessment for county emergency managers, analysis of potential losses for insurance and business interests, intensity forecasting techniques and verification of official and various model predictions of track and intensity.
HURDAT was not designed with all of these uses in mind when it was first put together and not all of them may be appropriate given its original motivation. HURDAT contains numerous systematic as well as some random errors in the database. Additionally, analysis techniques have changed over the years at NHC as their understanding of tropical cyclones has developed, leading to biases in the historical database. Another difficulty in applying the hurricane database to studies concerned with landfalling events is the lack of exact location, time and intensity at hurricane landfall.
Re-analysis project
HURDAT is regularly updated annually to reflect the previous season's activity. The older portion of the database has been regularly revised since 2001. The first time in 2001 led to the addition of tropical cyclone tracks for the years 1851 to 1885. The second time was in October 2002 when Hurricane Andrew (August 1992) was upgraded to a Category 5. Recent efforts into uncovering undocumented historical hurricanes in the late 19th and 20th centuries by various researchers have greatly increased our knowledge of these past events. Tropical storms from 1851 to 1970 have already been reanalyzed with most recently, re-analysis of tropical storms from 1961 to 1965 being completed and integrated into HURDAT database in November 2019, and re-analysis of tropical storms from 1966 to 1970 being completed and integrated into HURDAT database in January 2022.[15] Possible changes for the years 1971 onward are not yet incorporated into the HURDAT database. Due to these issues, a re-analysis of the Atlantic hurricane database is being attempted that will be completed in three years.
In addition to the groundbreaking work by Partagas, additional analyses, digitization and quality control of the data was carried out by researchers at the NOAA Hurricane Research Division funded by the NOAA Office of Global Programs.[16]
The National Hurricane Center's Best Track Change Committee has approved changes for a few recent cyclones, such as Hurricane Andrew. Official changes to the Atlantic hurricane database are approved by the National Hurricane Center Best Track Change Committee.
1494–1850 (pre-HURDAT era)
| Period | Seasons | Individual years |
|---|---|---|
| Pre-19th century | Pre-17th century (pre 1600), 17th century (1600s), 18th century (1700s) | 1780 |
| 1800–1849 | 1800–1809, 1810–1819, 1820–1829, 1830–1839, 1840–1849 | 1842 |
1850–1899 (1851–present HURDAT era)
1850s
| Year | TS | H | MH | ACE | Deaths | Strongest storm | Major landfalling storms | Notes |
|---|---|---|---|---|---|---|---|---|
| 1850 | 7 | 7 | 7 | 0 | ? Unknown | ? Hurricane One | ||
| 1851 | 6 | 3 | 1 | 36.24 | 24 | 3 "San Agapito" | 3 "San Agapito" | First Atlantic hurricane season to be included in the HURDAT. |
| 1852 | 5 | 5 | 1 | 73.28 | 100+ | 3 "Great Mobile" | 3 "Great Mobile" | One of three seasons in which all known cyclones became hurricanes. |
| 1853 | 8 | 4 | 2 | 76.49 | 40 | 4 Three | Earliest known Category 4 hurricane on the Saffir-Simpson scale. | |
| 1854 | 5 | 3 | 1 | 31.00 | 30+ | 3 "South Carolina" | 3 "South Carolina" | |
| 1855 | 5 | 4 | 1 | 18.12 | Unknown | 3 "Middle Gulf Shore" | 3 "Middle Gulf Shore" | |
| 1856 | 6 | 4 | 2 | 48.94 | 200+ | 4 "Last Island" | 3 "Southeastern States" 4 "Last Island" |
|
| 1857 | 4 | 3 | 0 | 46.84 | 424 | 2 SS Central America Disaster 2 Four |
2 SS Central America Disaster | |
| 1858 | 6 | 6 | 0 | 44.79 | None | 2 Three 2 Six |
2 Hurricane Three | |
| 1859 | 8 | 7 | 1 | 55.73 | Numerous | 3 Six | 1 Hurricane Five 3 Hurricane Six 1 Hurricane Eight |
|
1860s
| Year | TS | H | MH | ACE | Deaths | Strongest storm | Major landfalling storms | Notes |
|---|---|---|---|---|---|---|---|---|
| 1860 | 7 | 6 | 1 | 62.06 | 60+ | 4 One | 4 Hurricane One | |
| 1861 | 8 | 6 | 0 | 49.71 | 22+ | 2 One 2 Three |
1 "Key West" 1 "Expedition" |
|
| 1862 | 6 | 3 | 0 | 46.03 | 3 | 2 Two 2 Three |
||
| 1863 | 9 | 5 | 0 | 50.35 | 90 | 2 "Amanda" | 2 "Amanda" | |
| 1864 | 5 | 3 | 0 | 26.55 | None | 1 One 1 Three 1 Five |
||
| 1865 | 7 | 3 | 0 | 49.13 | 326 | 2 Four 2 Seven |
2 Hurricane Four | |
| 1866 | 7 | 6 | 1 | 83.65 | 383 | 4 "Nassau" | 4 "Nassau" | |
| 1867 | 9 | 6 | 1 | 59.97 | 811 | 3 "San Narciso" | 3 "San Narciso" | |
| 1868 | 4 | 3 | 0 | 34.65 | 2 | 2 One 2 Two 2 Four |
||
| 1869 | 10 | 7 | 1 | 51.02 | 38 | 3 New England Gale | 3 New England Gale 2 Saxby Gale |
|
1870s
| Year | TS | H | MH | ACE | Deaths | Strongest storm | Major landfalling storms | Notes |
|---|---|---|---|---|---|---|---|---|
| 1870 | 11 | 10 | 2 | 87.80 | 2,052 | 3 Four | 3 "First Key West" 2 "Second Key West" |
|
| 1871 | 8 | 6 | 2 | 88.39 | 30 | 3 Three 3 "Santa Juana" |
3 Hurricane Three 3 "Santa Juana" |
|
| 1872 | 5 | 4 | 0 | 65.38 | Unknown | 2 Two | ||
| 1873 | 5 | 3 | 2 | 69.47 | 626 | 3 "Central Florida" | 3 "Central Florida" | |
| 1874 | 7 | 4 | 0 | 47.05 | Unknown | 2 Seven | ||
| 1875 | 6 | 5 | 1 | 72.48 | 800 | 3 "Indianola" | 3 "Indianola" | |
| 1876 | 5 | 4 | 2 | 56.05 | 19 | 3 "San Felipe" | 3 "San Felipe" 3 "Cuba-South Florida" |
|
| 1877 | 8 | 3 | 1 | 73.36 | 34 | 3 "Florida Panhandle" | 3 "Florida Panhandle" | |
| 1878 | 12 | 10 | 1 | 180.85 | 108 | 4 Seven | 2 Gale of 1878 | |
| 1879 | 8 | 6 | 2 | 63.63 | 47 | 3 "Louisiana" | 3 "Great Beaufort" 3 "Louisiana" |
|
1880s
| Year | TS | H | MH | ACE | Deaths | Strongest storm | Major landfalling storms | Notes |
|---|---|---|---|---|---|---|---|---|
| 1880 | 11 | 9 | 2 | 131.08 | 133 | 4 Eight | 4 Hurricane Two | |
| 1881 | 7 | 4 | 0 | 59.25 | 700 | 2 "Georgia" | 2 "Georgia" | |
| 1882 | 6 | 5 | 2 | 59.47 | 6 | 4 "Cuba" | 3 "Pensacola" 4 "Cuba" |
|
| 1883 | 4 | 3 | 2 | 66.70 | 236 | 3 Two | 3 "Bahamas-North Carolina" | |
| 1884 | 4 | 4 | 1 | 72.06 | 8 | 3 Two | ||
| 1885 | 8 | 6 | 1 | 58.30 | 25 | 2 Two | ||
| 1886 | 12 | 10 | 4 | 166.17 | 200+ | 4 "Indianola" | 4 "Indianola" 3 "Cuba" 3 "Texas-Louisiana" |
Seven hurricanes struck the United States, the most during a single year.[17] |
| 1887 | 19 | 11 | 2 | 181.26 | 2 | 3 Seven | Record five off-season storms. | |
| 1888 | 9 | 6 | 2 | 84.95 | 924 | 3 "San Gil" | 3 "Louisiana" 3 "San Gil" |
|
| 1889 | 9 | 6 | 0 | 104.04 | 40 | 2 Six | ||
1890s
| Year | TS | H | MH | ACE | Deaths | Strongest storm | Major landfalling storms | Notes |
|---|---|---|---|---|---|---|---|---|
| 1890 | 4 | 2 | 1 | 33.35 | 14 | 3 Three | ||
| 1891 | 10 | 7 | 1 | 116.11 | 700+ | 3 "Martinique" | 3 "Martinique" | |
| 1892 | 9 | 5 | 0 | 115.84 | 16 | 2 Three 2 Five 2 Seven |
||
| 1893 | 12 | 10 | 5 | 231.15 | 4,028 | 4 "Cheniere Caminada" | 3 "San Roque" 3 "New York" 3 "Sea Islands" 3 "Charleston" 4 "Cheniere Caminada" |
Two hurricanes caused more than 2,000 deaths in the United States. Four simultaneous hurricanes on August 22, one of two times on record. |
| 1894 | 7 | 5 | 4 | 135.42 | 200+ | 4 Six | 3 "Florida Panhandle" | |
| 1895 | 6 | 2 | 0 | 68.77 | 56 | 2 Two | ||
| 1896 | 7 | 6 | 2 | 136.08 | 286 | 3 "Cedar Keys" | 3 "San Ramón" 3 "Cedar Keys" |
|
| 1897 | 6 | 3 | 0 | 54.54 | 262 | 2 One | ||
| 1898 | 11 | 5 | 1 | 113.24 | 562 | 4 "Georgia" | 4 "Georgia" | |
| 1899 | 9 | 5 | 2 | 151.03 | 4,167 | 4 "San Ciríaco" | 4 "San Ciríaco" | The San Ciríaco hurricane was the longest-lasting Atlantic hurricane on record |
1900s
NOTE: In the following tables, all estimates of damage costs are expressed in contemporaneous US dollars (USD).
1900s
| Year | TS | H | MH | ACE | Deaths | Damage | Strongest storm | Major landfalling storms | Notes |
|---|---|---|---|---|---|---|---|---|---|
| 1900 | 7 | 3 | 2 | 83.35 | 8,000+ | $35.4M | 4 "Galveston" | 4 "Galveston" | The Galveston hurricane was the deadliest disaster in the United States. |
| 1901 | 13 | 6 | 0 | 98.98 | 35-40 | $1M | 2 Seven | 1 "Louisiana" | |
| 1902 | 5 | 3 | 0 | 32.65 | 5 | Unknown | 2 Four | ||
| 1903 | 10 | 7 | 1 | 102.07 | 222 | $18.5M | 3 "Jamaica" | 3 "Jamaica" 1 "Florida" 2 "New Jersey" |
|
| 1904 | 5 | 3 | 0 | 30.35 | 112 | $2.5M | 1 Two | 1 One | |
| 1905 | 5 | 1 | 1 | 28.38 | 8 | Unknown | 3 Four | ||
| 1906 | 11 | 6 | 3 | 162.88 | 381 | $25.4M | 4 Four | 3 "Mississippi" 3 "Florida Keys" |
|
| 1907 | 5 | 0 | 0 | 13.06 | None | Unknown | TS One | One of two seasons with no recorded hurricanes, the other being 1914. | |
| 1908 | 10 | 6 | 1 | 95.11 | 37 | Unknown | 3 Six | Includes the only known March tropical cyclone in the basin. | |
| 1909 | 11 | 6 | 4 | 93.34 | 4,673 | $77.3M | 3 "Grand Isle" | 3 "Velasco" 3 "Monterrey" 3 "Grand Isle" 3 "Florida Keys" 2 "Greater Antilles" |
|
1910s
| Year | TS | H | MH | ACE | Deaths | Damage | Strongest storm | Major landfalling storms | Notes |
|---|---|---|---|---|---|---|---|---|---|
| 1910 | 5 | 3 | 1 | 63.90 | 100 | $1.25M | 4 "Cuba" | 4 "Cuba" | |
| 1911 | 6 | 3 | 0 | 34.29 | 27 | $3M | 2 Three | ||
| 1912 | 7 | 4 | 1 | 57.26 | 116 | $1.6M | 3 "Jamaica" | 3 "Jamaica" | |
| 1913 | 6 | 4 | 0 | 35.60 | 5 | $4M | 1 Four | ||
| 1914 | 1 | 0 | 0 | 2.53 | 0 | Unknown | TS One | Least active season on record. One of two seasons with no recorded hurricanes, along with 1907. | |
| 1915 | 6 | 5 | 4 | 130.10 | 675 | $63M | 4 "New Orleans" | 4 "Galveston" 4 "New Orleans" |
Two Category 4 hurricanes made landfall in the United States. |
| 1916 | 15 | 10 | 5 | 144.01 | 31 | $5.9M | 4 "Texas" | 3 "Gulf Coast" 3 "Charleston" 4 "Texas" |
|
| 1917 | 4 | 2 | 2 | 60.67 | 76 | $170,000 | 4 "Nueva Gerona" | 4 "Nueva Gerona" | |
| 1918 | 6 | 4 | 1 | 39.87 | 55 | $5M | 3 "Louisiana" | 3 "Louisiana" | |
| 1919 | 5 | 2 | 1 | 55.04 | 828 | $22M | 4 "Florida Keys" | 4 "Florida Keys" | |
1920s
| Year | TS | H | MH | ACE | Deaths | Damage | Strongest storm | Major landfalling storms | Notes |
|---|---|---|---|---|---|---|---|---|---|
| 1920 | 5 | 4 | 0 | 29.81 | 1 | $1.5M | 2 "Louisiana" | 2 "Louisiana" | |
| 1921 | 7 | 5 | 2 | 86.53 | 6 | $36.5M | 4 "Tampa Bay" | 3 "San Pedro" 4 "Tampa Bay" |
|
| 1922 | 5 | 3 | 1 | 54.52 | 105 | $2.3M | 3 Two | ||
| 1923 | 9 | 4 | 1 | 49.31 | 15 | $1.3M | 3 Five | ||
| 1924 | 11 | 5 | 2 | 100.19 | 179 | Unknown | 5 "Cuba" | 5 "Cuba" | First official Category 5 Atlantic hurricane on the Saffir–Simpson scale. |
| 1925 | 4 | 2 | 0 | 7.25 | 59+ | $19.9M | 1 One | TS "Florida" | |
| 1926 | 11 | 8 | 6 | 229.56 | 1,448 | $247.4M | 4 "Miami" | 4 "Nassau" 3 "Nova Scotia" 3 "Louisiana" 4 "Miami" 4 "Havana–Bermuda" |
|
| 1927 | 8 | 4 | 1 | 56.48 | 184 | Unknown | 3 "Nova Scotia" | 3 "Nova Scotia" | |
| 1928 | 6 | 4 | 1 | 83.48 | 4,289 | $102M | 5 "Okeechobee" | 5 "Okeechobee" | |
| 1929 | 5 | 3 | 1 | 48.07 | 62 | $10.0M | 4 "Bahamas" | 4 "Bahamas" | |
1930s
| Year | TS | H | MH | ACE | Deaths | Damage | Strongest storm | Major landfalling storms | Notes |
|---|---|---|---|---|---|---|---|---|---|
| 1930 | 3 | 2 | 2 | 49.77 | 8,000 | $50M | 4 "San Zenón" | 4 "San Zenón" | The San Zenón hurricane was the fifth deadliest on record. |
| 1931 | 13 | 3 | 1 | 47.84 | 2,502 | $7.5M | 4 "British Honduras" | 4 "British Honduras" | |
| 1932 | 15 | 6 | 4 | 169.66 | 3,315 | $37M | 5 "Cuba" | 4 "Freeport" 5 "Bahamas" 4 "San Ciprián" 5 "Cuba" |
Only season with a Category 5 hurricane in November. |
| 1933 | 20 | 11 | 6 | 258.57 | 651 | $86.6M | 5 "Tampico" | 4 "Chesapeake–Potomac" 5 "Cuba–Brownsville" 4 "Treasure Coast" 4 "Outer Banks" 5 "Tampico" |
Fourth most active season on record. |
| 1934 | 13 | 7 | 1 | 79.07 | 2,017 | $4.26M | 3 Thirteen | ||
| 1935 | 8 | 5 | 3 | 106.21 | 2,604 | $12.5M | 5 "Labor Day" | 5 "Labor Day" 4 "Cuba" |
Most intense landfalling Atlantic hurricane known to date ("Labor Day"). |
| 1936 | 17 | 7 | 1 | 99.78 | 5 | $1.23M | 3 "Mid-Atlantic" | ||
| 1937 | 11 | 4 | 1 | 65.85 | 0 | Unknown | 3 Six | ||
| 1938 | 9 | 4 | 2 | 77.58 | ~700 | $290.3M | 5 "New England" | 5 "New England" | Earliest-starting season on record (January 3). |
| 1939 | 6 | 3 | 1 | 43.68 | 5 | Unknown | 4 Five | ||
1940s
| Year | TS | H | MH | ACE | Deaths | Damage | Strongest storm | Major landfalling storms | Notes |
|---|---|---|---|---|---|---|---|---|---|
| 1940 | 9 | 6 | 0 | 67.79 | 101 | $4.7M | 2 "New England" | 2 "South Carolina" | |
| 1941 | 6 | 4 | 3 | 51.77 | 63 | $10M | 3 "Florida" | 3 "Texas" 4 "Nicaragua" 3 "Florida" |
|
| 1942 | 11 | 4 | 1 | 62.49 | 17 | $30.6M | 3 "Matagorda" | 3 "Matagorda" | |
| 1943 | 10 | 5 | 2 | 94.01 | 19 | $17.2M | 4 Three | 2 "Surprise" | First year of hurricane hunters. |
| 1944 | 14 | 8 | 3 | 104.45 | 1,153 | $202M | 5 "Great Atlantic" | 5 "Great Atlantic" 4 "Cuba–Florida" |
|
| 1945 | 11 | 5 | 2 | 63.42 | 80 | $80M | 4 "Homestead" | 3 "Texas" 4 "Homestead" |
|
| 1946 | 7 | 3 | 0 | 19.61 | 5 | $5.2M | 2 Four | 2 "Florida" | |
| 1947 | 10 | 5 | 2 | 88.49 | 94 | $145.3M | 4 "Fort Lauderdale" | 4 "Fort Lauderdale" (George) 2 "Cape Sable" (King) |
First year of internal Atlantic tropical cyclone naming.[18] |
| 1948 | 10 | 6 | 4 | 94.98 | 94 | $30.9M | 4 "Florida" | 4 "Florida" (Easy) 3 "Miami" (Fox) |
|
| 1949 | 16 | 7 | 3 | 96.45 | 3 | $58.2M | 4 "Florida" | 4 "Florida" 2 "Texas" |
|
1950s
| Year | TS | H | MH | ACE | Deaths | Damage | Strongest storm | Retired names | Notes |
|---|---|---|---|---|---|---|---|---|---|
| 1950 | 16 | 11 | 6 | 211.28 | 20 | $37M | 4 Dog | None | Record-breaking 8 tropical storms in October. |
| 1951 | 12 | 8 | 3 | 126.33 | 257 | $80M | 4 Easy | None | |
| 1952 | 11 | 5 | 2 | 69.08 | 607 | $3.75M | 4 Fox | None | Includes the only known February tropical cyclone in the basin. |
| 1953 | 14 | 7 | 3 | 98.51 | 1 | $6M | 5 Carol | None | First year of female names for storms.[19] One of only 4 seasons to have both a preseason and postseason storm. |
| 1954 | 16 | 7 | 3 | 110.88 | 1,069 | $752M | 4 Hazel | 3 Carol 3 Edna 4 Hazel |
Includes Alice, one of two storms in the basin to span two calendar years.[20] |
| 1955 | 13 | 9 | 4 | 158.17 | 1,518 | $1.2bn | 5 Janet | 4 Connie 2 Diane 4 Ione 5 Janet |
|
| 1956 | 12 | 4 | 1 | 56.67 | 76 | $67.8M | 3 Betsy | None | |
| 1957 | 8 | 3 | 2 | 78.66 | 513 | $152.5M | 4 Carrie | 3 Audrey | One of only two seasons to feature a major hurricane in June. |
| 1958 | 12 | 7 | 3 | 109.69 | 41 | $12M | 4 Helene | None | |
| 1959 | 14 | 7 | 2 | 77.11 | 59 | $23.3M | 4 Gracie | 4 Gracie | |
| Total | 128 | 68 | 29 | 1096.38 | 4,161 | $2.54bn | Janet | 9 names |
1960s
| Year | TS | H | MH | ACE | Deaths | Damage | Strongest storm | Retired names | Notes |
|---|---|---|---|---|---|---|---|---|---|
| 1960 | 8 | 4 | 2 | 72.90 | 455 | $442.34M | 4 Donna | 4 Donna | |
| 1961 | 12 | 8 | 5 | 188.89 | 345 | $392M | 5 Hattie | 4 Carla 5 Hattie |
Two Category 5 hurricanes. Lowest number of named storms for an extremely active season. |
| 1962 | 7 | 4 | 0 | 50.45 | 39 | >$4.88M | 2 Ella | None | |
| 1963 | 10 | 7 | 3 | 112.09 | 7,225 | $589M | 4 Flora | 4 Flora | Flora was the sixth-deadliest hurricane on record. |
| 1964 | 13 | 7 | 5 | 153.04 | 261 | $605M | 4 Cleo | 4 Cleo 4 Dora 4 Hilda |
|
| 1965 | 10 | 4 | 1 | 86.74 | 76 | $1.45bn | 4 Betsy | 4 Betsy | |
| 1966 | 15 | 7 | 3 | 138.68 | 1,094 | $410M | 5 Inez | 5 Inez | One of only two seasons to feature a major hurricane in June. |
| 1967 | 15 | 6 | 1 | 125.43 | 64 | $217M | 5 Beulah | 5 Beulah | First hurricane season in the modern satellite era. Features the highest number of tropical depressions in a season at the time. |
| 1968 | 9 | 5 | 0 | 46.60 | 10 | $10M | 2 Gladys | None | There was one subtropical storm with Category 1 hurricane strength. |
| 1969 | 18 | 12 | 3 | 149.25 | 364 | $1.7bn | 5 Camille | 5 Camille | Tied for the second most hurricanes in a season on record. |
| Total | 105 | 63 | 25 | 1124.09 | 9,933 | $5.82bn | Camille | 11 names |
1970s
| Year | TS | H | MH | ACE | Deaths | Damage | Strongest storm | Retired names | Notes |
|---|---|---|---|---|---|---|---|---|---|
| 1970 | 14 | 7 | 2 | 66.63 | 71 | $454M | 4 Celia | 4 Celia | First season of a 24-year period of decreased activity in the Atlantic (-AMO) Current extent of the reanalysis project as of January 2022 |
| 1971 | 13 | 6 | 1 | 96.53 | 45 | $213M | 5 Edith | None | Includes first documented Hurricane to cross Central America, Irene. |
| 1972 | 7 | 3 | 0 | 35.61 | 122 | $2.1bn | 2 Betty | 1 Agnes | Includes three subtropical storms. |
| 1973 | 8 | 4 | 1 | 47.85 | 15 | $18M | 3 Ellen | None | |
| 1974 | 11 | 4 | 2 | 68.13 | 8,260+ | $1.97bn | 4 Carmen | 4 Carmen 2 Fifi |
Includes four subtropical storms. Fifi was the fourth-deadliest hurricane on record. |
| 1975 | 9 | 6 | 3 | 76.06 | 80 | $100M | 4 Gladys | 3 Eloise | |
| 1976 | 10 | 6 | 2 | 84.17 | 72 | $100M | 3 Belle | None | Includes two subtropical storms. |
| 1977 | 6 | 5 | 1 | 25.32 | 10 | $10M | 5 Anita | 5 Anita | Features the strongest Atlantic hurricane to strike Mexico. |
| 1978 | 12 | 5 | 2 | 63.22 | 37 | $45M | 4 Greta | 4 Greta | Includes the January subtropical storm in the Atlantic. |
| 1979 | 9 | 5 | 2 | 92.92 | 2,118 | $4.3bn | 5 David | 5 David 4 Frederic |
First year for alternating male/female names. Includes one subtropical storm of Category 1 strength. |
| Total | 96 | 49 | 16 | 657 | 10,830+ | $9.31bn | David | 9 names |
1980s
| Year | TC | TS | H | MH | ACE | Deaths | Damage | Strongest storm | Retired names | Notes |
|---|---|---|---|---|---|---|---|---|---|---|
| 1980 | 15 | 11 | 9 | 2 | 148.94 | 256 | $1bn | 5 Allen | 5 Allen | Includes the storm with the highest sustained winds attained so far in the Atlantic. |
| 1981 | 18 | 12 | 7 | 3 | 100.38 | 10 | $45M | 4 Harvey | None | |
| 1982 | 9 | 6 | 2 | 1 | 31.50 | 141 | $100M | 4 Debby | None | |
| 1983 | 7 | 4 | 3 | 1 | 17.40 | 22 | $2.6bn | 3 Alicia | 3 Alicia | Least active hurricane season in the satellite era. |
| 1984 | 17 | 13 | 5 | 1 | 84.30 | 35 | $66M | 4 Diana | None | |
| 1985 | 13 | 11 | 7 | 3 | 87.98 | 241 | $4.5bn | 4 Gloria | 3 Elena 4 Gloria |
Hurricane Kate struck Florida on November 21, the latest United States hurricane landfall. |
| 1986 | 10 | 6 | 4 | 0 | 35.79 | 70 | $57M | 2 Earl | None | |
| 1987 | 14 | 7 | 3 | 1 | 34.36 | 10 | $90M | 3 Emily | None | |
| 1988 | 19 | 12 | 5 | 3 | 102.99 | 550 | $7bn | 5 Gilbert | 5 Gilbert 4 Joan |
Included the strongest hurricane on record until 2005 First hurricane since 1978 to cross Central America |
| 1989 | 15 | 11 | 7 | 2 | 135.13 | 112 | $10.7bn | 5 Hugo | 5 Hugo | |
| Total | 137 | 93 | 52 | 17 | 778.71 | 1,447 | $26.2bn | Gilbert | 7 names | |
1990s
| Year | TC | TS | H | MH | ACE | Deaths | Damage | Strongest storm | Retired names | Notes |
|---|---|---|---|---|---|---|---|---|---|---|
| 1990 | 16 | 14 | 8 | 1 | 96.80 | 116 | $150M | 3 Gustav | 2 Diana 1 Klaus |
No tropical storms or hurricanes made landfall in the United States. |
| 1991 | 12 | 8 | 4 | 2 | 35.54 | 30 | $2.5bn | 4 Claudette | 3 Bob | |
| 1992 | 9 | 7 | 4 | 1 | 76.22 | 66 | $27bn | 5 Andrew | 5 Andrew | Hurricane Andrew was the costliest U.S. hurricane until 2005. |
| 1993 | 10 | 8 | 4 | 1 | 38.67 | 274 | $271M | 3 Emily | None | |
| 1994 | 12 | 7 | 3 | 0 | 32.02 | 1,184 | $1.56bn | 2 Florence | None | Last season of a 24-year period of decreased activity in the Atlantic (-AMO). |
| 1995 | 21 | 19 | 11 | 5 | 227.10 | 115 | $9.3bn | 4 Opal | 4 Luis 3 Marilyn 4 Opal 3 Roxanne |
Tied for fifth most active season on record (with 1887, 2010, 2011 and 2012). First season of an ongoing period of increased activity in the Atlantic (+AMO). |
| 1996 | 13 | 13 | 9 | 6 | 166.18 | 179 | $3.8bn | 4 Edouard | 1 Cesar 3 Fran 4 Hortense |
Highest number of major hurricanes at the time. |
| 1997 | 9 | 8 | 3 | 1 | 40.93 | 11 | $110M | 3 Erika | None | |
| 1998 | 14 | 14 | 10 | 3 | 181.77 | 12,000+ | $12.2bn | 5 Mitch | 4 Georges 5 Mitch |
Four simultaneous hurricanes on September 26, the first time since 1893. Mitch was the deadliest hurricane in over 200 years. |
| 1999 | 16 | 12 | 8 | 5 | 176.53 | 465 | $5.9bn | 4 Floyd | 4 Floyd 4 Lenny |
Most Category 4 hurricanes on record, later tied by 2005 and 2020. |
| Total | 132 | 110 | 64 | 25 | 1071.75 | 14,440 | $62.7bn | Mitch | 15 names | |
2000s
NOTE: In the following tables, all estimates of damage costs are expressed in contemporaneous US dollars (USD).
2000s
| Year | TC | TS | H | MH | ACE | Deaths | Damage | Strongest storm | Retired names | Notes |
|---|---|---|---|---|---|---|---|---|---|---|
| 2000 | 19 | 15 | 8 | 3 | 119.14 | 105 | $1.3bn | 4 Keith | 4 Keith | |
| 2001 | 17 | 15 | 9 | 4 | 110.32 | 153 | $11.4bn | 4 Michelle | TS Allison 4 Iris 4 Michelle |
Allison was the first Atlantic tropical storm to have its name retired. |
| 2002 | 14 | 12 | 4 | 2 | 67.99 | 50 | $2.5bn | 3 Isidore | 3 Isidore 4 Lili |
Record-tying 8 named storms formed in September. |
| 2003 | 21 | 16 | 7 | 3 | 176.84 | 93 | $6.3bn | 5 Isabel | 4 Fabian 5 Isabel 2 Juan |
Includes 3 off-season storms. |
| 2004 | 17 | 15 | 9 | 6 | 226.88 | 3,260 | $61.2bn | 5 Ivan | 4 Charley 4 Frances 5 Ivan 3 Jeanne |
Record-tying 8 named storms forming in August. |
| 2005 | 31 | 28 | 15 | 7 | 250.13 | 3,912 | $171.8bn | 5 Wilma | 4 Dennis 5 Katrina 5 Rita 1 Stan 5 Wilma |
Second-costliest hurricane season on record. Holds the records for most hurricanes, major hurricanes, and Category 5 hurricanes. Most retired names. The first year to use the Greek alphabet, later also used in 2020. Includes 1 subtropical storm and 1 subtropical depression. |
| 2006 | 10 | 10 | 5 | 2 | 78.54 | 14 | $504.4M | 3 Gordon 3 Helene |
None | |
| 2007 | 17 | 15 | 6 | 2 | 73.89 | 478 | $3.4bn | 5 Dean | 5 Dean 5 Felix 1 Noel |
First season on record with two hurricanes landfalling at Category 5 intensity (Dean and Felix). |
| 2008 | 17 | 16 | 8 | 5 | 145.72 | 1,073 | $49.4bn | 4 Ike | 4 Gustav 4 Ike 4 Paloma |
Only year on record in which a major hurricane existed in every month from July through November. |
| 2009 | 11 | 9 | 3 | 2 | 52.58 | 9 | $58M | 4 Bill | None | |
| Total | 174 | 151 | 74 | 36 | 1302.02 | 9,146 | $307.9bn | Wilma | 24 names | |
2010s
| Year | TC | TS | H | MH | ACE | Deaths | Damage | Strongest storm | Retired names | Notes |
|---|---|---|---|---|---|---|---|---|---|---|
| 2010 | 21 | 19 | 12 | 5 | 165.48 | 392 | $7.4bn | 4 Igor | 4 Igor 2 Tomas |
Fifth most active season on record (tied with 1887, 1995, 2011 and 2012). Tied for second most hurricanes in a season with twelve. |
| 2011 | 20 | 19 | 7 | 4 | 126.30 | 112 | $17.4bn | 4 Ophelia | 3 Irene | Fifth most active season on record (tied with 1887, 1995, 2010 and 2012). |
| 2012 | 19 | 19 | 10 | 2 | 132.63 | 355 | $72.3bn | 3 Sandy | 3 Sandy | Fifth most active season on record (tied with 1887, 1995, 2010 and 2011). |
| 2013 | 15 | 14 | 2 | 0 | 36.12 | 54 | $1.5bn | 1 Humberto | 1 Ingrid | Includes one unnamed subtropical storm in December. |
| 2014 | 9 | 8 | 6 | 2 | 66.73 | 21 | $371.6M | 4 Gonzalo | None | Featured the fewest tropical storms since 1997. |
| 2015 | 12 | 11 | 4 | 2 | 62.69 | 89 | $813.9M | 4 Joaquin | TS Erika 4 Joaquin |
First season of a 7-year period of early season activity in the Atlantic. |
| 2016 | 16 | 15 | 7 | 4 | 141.25 | 736 | ≥$17.5bn | 5 Matthew | 5 Matthew 3 Otto |
Record for earliest formation of 4th named storm (Danielle). |
| 2017 | 18 | 17 | 10 | 6 | 224.87 | 3,364 | ≥$294.7bn | 5 Maria | 4 Harvey 5 Irma 5 Maria 1 Nate |
Costliest hurricane season on record. Earliest Main Development Region named storm on record (Bret). |
| 2018 | 16 | 15 | 8 | 2 | 132.58 | 172 | ≥$50.5bn | 5 Michael | 4 Florence 5 Michael |
Includes a record seven storms that were subtropical at one point. |
| 2019 | 20 | 18 | 6 | 3 | 132.20 | 118 | $11.6bn | 5 Dorian | 5 Dorian | Record fifth consecutive season for a storm to develop before the official start. Includes two subtropical storms. Record fourth consecutive season with a Category 5 hurricane. |
| Total | 166 | 155 | 72 | 30 | 1220.86 | 5,413 | $474.1bn | Maria | 15 names | |
2020s
| Year | TC | TS | H | MH | ACE | Deaths | Damage | Strongest storm | Retired names | Notes |
|---|---|---|---|---|---|---|---|---|---|---|
| 2020 | 31 | 30 | 14 | 7 | 180.37 | ≥417 | >$51.1bn | 4 Iota | 4 Laura 4 Eta 4 Iota |
Most active season in terms of tropical depressions and named storms. Holds record for the earliest formation date for the third, sixth, and every storm after. Second and final season after 2005 to use the Greek alphabet. Tied with 2005 for a record 7 tropical cyclones that became major hurricanes. Record-breaking fifth consecutive above-normal season. Record sixth straight season with at least one pre-season storm. |
| 2021 | 21 | 21 | 7 | 4 | 145.55 | 195 | $80.7bn | 4 Sam | 4 Ida | Record seventh consecutive season for a storm to develop before the official start (Ana). Third most active season on record. Record for the earliest formation date for the fifth storm (Elsa). Record-breaking sixth consecutive above-normal season. |
| 2022 | 15 | 13 | 7 | 2 | 87.8 | 319 | $53.5b | 4 Fiona | TBD | Season is still in progress. First season since 2014 not to have a pre-season named storm. First season since 1996 to feature more than one Atlantic–Pacific crossover hurricane (Bonnie and Julia). |
| Total | 67 | 64 | 28 | 13 | 413.72 | ≥931 | >$185bn | Iota | 4 names |
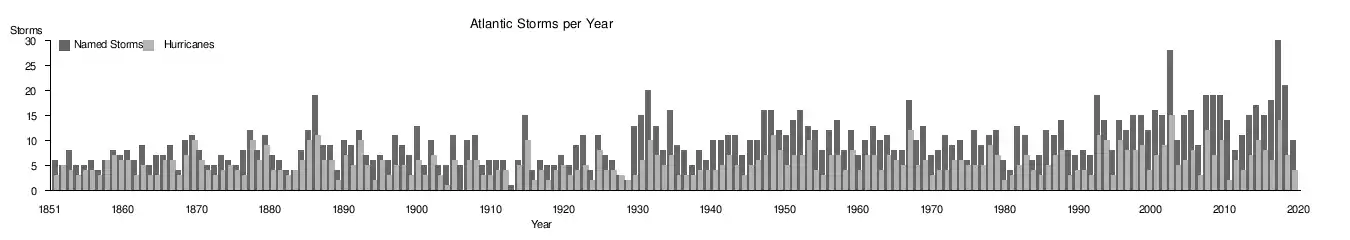
Number of tropical storms and hurricanes per season
A 2011 study analyzing one of the main sources of hurricanes - the African easterly wave (AEW) - found that the change in AEWs is closely linked to increased activity of intense hurricanes in the North Atlantic. The synoptic concurrence of AEWs in driving the dynamics of the Sahel greening also appears to increase tropical cyclogenesis over the North Atlantic.[21]

See also
Parent topics
- Tropical cyclone
- List of environment topics
- List of tropical cyclones
- Lists of tropical cyclone names
- List of historical tropical cyclone names
Atlantic hurricane topics
- Atlantic hurricane
- Accumulated cyclone energy
- List of Atlantic hurricane records
Other tropical cyclone basins
- Pacific hurricane season
- Pacific typhoon season
- North Indian Ocean tropical cyclone season
- South-West Indian Ocean tropical cyclone season
- Australian region tropical cyclone season
- South Pacific tropical cyclone season
- South Atlantic tropical cyclone
- Mediterranean tropical-like cyclone
References
- Landsea, Chris (contributor from the NHC). "Total and Average Number of Tropical Cylones by Month (1851-2017)". aoml.noaa.gov. National Oceanic and Atmospheric Administration, Atlantic Oceanographic and Meteorological Laboratory. Archived from the original on September 1, 2018.
{{cite web}}:|first1=has generic name (help) - Atlantic Oceanographic and Meteorological Laboratory, Hurricane Research Division. "Frequently Asked Questions: When is hurricane season?". NOAA. Archived from the original on July 18, 2006. Retrieved July 25, 2006.
- McAdie, Colin (May 10, 2007). "Tropical Cyclone Climatology". National Hurricane Center. Archived from the original on May 28, 2007. Retrieved June 9, 2007.
- "Atlantic hurricane best track (HURDAT version 2)" (Database). United States National Hurricane Center. September 19, 2022. Retrieved November 4, 2022.
- "The peak of the hurricane season – why now? | National Oceanic and Atmospheric Administration". www.noaa.gov. Retrieved September 24, 2020.
- "Hurricane Bureau Begins Season's Vigil Tonight". St. Petersburg Times. Associated Press. June 15, 1941. Retrieved July 9, 2011.
- "1959 Hurricane Season Opens Officially Today". Meridian Record. Associated Press. June 15, 1959. Retrieved July 9, 2011.
- "Hurricane Season Opens; New England Joins Circuit". The Robesonian. Associated Press. June 15, 1955. Retrieved July 9, 2011.
- "1960 Hurricane Season Open As Planes Prowl". The Evening Independent. Associated Press. June 15, 1960. Retrieved July 9, 2011.
- Neal Dorst (January 21, 2010). "Subject: G1) When is hurricane season ?". National Hurricane Center. Archived from the original on June 28, 2011. Retrieved July 9, 2011.
- Brownsville Herald (June 1, 1965). Hurricane Season Officially Opened.
- United Press International (May 30, 1966). "Hurricane Season Opens This Week". The News and Courier. Retrieved July 9, 2011.
- National Hurricane Center (2011). "Atlantic Graphical Tropical Weather Outlook". National Oceanic and Atmospheric Administration. Archived from the original on June 23, 2011. Retrieved July 9, 2011.
- United States Department of Commerce (2006). Assessment: Hurricane Katrina, August 23–31, 2005. Retrieved on 2008-09-03.
- "HURDAT Re-analysis".
- "Hurricane Protection Magazine - Special Report". Archived from the original on October 6, 2008. Retrieved November 5, 2011.
- Hurricane Research Division (2008). "Chronological List of All Hurricanes which Affected the Continental United States: 1851-2007". National Oceanic and Atmospheric Administration. Retrieved March 21, 2008.
- Dorst, Neal (October 23, 2012). "They Called the Wind Mahina: The History of Naming Cyclones" (PPTX). Hurricane Research Division, Atlantic Oceanographic and Meteorological Laboratory. National Oceanic and Atmospheric Administration. p. Slides 49–51.
- "Tropical Cyclone Naming History and Retired Names". www.nhc.noaa.gov. Retrieved November 1, 2021.
- Knabb, Richard D; Brown, Daniel P (March 17, 2006). "Tropical Cyclone Report: Tropical Storm Zeta" (PDF). National Hurricane Center. Retrieved March 11, 2020.
- Wang and Gillies (2011). "Observed Change in Sahel Rainfall, Circulations, African Easterly Waves, and Atlantic Hurricanes Since 1979". International Journal of Geophysics. 2011: 1–14. doi:10.1155/2011/259529.
{{cite journal}}: CS1 maint: uses authors parameter (link) - Leonhardt, David; Moses, Claire; Philbrick, Ian Prasad (September 29, 2022). "Ian Moves North / Category 4 and 5 Atlantic hurricanes since 1980". The New York Times. Archived from the original on September 30, 2022.
Source: NOAA - Graphic by Ashley Wu, The New York Times