List of causes of death by rate
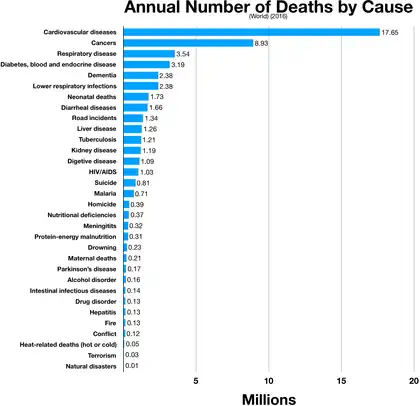
The following is a list of the causes of human deaths worldwide for different years arranged by their associated mortality rates. In 2002, there were about 57 million deaths. In 2005, according to the World Health Organization (WHO) using the International Statistical Classification of Diseases and Related Health Problems (ICD), about 58 million people died.[1] In 2010, according to the Institute for Health Metrics and Evaluation, 52.8 million people died.[2] In 2016, the WHO recorded 56.7 million deaths[3] with the leading cause of death as cardiovascular disease causing more than 17 million deaths (about 31% of the total) as shown in the chart to the side.
Some causes listed include deaths also included in more specific subordinate causes, and some causes are omitted, so the percentages may only sum approximately to 100%. The causes listed are relatively immediate medical causes, but the ultimate cause of death might be described differently. For example, tobacco smoking often causes lung disease or cancer, and alcohol use disorder can cause liver failure or a motor vehicle accident. For statistics on preventable ultimate causes, see preventable causes of death.
Besides frequency, other measures to compare, consider and monitor trends of causes of deaths include disability-adjusted life year (DALY) and years of potential life lost (YPLL).
By frequency
Age standardized death rate, per 100,000, by cause, in 2017, and percentage change 2007–2017.[4]
Overview table
This first table gives a convenient overview of the general categories and broad causes. The leading cause is cardiovascular disease at 31.59% of all deaths.
| Category | Cause | Percent of all deaths |
Percent of all deaths |
| I. Communicable, maternal, neonatal, and nutritional disorders | Respiratory infections and tuberculosis | 6.85 | 19.49% |
| Enteric infections | 3.31 | ||
| Sexually transmitted infections | 1.88 | ||
| Tropical diseases and malaria | 1.37 | ||
| Other infectious diseases | 1.57 | ||
| Maternal and neonatal disorders | 4.00 | ||
| Nutritional deficiencies | 0.52 | ||
| II. Non-communicable diseases | Cardiovascular diseases | 31.59 | 72.67% |
| Neoplasms | 16.43 | ||
| Chronic respiratory diseases | 6.97 | ||
| Digestive diseases | 4.11 | ||
| Neurological disorders | 5.84 | ||
| Substance abuse | 0.58 | ||
| Diabetes and kidney diseases | 4.55 | ||
| Skin diseases | 0.18 | ||
| Musculoskeletal disorders | 0.22 | ||
| Other non-communicable | 2.22 | ||
| III. Injuries | Transport injuries | 2.30 | 7.85% |
| Unintentional injuries | 3.23 | ||
| Self harm and violence | 2.32 | ||
| Total | 100% | 100% | |
Developed vs. developing economies
_and_YLLs_(B)%252C_by_pathogen_and_GBD_super-region%252C_2019.jpg.webp)
Top causes of death, according to the World Health Organization report for the calendar year 2001:[6]
| Causes of death in developing countries | Number of deaths | Causes of death in developed countries | Number of deaths |
|---|---|---|---|
| HIV-AIDS | 2,678,000 | Ischaemic heart disease | 3,512,000 |
| Lower respiratory infections | 2,643,000 | Cerebrovascular disease | 3,346,000 |
| Ischaemic heart disease | 2,484,000 | Chronic obstructive pulmonary disease | 1,829,000 |
| Diarrhea | 1,793,000 | Lower respiratory infections | 1,180,000 |
| Cerebrovascular disease | 1,381,000 | Lung cancer | 938,000 |
| Childhood diseases | 1,217,000 | Car crash | 669,000 |
| Malaria | 1,103,000 | Stomach cancer | 657,000 |
| Tuberculosis | 1,021,000 | Hypertensive heart disease | 635,000 |
| Chronic obstructive pulmonary disease | 748,000 | Tuberculosis | 571,000 |
| Measles | 674,000 | Suicide | 499,000 |
Detailed table
This table gives a more detailed and specific breakdown of the causes for the year 2017:
| Cause | Rate | Percent of all deaths | Percent Change 2007–2017 |
|---|---|---|---|
| All causes | 737.7 (729.9 to 745.4) | 100% | -14.2 (-15.0 to -13.5) |
| I. Communicable, maternal, neonatal, and nutritional disorders | 143.8 (138.4 to 151.6) | 19.49% | -31.8 (-33.3 to -30.1) |
| Respiratory infections and tuberculosis | 50.5 (48.8 to 52.3) | 6.85% | -24.5 (-26.4 to -22.6) |
| Tuberculosis | 14.9 (14.3 to 15.7) | 2.02% | -31.4 (-34.1 to -27.6) |
| Drug-susceptible tuberculosis | 13.2 (12.0 to 14.2) | 1.79% | -31.9 (-37.3 to -26.4) |
| Multidrug-resistant tuberculosis without extensive drug resistance | 1.6 (0.9 to 2.5) | 0.22% | -28.6 (-57.4 to 11.4) |
| Extensively drug-resistant tuberculosis | 0.2 (0.1 to 0.2) | 0.03% | -7.7 (-34.1 to 28.8) |
| Lower respiratory infections | 35.4 (33.8 to 36.8) | 4.80% | -21.1 (-23.2 to -18.9) |
| Upper respiratory infections | 0.1 (0.1 to 0.2) | 0.01% | -42.1 (-49.6 to -29.9) |
| Otitis media | 0.0 (0.0 to 0.0) | 0.00% | -50.4 (-58.8 to -39.9) |
| Enteric infections | 24.4 (19.5 to 32.4) | 3.31% | -29.9 (-34.9 to -23.1) |
| Diarrhoeal diseases | 21.6 (16.4 to 29.7) | 2.93% | -30.2 (-36.1 to -22.7) |
| Typhoid and paratyphoid | 1.9 (1.1 to 3.0) | 0.26% | -27.8 (-32.8 to -23.9) |
| (Typhoid fever) | 1.6 (0.9 to 2.6) | 0.22% | -29.1 (-34.1 to -25.0) |
| (Paratyphoid fever) | 0.3 (0.1 to 0.5) | 0.04% | -18.9 (-26.1 to -10.8) |
| iNTS | 0.8 (0.5 to 1.4) | 0.11% | -24.8 (-31.9 to -15.6) |
| Other intestinal infectious diseases | 0.0 (0.0 to 0.0) | 0.00% | -44.7 (-70.1 to 2.3) |
| Sexually transmitted infections | 13.9 (12.6 to 15.5) | 1.88% | -53.6 (-55.8 to -51.0) |
| HIV/AIDS | 12.1 (11.5 to 12.9) | 1.64% | -56.5 (-58.0 to -54.7) |
| HIV/AIDS – Drug-susceptible Tuberculosis | 2.5 (1.8 to 3.2) | 0.34% | -61.1 (-63.7 to -57.7) |
| HIV/AIDS – Multidrug-resistant Tuberculosis without extensive drug resistance | 0.3 (0.2 to 0.4) | 0.04% | -58.1 (-70.5 to -41.5) |
| HIV/AIDS – Extensively drug-resistant Tuberculosis | 0.0 (0.0 to 0.0) | 0.00% | -20.3 (-36.4 to -0.2) |
| HIV/AIDS resulting in other diseases | 9.3 (8.4 to 10.4) | 1.26% | -55.1 (-57.2 to -52.6) |
| Sexually transmitted infections excluding HIV | 1.8 (0.7 to 3.3) | 0.24% | -14.4 (-21.5 to -6.6) |
| Syphilis | 1.7 (0.7 to 3.2) | 0.23% | -14.3 (-21.8 to -6.4) |
| Chlamydial infection | 0.0 (0.0 to 0.0) | 0.00% | -15.2 (-21.0 to -8.4) |
| Gonococcal infection | 0.0 (0.0 to 0.0) | 0.00% | -14.9 (-20.8 to -8.2) |
| Other sexually transmitted infections | 0.0 (0.0 to 0.0) | 0.00% | -15.9 (-21.6 to -9.5) |
| Neglected tropical diseases and malaria | 10.1 (7.5 to 13.2) | 1.37% | -36.1 (-43.7 to -27.3) |
| Malaria | 8.7 (6.1 to 11.9) | 1.18% | -37.3 (-45.4 to -27.9) |
| Chagas disease | 0.1 (0.1 to 0.1) | 0.01% | -21.1 (-25.2 to -14.3) |
| Leishmaniasis | 0.1 (0.0 to 0.5) | 0.01% | -67.8 (-97.5 to -50.3) |
| (Visceral leishmaniasis) | 0.1 (0.0 to 0.5) | 0.01% | -67.8 (-97.5 to -50.3) |
| African trypanosomiasis (sleeping sickness) | 0.0 (0.0 to 0.1) | 0.00% | -82.8 (-96.0 to -34.3) |
| Schistosomiasis | 0.1 (0.1 to 0.1) | 0.01% | -28.5 (-32.7 to -23.7) |
| Cysticercosis | 0.0 (0.0 to 0.0) | 0.00% | -27.3 (-50.5 to 5.3) |
| Cystic echinococcosis | 0.0 (0.0 to 0.0) | 0.00% | -41.9 (-59.8 to -19.0) |
| Dengue | 0.5 (0.2 to 0.7) | 0.07% | 40.7 (3.6 to 69.7) |
| Yellow fever | 0.1 (0.0 to 0.2) | 0.01% | -23.3 (-34.4 to -9.6) |
| Rabies | 0.2 (0.1 to 0.2) | 0.03% | -54.8 (-63.8 to -45.0) |
| Intestinal nematode infections | 0.0 (0.0 to 0.1) | 0.00% | -47.2 (-59.5 to -30.1) |
| (Ascariasis) | 0.0 (0.0 to 0.1) | 0.00% | -47.2 (-59.5 to -30.1) |
| Ebola virus disease | 0.0 (0.0 to 0.0) | 0.00% | -98.4 (-98.4 to -98.4) |
| Zika virus disease | 0.0 (0.0 to 0.0) | 0.00% | - |
| Other neglected tropical diseases | 0.2 (0.1 to 0.5) | 0.03% | -3.7 (-18.3 to 13.9) |
| Other infectious diseases | 11.6 (10.1 to 13.3) | 1.57% | -33.8 (-39.3 to -27.4) |
| Meningitis | 4.0 (3.6 to 4.6) | 0.54% | -27.8 (-33.1 to -19.3) |
| Pneumococcal meningitis | 0.6 (0.5 to 0.7) | 0.08% | -22.4 (-28.9 to -12.4) |
| H influenzae type B meningitis | 1.1 (0.9 to 1.3) | 0.15% | -40.6 (-45.8 to -33.9) |
| Meningococcal infection | 0.4 (0.4 to 0.5) | 0.05% | -37.1 (-42.6 to -29.2) |
| Other meningitis | 2.0 (1.7 to 2.3) | 0.27% | -17.3 (-23.4 to -7.5) |
| Encephalitis | 1.2 (1.1 to 1.4) | 0.16% | -14.3 (-26.5 to -0.9) |
| Diphtheria | 0.1 (0.0 to 0.1) | 0.01% | -28.6 (-58.8 to 29.2) |
| Whooping cough (pertussis) | 1.4 (0.7 to 2.4) | 0.19% | -27.1 (-57.1 to 28.8) |
| Tetanus | 0.5 (0.4 to 0.7) | 0.07% | -59.6 (-69.3 to -45.0) |
| Measles | 1.4 (0.5 to 3.1) | 0.19% | -59.3 (-64.0 to -54.4) |
| Varicella (chickenpox) and herpes zoster (shingles) | 0.2 (0.2 to 0.2) | 0.03% | -29.2 (-34.7 to -23.4) |
| Acute hepatitis | 1.6 (1.2 to 1.9) | 0.22% | -24.5 (-29.2 to -18.4) |
| Acute hepatitis A | 0.3 (0.2 to 0.3) | 0.04% | -38.7 (-46.8 to -28.6) |
| Acute hepatitis B | 1.1 (0.8 to 1.3) | 0.15% | -19.6 (-25.4 to -12.4) |
| Acute hepatitis C | 0.0 (0.0 to 0.1) | 0.00% | -32.1 (-42.4 to -19.6) |
| Acute hepatitis E | 0.2 (0.1 to 0.2) | 0.03% | -25.8 (-35.3 to -15.6) |
| Other unspecified infectious diseases | 1.1 (0.8 to 1.2) | 0.15% | -13.4 (-17.5 to -8.1) |
| Maternal and neonatal disorders | 29.5 (28.2 to 30.8) | 4.00% | -26.6 (-29.3 to -23.5) |
| Maternal disorders | 2.5 (2.3 to 2.7) | 0.34% | -30.7 (-34.8 to -26.6) |
| Maternal haemorrhage | 0.5 (0.4 to 0.6) | 0.07% | -56.4 (-62.7 to -49.3) |
| Maternal sepsis and other pregnancy related infections (e.g. Postpartum infections) | 0.3 (0.2 to 0.3) | 0.04% | -33.5 (-44.2 to -22.6) |
| Maternal hypertensive disorders | 0.4 (0.3 to 0.4) | 0.05% | -13.0 (-27.3 to 2.6) |
| Maternal obstructed labour and uterine rupture | 0.2 (0.1 to 0.2) | 0.03% | -25.2 (-41.0 to -6.3) |
| Maternal abortive outcome | 0.2 (0.2 to 0.3) | 0.03% | -15.7 (-29.3 to -0.4) |
| Ectopic pregnancy | 0.1 (0.1 to 0.2) | 0.01% | -19.2 (-46.2 to 16.8) |
| Indirect maternal deaths | 0.4 (0.4 to 0.5) | 0.05% | -12.5 (-24.0 to -1.0) |
| Late maternal deaths | 0.0 (0.0 to 0.1) | 0.00% | -9.5 (-14.7 to -4.0) |
| Maternal deaths aggravated by HIV/AIDS | 0.0 (0.0 to 0.0) | 0.00% | -32.1 (-38.4 to -25.2) |
| Other maternal disorders | 0.3 (0.3 to 0.4) | 0.04% | -16.5 (-31.2 to 1.5) |
| Neonatal disorders | 27.1 (25.8 to 28.3) | 3.67% | -26.2 (-29.1 to -22.7) |
| Neonatal preterm birth | 9.9 (9.2 to 10.9) | 1.34% | -28.1 (-33.2 to -23.6) |
| Neonatal encephalopathy due to birth asphyxia and trauma | 8.1 (7.2 to 8.8) | 1.10% | -26.5 (-32.0 to -20.2) |
| Neonatal sepsis and other neonatal infections | 3.1 (2.7 to 4.1) | 0.42% | -14.4 (-22.7 to -4.4) |
| Hemolytic disease and other neonatal jaundice | 0.7 (0.7 to 0.8) | 0.09% | -39.3 (-46.8 to -30.2) |
| Other neonatal disorders | 5.3 (4.5 to 5.8) | 0.72% | -25.7 (-31.7 to -17.8) |
| Nutritional deficiencies | 3.8 (3.5 to 4.2) | 0.52% | -33.6 (-38.1 to -26.5) |
| Protein-energy malnutrition | 3.3 (3.0 to 3.7) | 0.45% | -34.6 (-39.4 to -27.5) |
| Other nutritional deficiencies | 0.5 (0.4 to 0.6) | 0.07% | -25.8 (-31.7 to -17.5) |
| II. Non-communicable diseases | 536.1 (528.4 to 542.2) | 72.67% | -7.9 (-8.8 to -7.0) |
| Cardiovascular diseases | 233.1 (229.7 to 236.4) | 31.60% | -10.3 (-11.4 to -9.3) |
| Rheumatic heart disease | 3.7 (3.4 to 3.9) | 0.50% | -21.3 (-25.2 to -17.8) |
| Ischaemic heart disease | 116.9 (115.1 to 119.7) | 15.85% | -9.7 (-11.0 to -8.7) |
| Stroke | 80.5 (78.9 to 82.6) | 10.91% | -13.6 (-15.0 to -12.1) |
| Ischaemic stroke | 36.6 (35.5 to 38.0) | 4.96% | -11.8 (-13.4 to -10.3) |
| Intracerebral hemorrhage | 38.2 (37.0 to 39.4) | 5.18% | -15.7 (-17.8 to -13.8) |
| Subarachnoid hemorrhage | 5.7 (5.3 to 6.3) | 0.77% | -9.4 (-13.1 to -4.9) |
| Hypertensive heart disease | 12.3 (9.0 to 13.2) | 1.67% | 7.5 (-7.3 to 16.3) |
| Non-rheumatic valvular heart disease | 2.0 (1.6 to 2.0) | 0.27% | -5.3 (-7.9 to -3.2) |
| Non-rheumatic calcific aortic valve disease | 1.4 (1.1 to 1.5) | 0.19% | -1.0 (-5.6 to 2.2) |
| Non-rheumatic degenerative mitral valve disease | 0.5 (0.4 to 0.6) | 0.07% | -14.0 (-18.1 to -8.6) |
| Other non-rheumatic valve diseases | 0.1 (0.1 to 0.1) | 0.01% | -17.8 (-28.5 to 8.0) |
| Cardiomyopathy and myocarditis | 4.8 (4.5 to 5.0) | 0.65% | -16.6 (-19.8 to -9.4) |
| Myocarditis | 0.6 (0.5 to 0.7) | 0.08% | -13.3 (-20.4 to -0.1) |
| Alcoholic cardiomyopathy | 1.1 (1.0 to 1.2) | 0.15% | -40.5 (-43.7 to -27.6) |
| Other cardiomyopathy | 3.1 (2.8 to 3.3) | 0.42% | -3.6 (-6.7 to -0.7) |
| Atrial fibrillation and flutter | 4.0 (3.9 to 4.2) | 0.54% | 2.6 (0.9 to 4.6) |
| Aortic aneurysm | 2.2 (2.1 to 2.3) | 0.30% | -8.5 (-11.2 to -5.8) |
| Peripheral vascular disease | 1.0 (0.6 to 1.7) | 0.14% | 10.5 (-6.8 to 24.1) |
| Endocarditis | 1.1 (1.0 to 1.2) | 0.15% | 1.0 (-4.0 to 5.0) |
| Other cardiovascular and circulatory diseases | 4.7 (4.4 to 5.1) | 0.64% | -7.9 (-10.9 to -5.9) |
| Neoplasms | 121.2 (119.1 to 122.9) | 16.43% | -4.4 (-5.6 to -3.3) |
| Lip and oral cavity cancer | 2.4 (2.3 to 2.5) | 0.33% | 4.0 (-0.6 to 8.0) |
| Nasopharynx cancer | 0.9 (0.8 to 0.9) | 0.12% | -3.0 (-6.4 to 0.4) |
| Other pharynx cancer | 1.4 (1.3 to 1.5) | 0.19% | 7.9 (-0.3 to 14.0) |
| Oesophageal cancer | 5.5 (5.3 to 5.6) | 0.75% | -14.5 (-16.9 to -12.0) |
| Stomach cancer | 11.0 (10.8 to 11.2) | 1.49% | -17.1 (-18.8 to -15.1) |
| Colon and rectum cancer | 11.5 (11.3 to 11.8) | 1.56% | -4.3 (-7.1 to -1.8) |
| Liver cancer | 10.2 (9.8 to 10.7) | 1.38% | -2.5 (-5.6 to 2.0) |
| (Liver cancer due to hepatitis B) | 4.0 (3.7 to 4.3) | 0.54% | -6.2 (-10.0 to 0.1) |
| (Liver cancer due to hepatitis C) | 3.0 (2.8 to 3.2) | 0.41% | -2.1 (-4.9 to 1.4) |
| (Liver cancer due to alcohol use) | 1.6 (1.4 to 1.8) | 0.22% | 0.6 (-3.0 to 4.8) |
| (Liver cancer due to NASH) | 0.8 (0.8 to 0.9) | 0.11% | 7.6 (4.4 to 11.7) |
| (Liver cancer due to other causes) | 0.8 (0.7 to 0.9) | 0.11% | -0.9 (-4.2 to 3.6) |
| Gallbladder and biliary tract cancer | 2.2 (2.0 to 2.4) | 0.30% | -6.7 (-9.4 to -4.0) |
| Pancreatic cancer | 5.6 (5.5 to 5.7) | 0.76% | 4.8 (2.5 to 6.8) |
| Larynx cancer | 1.6 (1.5 to 1.6) | 0.22% | -7.7 (-10.1 to -5.2) |
| Tracheal, bronchus, and lung cancer | 23.7 (23.3 to 24.2) | 3.21% | -2.0 (-4.3 to 0.1) |
| Malignant skin melanoma | 0.8 (0.6 to 0.9) | 0.11% | -5.1 (-8.5 to -2.5) |
| Non-melanoma skin cancer | 0.8 (0.8 to 0.9) | 0.11% | 2.7 (0.0 to 4.5) |
| (Non-melanoma skin cancer (squamous-cell carcinoma)) | 0.8 (0.8 to 0.9) | 0.11% | 2.7 (0.0 to 4.5) |
| Breast cancer | 7.6 (7.4 to 8.0) | 1.03% | -2.6 (-6.9 to 0.4) |
| Cervical cancer | 3.2 (3.0 to 3.3) | 0.43% | -7.2 (-11.7 to -4.0) |
| Uterine cancer | 1.1 (1.0 to 1.1) | 0.15% | -10.4 (-12.5 to -7.7) |
| Ovarian cancer | 2.2 (2.1 to 2.3) | 0.30% | -1.0 (-3.6 to 1.6) |
| Prostate cancer | 5.5 (4.7 to 6.5) | 0.75% | -2.5 (-4.9 to 1.9) |
| Testicular cancer | 0.1 (0.1 to 0.1) | 0.01% | -9.4 (-12.6 to -5.2) |
| Kidney cancer | 1.8 (1.6 to 1.8) | 0.24% | -1.3 (-4.3 to 1.7) |
| Bladder cancer | 2.6 (2.5 to 2.7) | 0.35% | -5.4 (-7.3 to -3.4) |
| Brain and nervous system cancer | 3.1 (2.7 to 3.3) | 0.42% | 3.8 (-1.0 to 7.0) |
| Thyroid cancer | 0.5 (0.5 to 0.6) | 0.07% | -1.2 (-4.5 to 2.0) |
| Mesothelioma | 0.4 (0.4 to 0.4) | 0.05% | -3.4 (-8.4 to 0.7) |
| Hodgkin lymphoma | 0.4 (0.4 to 0.5) | 0.05% | -16.8 (-19.8 to -14.0) |
| Non-Hodgkin's lymphoma | 3.2 (3.1 to 3.2) | 0.43% | 0.1 (-2.7 to 2.4) |
| Multiple myeloma | 1.4 (1.3 to 1.5) | 0.19% | -0.4 (-3.5 to 2.4) |
| Leukaemia | 4.5 (4.1 to 4.7) | 0.61% | -9.6 (-12.2 to -7.4) |
| Acute lymphoid leukaemia | 0.7 (0.6 to 0.7) | 0.09% | -1.5 (-11.6 to 6.2) |
| Chronic lymphoid leukaemia | 0.5 (0.4 to 0.5) | 0.07% | -10.3 (-13.0 to -7.6) |
| Acute myeloid leukaemia | 1.3 (1.2 to 1.3) | 0.18% | -1.0 (-6.6 to 3.0) |
| Chronic myeloid leukaemia | 0.3 (0.3 to 0.3) | 0.04% | -19.9 (-22.2 to -17.6) |
| Other leukaemia | 1.8 (1.6 to 1.9) | 0.24% | -15.6 (-18.7 to -12.1) |
| Other malignant cancers | 4.6 (4.2 to 4.8) | 0.62% | 0.1 (-2.6 to 2.2) |
| Other neoplasms | 1.3 (1.0 to 1.6) | 0.18% | 7.4 (2.1 to 15.8) |
| Myelodysplastic, myeloproliferative, and other hematopoietic neoplasms | 1.3 (1.0 to 1.5) | 0.18% | 7.1 (1.8 to 15.3) |
| Other benign and in situ neoplasms | 0.1 (0.0 to 0.1) | 0.01% | 15.5 (4.1 to 29.2) |
| Chronic respiratory diseases | 51.4 (49.7 to 53.1) | 6.97% | -14.2 (-16.5 to -11.5) |
| Chronic obstructive pulmonary disease | 42.2 (40.0 to 44.2) | 5.72% | -13.6 (-16.5 to -11.0) |
| Pneumoconiosis | 0.3 (0.3 to 0.3) | 0.04% | -16.7 (-20.8 to -12.4) |
| (Silicosis) | 0.1 (0.1 to 0.2) | 0.01% | -15.5 (-23.6 to -7.4) |
| (Asbestosis) | 0.0 (0.0 to 0.1) | 0.00% | -8.3 (-14.1 to -0.4) |
| (Coal workers pneumoconiosis) | 0.0 (0.0 to 0.1) | 0.00% | -26.6 (-33.8 to -16.7) |
| (Other pneumoconiosis) | 0.0 (0.0 to 0.1) | 0.00% | -17.5 (-24.1 to -5.0) |
| Asthma | 6.3 (4.3 to 8.2) | 0.85% | -23.9 (-28.1 to -17.2) |
| Interstitial lung disease and pulmonary sarcoidosis | 1.9 (1.5 to 2.4) | 0.26% | 11.4 (4.0 to 17.9) |
| Other chronic respiratory diseases | 0.7 (0.6 to 0.8) | 0.09% | -3.2 (-8.7 to 6.7) |
| Digestive diseases | 30.3 (29.2 to 32.1) | 4.11% | -10.7 (-13.1 to -7.3) |
| Cirrhosis and other chronic liver diseases | 16.5 (15.8 to 18.1) | 2.24% | -9.7 (-14.7 to -4.6) |
| Cirrhosis and other chronic liver diseases due to hepatitis B | 4.8 (4.3 to 5.5) | 0.65% | -14.3 (-20.2 to -7.3) |
| Cirrhosis and other chronic liver diseases due to hepatitis C | 4.2 (3.9 to 4.7) | 0.57% | -8.4 (-13.0 to -3.9) |
| Cirrhosis and other chronic liver diseases due to alcohol use | 4.1 (3.7 to 4.6) | 0.56% | -8.8 (-13.2 to -3.4) |
| Cirrhosis due to NASH | 1.5 (1.3 to 1.6) | 0.20% | -1.4 (-6.3 to 3.1) |
| Cirrhosis and other chronic liver diseases due to other causes | 1.9 (1.7 to 2.1) | 0.26% | -8.6 (-13.4 to -3.8) |
| Upper digestive system diseases | 3.8 (3.6 to 4.0) | 0.52% | -21.6 (-24.8 to -17.3) |
| Peptic ulcer disease | 3.1 (3.0 to 3.3) | 0.42% | -23.5 (-26.6 to -19.7) |
| Gastritis and duodenitis | 0.7 (0.6 to 0.7) | 0.09% | -11.7 (-17.6 to -2.2) |
| Appendicitis | 0.6 (0.5 to 0.6) | 0.08% | -17.0 (-21.5 to -10.7) |
| Paralytic ileus and intestinal obstruction | 3.2 (2.7 to 3.5) | 0.43% | -5.8 (-11.0 to 0.3) |
| Inguinal, femoral, and abdominal hernia | 0.6 (0.5 to 0.7) | 0.08% | -8.9 (-12.9 to -4.2) |
| Inflammatory bowel disease | 0.5 (0.4 to 0.5) | 0.07% | -10.5 (-16.0 to -5.9) |
| Vascular intestinal disorders | 1.3 (1.2 to 1.3) | 0.18% | -10.2 (-14.2 to -6.2) |
| Gallbladder and biliary diseases | 1.5 (1.4 to 1.6) | 0.20% | -5.0 (-7.5 to -1.7) |
| Pancreatitis | 1.3 (1.1 to 1.4) | 0.18% | -5.7 (-9.0 to -1.7) |
| Other digestive diseases | 1.2 (1.1 to 1.2) | 0.16% | -7.1 (-12.1 to -2.4) |
| Neurological disorders | 43.1 (42.3 to 43.7) | 5.84% | 0.1 (-1.2 to 1.3) |
| Alzheimer's disease and other dementias | 35.4 (34.8 to 35.9) | 4.80% | 0.6 (-0.9 to 1.8) |
| Parkinson's disease | 4.6 (4.4 to 4.8) | 0.62% | 0.8 (-2.8 to 3.0) |
| Epilepsy | 1.7 (1.5 to 2.0) | 0.23% | -10.7 (-15.4 to -0.5) |
| Multiple sclerosis | 0.3 (0.2 to 0.3) | 0.04% | -3.9 (-14.5 to 0.4) |
| Motor neuron disease | 0.4 (0.4 to 0.5) | 0.05% | 1.2 (-2.4 to 4.5) |
| Other neurological disorders | 0.7 (0.7 to 0.8) | 0.09% | 2.0 (-3.9 to 6.8) |
| Mental disorders | 0.0 (0.0 to 0.0) | 0.00% | 7.5 (-1.4 to 15.9) |
| Eating disorders | 0.0 (0.0 to 0.0) | 0.00% | 7.5 (-1.4 to 15.9) |
| Anorexia nervosa | 0.0 (0.0 to 0.0) | 0.00% | 5.5 (-4.1 to 14.4) |
| Bulimia nervosa | 0.0 (0.0 to 0.0) | 0.00% | 13.5 (1.0 to 26.2) |
| Substance use disorders | 4.3 (4.1 to 4.5) | 0.58% | 2.0 (-1.0 to 5.0) |
| Alcohol use disorders | 2.3 (2.0 to 2.4) | 0.31% | -16.5 (-20.4 to -12.4) |
| Drug use disorders | 2.1 (2.0 to 2.1) | 0.28% | 34.1 (31.4 to 36.9) |
| Opioid use disorders | 1.4 (1.3 to 1.4) | 0.19% | 49.4 (42.5 to 59.2) |
| Cocaine use disorders | 0.1 (0.1 to 0.1) | 0.01% | 19.6 (9.2 to 33.0) |
| Amphetamine use disorders | 0.1 (0.0 to 0.1) | 0.01% | 8.7 (-14.0 to 20.7) |
| Other drug use disorders | 0.6 (0.5 to 0.6) | 0.08% | 11.3 (1.2 to 19.9) |
| Diabetes and kidney diseases | 33.6 (32.9 to 34.3) | 4.55% | 1.3 (-0.3 to 2.7) |
| Diabetes mellitus | 17.5 (17.1 to 17.9) | 2.37% | 1.2 (-0.7 to 3.1) |
| Diabetes mellitus type 1 | 4.3 (4.0 to 4.7) | 0.58% | -11.0 (-14.6 to -7.8) |
| Diabetes mellitus type 2 | 13.2 (12.7 to 13.7) | 1.79% | 5.9 (4.1 to 8.0) |
| Chronic kidney disease | 15.9 (15.5 to 16.3) | 2.16% | 1.5 (-0.9 to 3.2) |
| Chronic kidney disease due to diabetes mellitus type 1 | 0.9 (0.8 to 1.2) | 0.12% | -1.2 (-4.0 to 1.2) |
| Chronic kidney disease due to diabetes mellitus type 2 | 4.5 (4.0 to 5.1) | 0.61% | 4.2 (1.4 to 6.2) |
| Chronic kidney disease due to hypertension | 4.6 (4.0 to 5.2) | 0.62% | 3.2 (0.4 to 5.2) |
| Chronic kidney disease due to glomerulonephritis | 2.4 (2.1 to 2.8) | 0.33% | -1.3 (-3.2 to 0.7) |
| Chronic kidney disease due to other and unspecified causes | 3.4 (3.0 to 3.9) | 0.46% | -1.4 (-3.7 to 0.6) |
| Acute glomerulonephritis | 0.1 (0.1 to 0.2) | 0.01% | -9.5 (-14.5 to -3.5) |
| Skin and subcutaneous diseases | 1.3 (0.9 to 1.7) | 0.18% | 8.1 (2.7 to 16.5) |
| Bacterial skin diseases | 1.0 (0.6 to 1.3) | 0.14% | 12.7 (6.0 to 20.7) |
| (Cellulitis) | 0.2 (0.1 to 0.3) | 0.03% | 19.6 (9.8 to 28.2) |
| (Pyoderma) | 0.8 (0.5 to 0.9) | 0.11% | 10.5 (3.2 to 19.0) |
| Decubitus ulcer | 0.3 (0.2 to 0.4) | 0.04% | -5.1 (-12.2 to 9.2) |
| Other skin and subcutaneous diseases | 0.1 (0.0 to 0.1) | 0.01% | 3.3 (-3.5 to 14.4) |
| Musculoskeletal disorders | 1.6 (1.4 to 1.6) | 0.22% | -0.1 (-4.4 to 3.2) |
| Rheumatoid arthritis | 0.6 (0.5 to 0.7) | 0.08% | -5.9 (-12.9 to -1.2) |
| Other musculoskeletal disorders | 1.0 (0.9 to 1.0) | 0.14% | 3.9 (0.9 to 7.5) |
| Other non-communicable diseases | 16.3 (15.5 to 17.1) | 2.21% | -11.2 (-15.3 to -8.5) |
| Congenital anomalies | 8.7 (8.2 to 9.2) | 1.18% | -18.2 (-24.7 to -14.1) |
| Neural tube defects | 0.9 (0.7 to 1.3) | 0.12% | -16.5 (-27.6 to -4.8) |
| Congenital heart anomalies | 3.9 (3.2 to 4.6) | 0.53% | -21.8 (-28.1 to -14.1) |
| Orofacial clefts | 0.1 (0.0 to 0.1) | 0.01% | -41.9 (-55.9 to -25.1) |
| Down syndrome | 0.4 (0.3 to 0.5) | 0.05% | -5.2 (-14.2 to 7.0) |
| Other chromosomal abnormalities | 0.3 (0.2 to 0.4) | 0.04% | 0.3 (-10.1 to 13.2) |
| Congenital musculoskeletal and limb anomalies | 0.2 (0.1 to 0.2) | 0.03% | -12.8 (-20.9 to -4.5) |
| Urogenital congenital anomalies | 0.2 (0.1 to 0.2) | 0.03% | -8.5 (-17.1 to 2.1) |
| Digestive congenital anomalies | 0.8 (0.6 to 1.1) | 0.11% | -19.3 (-29.8 to -9.8) |
| Other congenital anomalies | 2.1 (1.5 to 2.6) | 0.28% | -15.9 (-23.3 to -4.5) |
| Urinary diseases and male infertility | 3.6 (3.5 to 3.7) | 0.49% | 5.7 (2.2 to 8.5) |
| Urinary tract infections | 2.7 (2.6 to 3.0) | 0.37% | 10.9 (7.2 to 14.5) |
| Urolithiasis (Kidney stone disease) | 0.2 (0.1 to 0.2) | 0.03% | -1.2 (-9.7 to 12.9) |
| Other urinary diseases | 0.7 (0.6 to 0.8) | 0.09% | -9.9 (-15.3 to -2.2) |
| Gynecological diseases | 0.1 (0.1 to 0.1) | 0.01% | -2.6 (-13.6 to 6.0) |
| Uterine fibroids | 0.0 (0.0 to 0.0) | 0.00% | 8.1 (-14.9 to 24.7) |
| Polycystic ovarian syndrome | 0.0 (0.0 to 0.0) | 0.00% | 1.0 (-22.5 to 34.8) |
| Endometriosis | 0.0 (0.0 to 0.0) | 0.00% | -3.2 (-23.8 to 25.5) |
| Genital prolapse | 0.0 (0.0 to 0.0) | 0.00% | -24.1 (-36.0 to -13.0) |
| Other gynecological diseases | 0.1 (0.1 to 0.1) | 0.01% | -3.6 (-12.2 to 5.9) |
| Hemoglobinopathies and hemolytic anaemias | 1.4 (1.1 to 1.8) | 0.19% | -11.3 (-17.6 to -4.8) |
| Thalassemias | 0.1 (0.1 to 0.1) | 0.01% | -27.9 (-36.5 to -17.2) |
| Sickle cell disorders | 0.5 (0.3 to 0.8) | 0.07% | -3.1 (-17.6 to 10.3) |
| G6PD deficiency | 0.2 (0.2 to 0.3) | 0.03% | -7.1 (-12.1 to -1.0) |
| Other hemoglobinopathies and hemolytic anaemias | 0.6 (0.5 to 0.6) | 0.08% | -16.1 (-18.7 to -13.4) |
| Endocrine, metabolic, blood, and immune disorders | 1.9 (1.5 to 2.0) | 0.26% | 0.8 (-5.0 to 4.4) |
| Sudden infant death syndrome | 0.6 (0.3 to 1.2) | 0.08% | -20.2 (-31.2 to -4.9) |
| III. Injuries | 57.9 (55.9 to 59.2) | 7.85% | -13.7 (-15.1 to -12.2) |
| Transport injuries | 17.0 (16.4 to 17.4) | 2.30% | -17.0 (-19.5 to -14.9) |
| Road injuries | 15.8 (15.2 to 16.3) | 2.14% | -17.1 (-19.7 to -14.9) |
| Pedestrian road injuries | 6.2 (5.9 to 6.8) | 0.84% | -21.4 (-25.5 to -17.9) |
| Cyclist road injuries | 0.9 (0.7 to 1.0) | 0.12% | -8.8 (-14.8 to -2.5) |
| Motorcyclist road injuries | 2.9 (2.5 to 3.0) | 0.39% | -12.4 (-19.5 to -7.3) |
| Motor vehicle road injuries | 5.8 (5.4 to 6.0) | 0.79% | -15.6 (-18.6 to -12.2) |
| Other road injuries | 0.1 (0.1 to 0.2) | 0.01% | -19.4 (-24.1 to -1.3) |
| Other transport injuries | 1.2 (1.1 to 1.4) | 0.16% | -15.5 (-19.5 to -10.9) |
| Unintentional injuries | 23.8 (22.4 to 24.7) | 3.23% | -15.3 (-17.3 to -12.8) |
| Falls | 9.2 (8.5 to 9.8) | 1.25% | -2.8 (-7.4 to 3.4) |
| Drowning | 4.0 (3.8 to 4.1) | 0.54% | -27.3 (-29.6 to -24.5) |
| Fire, heat, and hot substances | 1.6 (1.3 to 1.7) | 0.22% | -22.9 (-25.4 to -17.3) |
| Poisonings | 0.9 (0.7 to 1.0) | 0.12% | -20.8 (-28.4 to -12.5) |
| (Poisoning by carbon monoxide) | 0.5 (0.3 to 0.5) | 0.07% | -26.6 (-34.8 to -20.3) |
| (Poisoning by other means) | 0.5 (0.4 to 0.5) | 0.07% | -14.4 (-22.4 to -3.9) |
| Exposure to mechanical forces | 1.8 (1.5 to 1.8) | 0.24% | -20.3 (-22.9 to -17.8) |
| (Unintentional firearm injuries) | 0.3 (0.3 to 0.3) | 0.04% | -16.4 (-20.3 to -11.5) |
| (Other exposure to mechanical forces) | 1.5 (1.2 to 1.6) | 0.20% | -21.0 (-23.7 to -18.3) |
| Adverse effects of medical treatment | 1.6 (1.4 to 1.8) | 0.22% | -6.2 (-10.0 to -2.5) |
| Animal contact | 1.1 (0.6 to 1.2) | 0.15% | -16.0 (-20.5 to -9.6) |
| (Venomous animal contact) | 0.9 (0.5 to 1.1) | 0.12% | -16.0 (-21.0 to -9.7) |
| (Non-venomous animal contact) | 0.1 (0.1 to 0.2) | 0.01% | -16.1 (-27.4 to -6.2) |
| Foreign body | 1.7 (1.6 to 1.8) | 0.23% | -14.1 (-17.0 to -11.6) |
| (Pulmonary aspiration and foreign body in airway) | 1.6 (1.5 to 1.7) | 0.22% | -13.9 (-17.0 to -11.4) |
| (Foreign body in other body part) | 0.1 (0.1 to 0.1) | 0.01% | -15.8 (-20.8 to -10.0) |
| Environmental heat and cold exposure | 0.7 (0.5 to 0.8) | 0.09% | -29.4 (-37.1 to -25.4) |
| Exposure to forces of nature | 0.1 (0.1 to 0.1) | 0.01% | -45.8 (-45.8 to -45.8) |
| Other unintentional injuries | 1.2 (1.2 to 1.3) | 0.16% | -25.8 (-27.6 to -23.8) |
| Self-harm and interpersonal violence | 17.1 (16.3 to 17.5) | 2.32% | -7.6 (-9.9 to -5.5) |
| Self-harm | 10.0 (9.4 to 10.3) | 1.36% | -14.8 (-18.0 to -12.6) |
| Self-harm by firearm | 0.8 (0.7 to 1.0) | 0.11% | -10.3 (-13.9 to -7.2) |
| Self-harm by other specified means | 9.2 (8.5 to 9.5) | 1.25% | -15.2 (-18.4 to -12.8) |
| Interpersonal violence | 5.2 (4.7 to 5.5) | 0.70% | -11.1 (-13.3 to -8.7) |
| Assault by firearm | 2.2 (1.9 to 2.4) | 0.30% | -3.6 (-6.5 to -0.5) |
| Assault by sharp object | 1.2 (0.9 to 1.4) | 0.16% | -22.3 (-25.6 to -17.6) |
| Assault by other means | 1.8 (1.6 to 2.1) | 0.24% | -11.5 (-15.4 to -7.6) |
| Conflict and terrorism | 1.7 (1.7 to 1.7) | 0.23% | 98.4 (98.4 to 98.5) |
| Executions and police conflict | 0.2 (0.2 to 0.2) | 0.03% | 172.4 (156.8 to 187.6) |
Underlying causes
Causes of death can be structured into immediate causes of death or primary causes of death, conditions leading to cause of death, underlying causes, and further relevant conditions that may have contributed to fatal outcome.[7]
According to the WHO, underlying causes are "the disease[s] or injury[ies] which initiated the train[s] of morbid events leading directly to death, or the circumstances of the accident or violence which produced the fatal injury".[8]
Malnutrition
Malnutrition can be identified as an underlying cause for shortened life.[9] 70% of childhood deaths (age 0–4) are reportedly due to diarrheal illness, acute respiratory infection, malaria and immunizable disease. However 56% of these childhood deaths can be attributed to the effects of malnutrition as an underlying cause.[10] The effects of malnutrition include increased susceptibility to infection,[11] musculature wasting, skeletal deformities and neurologic development delays.[12] According to the World Health Organization, malnutrition is named as the biggest contributor to child mortality[13] with 36 million deaths in 2005 related to malnutrition.[14]
Obesity and unhealthy diets
Beyond undernutrition and micronutrient deficiencies, malnutrition also includes obesity,[15] which predisposes towards several chronic diseases, including 13 different types of cancer, cardiovascular diseases, and type 2 diabetes.[16][17][18][19][20][21][22] According to the WHO, being "chronically overweight and obesity are among the leading causes of death and disability in Europe", with estimates suggesting they cause more than 1.2 million deaths annually, corresponding to over 13% of total mortality in the region.[22] Various types of health policy could counter the trend and reduce obesity.[23]
Diets, not just in terms of obesity but also of food composition, can have a major impact on underlying factors , with reviews suggesting i.a. that a 20-years old male in Europe who switches to the "optimal diet" could gain a mean of ~13.7 years of life and a 60-years old female in the U.S. switching to the "optimal diet" could gain a mean of ~8.0 years of life. It found the largest gains would be made by eating more legumes, whole grains, and nuts, and less red meat and processed meat. It also contains no consumption of sugar-sweetened beverages (moving from "typical Western diet" of 500 g/day to 0 g/day).[24][25]
Pollution
A review concluded that, like in 2015, pollution (¾ from air pollution) was responsible for 9 million premature deaths in 2019 (one in six deaths). It concluded that little real progress against pollution can be identified.[26][27]
Air pollution
Overall, air pollution causes the deaths of around ca. 7 million people worldwide each year, and is the world's largest single environmental health risk, according to the WHO (2012) and the IEA (2016).[28][29][30]
The IEA notes that many of root causes and cures can be found in the energy industry and suggests solutions such as retiring polluting coal-fired power plants and to establishing stricter standards for motor vehicles.[30] In September 2020 the European Environment Agency reported that environmental factors such as air pollution and heatwaves contributed to around 13% of all human deaths in EU countries in 2012 (~630,000).[31] A 2021 study using a high spatial resolution model and an updated concentration-response function finds that 10.2 million global excess deaths in 2012 and 8.7 million in 2018 – or a fifth – were due to air pollution generated by fossil fuel combustion, significantly higher than earlier estimates and with spatially subdivided mortality impacts.[32][33]
A 2020 study indicates that the global mean loss of life expectancy (LLE) from air pollution in 2015 was 2.9 years, substantially more than, for example, 0.3 years from all forms of direct violence, albeit a significant fraction of the LLE is considered to be unavoidable.[34]
Uses of nervous system drugs
According to the WHO, worldwide, about 0.5 million deaths are attributable to uses of drugs, with more than 70% of these being related to opioids, with overdose being the direct cause of more than 30% of those deaths.[35]
Various uses of various opioids accounts for many deaths worldwide, termed opioid epidemic. Nearly 75% of the 91,799 drug overdose deaths in 2020 in the United States involved an opioid.[36]
Not all nervous system drugs are associated with risks for contributing to deaths as an underlying factor or for uses that are. In some cases, potentially harmful or harmful drugs can be substituted or weaned off with the help of pharmacological alternatives – such as potentially NAC and modafinil in the case of cocaine dependence[37] – whose uses are not considered to be underlying causes of deaths. In some cases, they – including caffeine – can help improve general health such as, directly and indirectly, physical fitness and mental health either in general or in specific ranges of informed administrations.
Smoking
Smoking is the leading cause of preventable death in the United States. It's an underlying cause of many cancers, cardiovascular diseases, stroke, and respiratory diseases.[38]
Smoking usually refers to smoking of tobacco products. E-cigarettes also pose large risks to health.[39] The health impacts of tobacco-alternative products such as various herbs and the use of charcoal filters[40][41] are often investigated less, with existing research suggesting only limited benefits over tobacco smoking. Some smokers may benefit from switching to a vaporizer as a harm reduction measure if they do not quit, which however also only has little robust evidence.[42][43][44] Frequency of use is a major factor in the level of risks[39] or permanence and extent of health impacts.
A review found smoking and second-hand smoke to be a global underlying cause of death as large as pollution, which in that analysis was the largest major underlying factor.[26]
Alcohol
Globally, alcohol use was the seventh leading risk factor for both deaths and DALY in 2016. A review found that the "risk of all-cause mortality, and of cancers specifically, rises with increasing levels of consumption, and the level of consumption that minimises health loss is zero".[45]
Non-optimal ambient temperatures
A study found that 9.4% of global deaths between 2000 and 2019 – ~5 million annually – can be attributed to extreme temperature with cold-related ones making up the larger share and decreasing and heat-related ones making up ~0.91 % and increasing. Incidences of heart attacks, cardiac arrests and strokes increase under such conditions.[46][47]
Antimicrobial resistance
In a global assessment, scientists reported, based on medical records, that antibiotic resistance may have contributed to ~4.95 million (3.62–6.57) deaths in 2019, with 1.3 M directly attributed – the latter being more than deaths than from e.g. AIDS or Malaria,[48][49] despite being project to rise substantially.[50]
Comorbidities, general health, social factors and infectious diseases
Co-existing diseases can but don't necessarily contribute to death[51] to various degrees in various ways.
In some cases, comorbidities can be major causes with complex underlying mechanisms, and a range of comorbidities can be present once.[52]
Pandemics[53][54] and infectious diseases or epidemics can be major underlying causes of deaths. In a small study of 26 decedents, the pandemized COVID-19 and infection-related disease were "major contributors" to patients' death.[7] Such deaths are sometimes evaluated via excess deaths per capita – the COVID-19 pandemic deaths between Jan 1, 2020, and Dec 31, 2021 are estimated to be ~18.2 million. Research could help distinguish the proportions directly caused by COVID-19 from those caused by indirect consequences of the pandemic.[55][56]
Mental health issues and related issues such as economic conditions[57] and/or various uses of nervous system drugs can contribute to causes such as suicide[58][59] or risky behavior related deaths.
Loneliness or insufficient social relationships is also a major underlying factor, which may be comparable to smoking and, according to one meta-analysis of 148 studies, "exceeds many well-known risk factors for mortality (e.g., obesity, physical inactivity)".[60] Injuries and violence are "the leading causes of death among children, adolescents, and young adults in the US" with underlying risk factors for such including "detrimental community, family, or individual circumstances" that increase the likelihood of violence. Types of preventive measures may include support of "healthy development of individuals, families, schools, and communities, and build[ing] capacity for positive relationships and interactions".[61]
Lifestyle factors[62] – including physical inactivity,[63] and tobacco smoking and excessive alcohol use
Aging
Traditionally aging is not considered as a cause of death. It is believed that there is always a more direct cause, and usually it is one of many age-related diseases. It is estimated that, as a root cause, the aging process underlies 2/3 of all death in the world (approximately 100,000 people per day in 2007). In highly developed countries this proportion can reach 90%.[67] There are requests of granting aging an official status of a disease and treating it directly (such as via dietary changesEconomics and policies
Economics and policies may be factors underlying deaths at a more fundamental level. For example, economics may result in certain therapies or screenings being expensive rather than produced at an affordable price or medication costs being too high for an individual to afford them even if they are made available at low cost, poverty can affect nutrition, marketing can increase the consumption of unhealthy products, incentives and regulations for health and healthy environments may be weak or missing, and occupational safety and humans' environment can suffer due to economic pressures for low production costs and high consumption. Health policy and health systems can have impacts on deaths and thereby may also be a factor of deaths, also including for example education policy (e.g. health illiteracy), climate policy (e.g. future water scarcity impacts) and transportation policy (e.g. motor vehicle accidents, pollution and physical activity), as well as in/action on policy-influenceable physical inactivity.[73] 'Recent financial difficulties' appears to be a factor of mortality.[74] One study estimated how many people die from poverty in the U.S.[75] Low socioeconomic status, as determined by economics, appears to reduce life expectancy.[76] The current systemic incentive for maximized profits may inhibit global occupational health and safety.[77] The negative externality of environmental damages can have substantial impacts on global healthcare.[78]
Underlying factors by cause

Underlying factors can also be analyzed per cause of (or major contributor to) death and can be distinguished between "preventable" factors and other factors. For example, various Global Burden of Disease Studies investigate such factors and quantify recent developments – one such systematic analysis analyzed the (non)progress on cancer and its causes during the 2010-19 decade, indicating that 2019, ~44% of all cancer deaths – or ~4.5 M deaths or ~105 million lost disability-adjusted life years – were due to known clearly preventable risk factors, led by smoking, alcohol use and high BMI.[79]
Determination and tracking of underlying factors
Electronic health records,[80][81][49] death certificates[82][51][83][84] as well as post-mortem analyses (such as post-mortem computed tomography and other other pathology)[85] can and are often used to investigate underlying causes of deaths such as for mortality statistics,[86][87] relevant to progress measurements.[88] Improvements to this reporting, where e.g. certain diseases are often under-reported or underlying cause-of-death (COD) statement are incorrect,[89][90][91] could ultimately improve public health.[92][93] One reason for this is that from "a public health point of view, preventing this first disease or injury will result in the greatest health gain".[88]
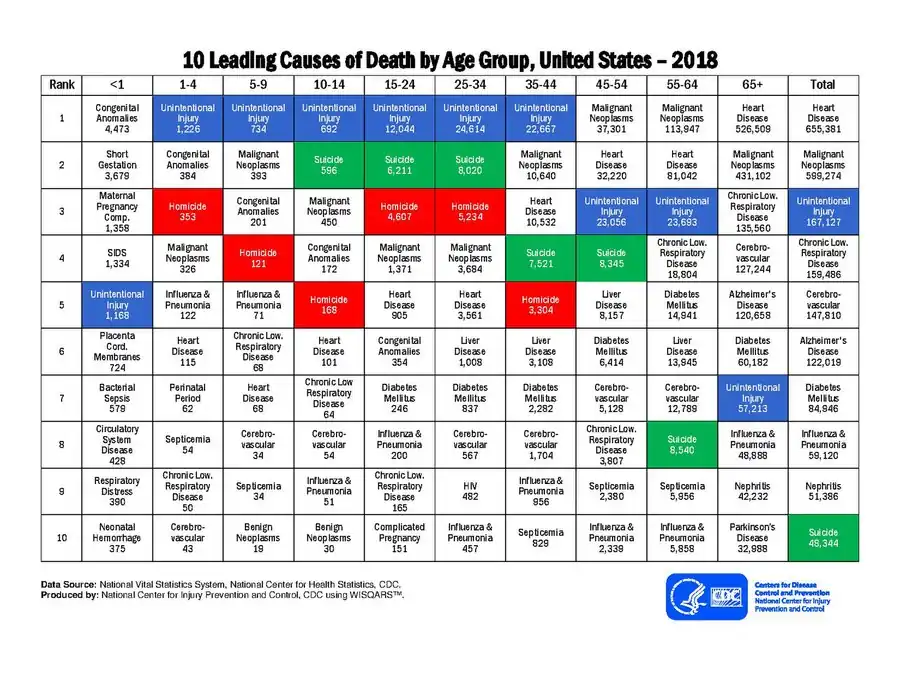
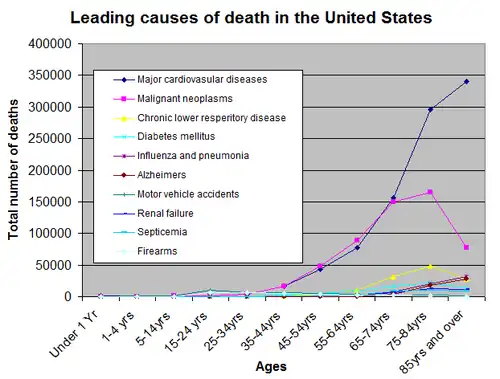
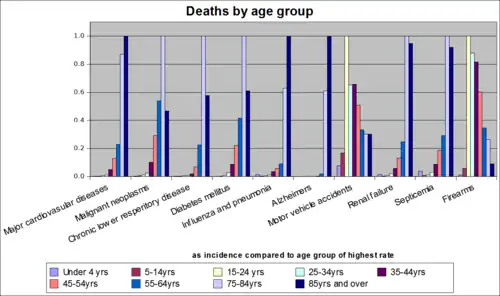
By age group (U.S.)
.png.webp)
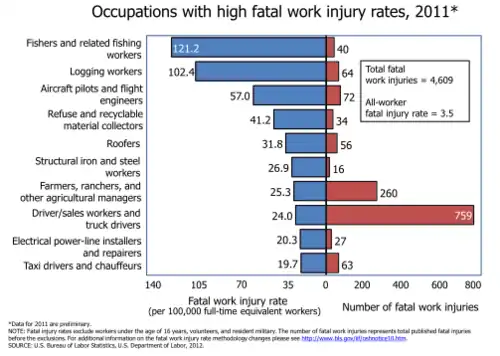
By occupation (U.S.)
With an average of 123.6 deaths per 100,000 from 2003 through 2010 the most dangerous occupation in the United States is the cell tower construction industry.[96]
See also
- Capital punishment by country
- Epidemiology of suicide
- List of countries by intentional homicide rate
- List of killings by law enforcement officers by country
- List of sovereign states and dependent territories by mortality rate
- List of terrorist incidents
- List of unusual deaths
- List of wars and anthropogenic disasters by death toll (with links to many by-country and by-type detail lists)
- Pollutants
- Preventable causes of death
- Medical error
References
- ↑ WHO (2005). "Cancer". Archived from the original on May 18, 2020.
- ↑ Lozano, Rafael; et al. (Dec 2012). "Global and regional mortality from 235 causes of death for 20 age groups in 1990 and 2010: a systematic analysis for the Global Burden of Disease Study 2010" (PDF). Lancet. 380 (9859): 2095–128. doi:10.1016/S0140-6736(12)61728-0. hdl:10536/DRO/DU:30050819. PMID 23245604. S2CID 1541253. Archived from the original (PDF) on February 11, 2020.
- ↑ "World Health Organization, "The top 10 causes of death"". Archived from the original on 2021-09-24. Retrieved 2023-04-13.
- ↑ GBD 2017 Causes of Death Collaborators. "Global, regional, and national age-sex-specific mortality for 282 causes of death in 195 countries and territories, 1980–2017: a systematic analysis for the Global Burden of Disease Study 2017". The Lancet. 8 Nov 2018; 392:1736–88. doi:10.1016/S0140-6736(18)32203-7. Table 1.
- ↑ Ikuta, Kevin S.; Swetschinski, Lucien R.; Aguilar, Gisela Robles; Sharara, Fablina; Mestrovic, Tomislav; Gray, Authia P.; Weaver, Nicole Davis; Wool, Eve E.; et al. (21 November 2022). "Global mortality associated with 33 bacterial pathogens in 2019: a systematic analysis for the Global Burden of Disease Study 2019". The Lancet. 400 (10369): 2221–2248. doi:10.1016/S0140-6736(22)02185-7. ISSN 0140-6736. PMC 9763654. PMID 36423648.
{{cite journal}}: Check|pmc=value (help) - ↑ "Cause of Death". UC Atlas of Global Inequality. University of California, Santa Cruz. 18 February 2004. Archived from the original on 18 June 2014. Retrieved 2014-06-09.
- 1 2 Elezkurtaj, Sefer; Greuel, Selina; Ihlow, Jana; Michaelis, Edward Georg; Bischoff, Philip; Kunze, Catarina Alisa; Sinn, Bruno Valentin; Gerhold, Manuela; Hauptmann, Kathrin; Ingold-Heppner, Barbara; Miller, Florian; Herbst, Hermann; Corman, Victor Max; Martin, Hubert; Radbruch, Helena; Heppner, Frank L.; Horst, David (December 2021). "Causes of death and comorbidities in hospitalized patients with COVID-19". Scientific Reports. 11 (1): 4263. Bibcode:2021NatSR..11.4263E. doi:10.1038/s41598-021-82862-5. PMC 7895917. PMID 33608563.
- ↑ "Cause of death". www.who.int. Archived from the original on 10 July 2022. Retrieved 7 July 2022.
- ↑ "Mortality In Second And Third Degree Malnutrition". Tropej.oxfordjournals.org. 2014-06-03. Archived from the original on 2016-01-31. Retrieved 2014-06-09.
- ↑ Pelletier DL, Frongillo EA, Schroeder DG, Habicht JP (2014-01-24). "The effects of malnutrition on child mortality in developing countries". Bull. World Health Organ. 73 (4): 443–48. PMC 2486780. PMID 7554015.
- ↑ Faulk, W. Page; Demaeyer, E. M.; Davies, A. J. S. (1974-06-01). "Some effects of malnutrition on the immune response in man". The American Journal of Clinical Nutrition. Ajcn.nutrition.org. 27 (6): 638–646. doi:10.1093/ajcn/27.6.638. PMID 4208451. Archived from the original on 2017-02-26. Retrieved 2014-06-09.
- ↑ Grover, Zubin; Ee, Looi C. (October 2009). "Elsevier". Pediatric Clinics. Pediatric.theclinics.com. 56 (5): 1055–1068. doi:10.1016/j.pcl.2009.07.001. PMID 19931063. Archived from the original on 2014-03-18. Retrieved 2014-06-09.
- ↑ Stay informed today; every day (2008-01-24). "Malnutrition: The starvelings". The Economist. Archived from the original on 2017-09-23. Retrieved 2014-06-09.
- ↑ Ziegler, Jean (2007). L'Empire de la honte. Fayard
- ↑ "Fact sheets - Malnutrition". www.who.int. Archived from the original on 16 July 2022. Retrieved 7 July 2022.
- ↑ Goossens, Gijs H. (2017). "The Metabolic Phenotype in Obesity: Fat Mass, Body Fat Distribution, and Adipose Tissue Function". Obesity Facts. 10 (3): 207–215. doi:10.1159/000471488. PMC 5644968. PMID 28564650. S2CID 4306910.
- ↑ Avgerinos, Konstantinos I.; Spyrou, Nikolaos; Mantzoros, Christos S.; Dalamaga, Maria (March 2019). "Obesity and cancer risk: Emerging biological mechanisms and perspectives". Metabolism. 92: 121–135. doi:10.1016/j.metabol.2018.11.001. PMID 30445141. S2CID 53568407.
- ↑ Friedenreich, Christine M.; Ryder‐Burbidge, Charlotte; McNeil, Jessica (March 2021). "Physical activity, obesity and sedentary behavior in cancer etiology: epidemiologic evidence and biologic mechanisms". Molecular Oncology. 15 (3): 790–800. doi:10.1002/1878-0261.12772. ISSN 1574-7891. PMC 7931121. PMID 32741068.
- ↑ Kim, Dae-Seok; Scherer, Philipp E. (22 November 2021). "Obesity, Diabetes, and Increased Cancer Progression". Diabetes & Metabolism Journal. 45 (6): 799–812. doi:10.4093/dmj.2021.0077. ISSN 2233-6079. PMC 8640143. PMID 34847640.
- ↑ Jayedi, Ahmad; Soltani, Sepideh; Zargar, Mahdieh Sadat; Khan, Tauseef Ahmad; Shab-Bidar, Sakineh (23 September 2020). "Central fatness and risk of all cause mortality: systematic review and dose-response meta-analysis of 72 prospective cohort studies". BMJ. 370: m3324. doi:10.1136/bmj.m3324. ISSN 1756-1833. PMC 7509947. PMID 32967840.
- ↑ Powell-Wiley, Tiffany M.; Poirier, Paul; Burke, Lora E.; Després, Jean-Pierre; Gordon-Larsen, Penny; Lavie, Carl J.; Lear, Scott A.; Ndumele, Chiadi E.; Neeland, Ian J.; Sanders, Prashanthan; St-Onge, Marie-Pierre (25 May 2021). "Obesity and Cardiovascular Disease: A Scientific Statement From the American Heart Association". Circulation. 143 (21): e984–e1010. doi:10.1161/CIR.0000000000000973. PMC 8493650. PMID 33882682. S2CID 233349410.
- 1 2 "WHO warns of worsening obesity 'epidemic' in Europe". UN News. 3 May 2022. Archived from the original on 10 July 2022. Retrieved 6 July 2022.
- ↑ Agha, Maliha; Agha, Riaz (22 June 2017). "The rising prevalence of obesity: part B—public health policy solutions". International Journal of Surgery: Oncology. 2 (7): e19. doi:10.1097/ij9.0000000000000019. PMC 5673155. PMID 29177229.
- ↑ Fadnes LT, Økland JM, Haaland ØA, Johansson KA (February 2022). "Estimating impact of food choices on life expectancy: A modeling study". PLOS Medicine. 19 (2): e1003889. doi:10.1371/journal.pmed.1003889. PMC 8824353. PMID 35134067. S2CID 246676734. Lay summary: "Changing your diet could add up to a decade to life expectancy, study finds". Public Library of Science. Archived from the original on 14 March 2022. Retrieved 16 March 2022.
- ↑ Longo VD, Anderson RM (April 2022). "Nutrition, longevity and disease: From molecular mechanisms to interventions". Cell. 185 (9): 1455–1470. doi:10.1016/j.cell.2022.04.002. PMC 9089818. PMID 35487190.
{{cite journal}}: CS1 maint: PMC embargo expired (link) - 1 2 Dickie, Gloria (18 May 2022). "Pollution killing 9 million people a year, Africa hardest hit - study". Reuters. Archived from the original on 23 June 2022. Retrieved 23 June 2022.
- ↑ Fuller, Richard; Landrigan, Philip J; Balakrishnan, Kalpana; Bathan, Glynda; Bose-O'Reilly, Stephan; Brauer, Michael; Caravanos, Jack; Chiles, Tom; Cohen, Aaron; Corra, Lilian; Cropper, Maureen; Ferraro, Greg; Hanna, Jill; Hanrahan, David; Hu, Howard; Hunter, David; Janata, Gloria; Kupka, Rachael; Lanphear, Bruce; Lichtveld, Maureen; Martin, Keith; Mustapha, Adetoun; Sanchez-Triana, Ernesto; Sandilya, Karti; Schaefli, Laura; Shaw, Joseph; Seddon, Jessica; Suk, William; Téllez-Rojo, Martha María; Yan, Chonghuai (June 2022). "Pollution and health: a progress update". The Lancet Planetary Health. 6 (6): e535–e547. doi:10.1016/S2542-5196(22)00090-0. PMID 35594895. S2CID 248905224.
- ↑ "7 million premature deaths annually linked to air pollution". WHO. 25 March 2014. Archived from the original on March 26, 2014. Retrieved 25 March 2014.
- ↑ "Energy and Air Pollution" (PDF). Iea.org. Archived from the original (PDF) on 11 October 2019. Retrieved 12 March 2019.
- 1 2 "Study Links 6.5 Million Deaths Each Year to Air Pollution". The New York Times. 26 June 2016. Archived from the original on 27 June 2016. Retrieved 27 June 2016.
- ↑ Abnett, Kate (8 September 2020). "One in eight deaths in Europe linked to pollution, environment, EU says". Reuters. Archived from the original on 8 October 2020. Retrieved 9 October 2020.
- ↑ Green, Matthew (9 February 2021). "Fossil fuel pollution causes one in five premature deaths globally: study". Reuters. Archived from the original on 25 February 2021. Retrieved 5 March 2021.
- ↑ Vohra, Karn; Vodonos, Alina; Schwartz, Joel; Marais, Eloise A.; Sulprizio, Melissa P.; Mickley, Loretta J. (1 April 2021). "Global mortality from outdoor fine particle pollution generated by fossil fuel combustion: Results from GEOS-Chem". Environmental Research. 195: 110754. Bibcode:2021ER....195k0754V. doi:10.1016/j.envres.2021.110754. ISSN 0013-9351. PMID 33577774. S2CID 231909881. Archived from the original on 4 March 2021. Retrieved 5 March 2021.
- ↑ Lelieveld, Jos; Pozzer, Andrea; Pöschl, Ulrich; Fnais, Mohammed; Haines, Andy; Münzel, Thomas (1 September 2020). "Loss of life expectancy from air pollution compared to other risk factors: a worldwide perspective". Cardiovascular Research. 116 (11): 1910–1917. doi:10.1093/cvr/cvaa025. ISSN 0008-6363. PMC 7449554. PMID 32123898.
- ↑ "Opioid overdose". www.who.int. Archived from the original on 1 December 2014. Retrieved 10 July 2022.
- ↑ "Understanding the Opioid Overdose Epidemic | CDC's Response to the Opioid Overdose Epidemic | CDC". www.cdc.gov. 1 June 2022. Archived from the original on 9 July 2022. Retrieved 10 July 2022.
- ↑ Karila, Laurent; Reynaud, Michel; Aubin, Henri-Jean; Rolland, Benjamin; Guardia, Dewi; Cottencin, Olivier; Benyamina, Amine (1 May 2011). "Pharmacological Treatments for Cocaine Dependence: Is There Something New?". Current Pharmaceutical Design. 17 (14): 1359–1368. doi:10.2174/138161211796150873. PMID 21524259.
- ↑ Lariscy, Joseph T. (April 2019). "Smoking-attributable mortality by cause of death in the United States: An indirect approach". SSM - Population Health. 7: 100349. doi:10.1016/j.ssmph.2019.100349. PMC 6351587. PMID 30723766.
- 1 2 "Tobacco: E-cigarettes". www.who.int. Archived from the original on 10 July 2022. Retrieved 10 July 2022.
- ↑ Coggins, Christopher R.E.; Gaworski, Charles L. (April 2008). "Could charcoal filtration of cigarette smoke reduce smoking-induced disease? A review of the literature". Regulatory Toxicology and Pharmacology. 50 (3): 359–365. doi:10.1016/j.yrtph.2008.01.001. PMID 18289753.
- ↑ Scherer, Gerhard; Urban, Michael; Engl, Johannes; Hagedorn, Heinz-Werner; Riedel, Kirsten (January 2006). "Influence of Smoking Charcoal Filter Tipped Cigarettes on Various Biomarkers of Exposure". Inhalation Toxicology. 18 (10): 821–829. doi:10.1080/08958370600747945. PMID 16774872. S2CID 46337946.
- ↑ Gartner, Coral E. (November 2015). "Mull it over: cannabis vaporizers and harm reduction". Addiction. 110 (11): 1709–1710. doi:10.1111/add.13139. ISSN 0965-2140. PMID 26471154.
- ↑ Russell, Cayley; Rueda, Sergio; Room, Robin; Tyndall, Mark; Fischer, Benedikt (1 February 2018). "Routes of administration for cannabis use – basic prevalence and related health outcomes: A scoping review and synthesis". International Journal of Drug Policy. 52: 87–96. doi:10.1016/j.drugpo.2017.11.008. ISSN 0955-3959. PMID 29277082.
- ↑ Solowij, Nadia (30 November 2018). "Peering Through the Haze of Smoked vs Vaporized Cannabis—To Vape or Not to Vape?". JAMA Network Open. 1 (7): e184838. doi:10.1001/jamanetworkopen.2018.4838. ISSN 2574-3805. PMID 30646385. S2CID 58539866.
- ↑ Griswold, Max G.; Fullman, Nancy; Hawley, Caitlin; et al. (22 September 2018). "Alcohol use and burden for 195 countries and territories, 1990–2016: a systematic analysis for the Global Burden of Disease Study 2016". The Lancet. 392 (10152): 1015–1035. doi:10.1016/S0140-6736(18)31310-2. ISSN 0140-6736. PMC 6148333. PMID 30146330.
- ↑ "Extreme temperatures kill 5 million people a year with heat-related deaths rising, study finds". The Guardian. 7 July 2021. Archived from the original on 14 August 2021. Retrieved 14 August 2021.
- ↑ Zhao, Qi; et al. (1 July 2021). "Global, regional, and national burden of mortality associated with non-optimal ambient temperatures from 2000 to 2019: a three-stage modelling study". The Lancet Planetary Health. 5 (7): e415–e425. doi:10.1016/S2542-5196(21)00081-4. ISSN 2542-5196. PMID 34245712. S2CID 235791583.
- ↑ "Antibiotic resistance killed more people than malaria or AIDS in 2019". New Scientist. Archived from the original on 12 February 2022. Retrieved 12 February 2022.
- 1 2 Christopher JL Murray; et al. (12 February 2022). "Global burden of bacterial antimicrobial resistance in 2019: a systematic analysis". The Lancet. 399 (10325): 629–655. doi:10.1016/S0140-6736(21)02724-0. ISSN 0140-6736. PMC 8841637. PMID 35065702.
- ↑ Chanel S, Doherty B (2020-09-10). "'Superbugs' a far greater risk than Covid in Pacific, scientist warns". The Guardian. ISSN 0261-3077. Archived from the original on 2022-12-05. Retrieved 2020-09-14.
- 1 2 Kotabagi, Rb; Chaturvedi, Rk; Banerjee, A (July 2004). "Medical Certification of Cause of Death". Medical Journal Armed Forces India. 60 (3): 261–272. doi:10.1016/S0377-1237(04)80060-1. PMC 4923180. PMID 27407646.
- ↑ Sin, D. D.; Anthonisen, N. R.; Soriano, J. B.; Agusti, A. G. (1 December 2006). "Mortality in COPD: role of comorbidities". European Respiratory Journal. 28 (6): 1245–1257. doi:10.1183/09031936.00133805. ISSN 0903-1936. PMID 17138679. S2CID 15374114.
- ↑ Wu, Jianhua; Mafham, Marion; Mamas, Mamas A.; Rashid, Muhammad; Kontopantelis, Evangelos; Deanfield, John E.; de Belder, Mark A.; Gale, Chris P. (1 April 2021). "Place and Underlying Cause of Death During the COVID-19 Pandemic: Retrospective Cohort Study of 3.5 Million Deaths in England and Wales, 2014 to 2020". Mayo Clinic Proceedings. 96 (4): 952–963. doi:10.1016/j.mayocp.2021.02.007. ISSN 0025-6196. PMC 7885692. PMID 33714592.
- ↑ Wadhera, Rishi K.; Shen, Changyu; Gondi, Suhas; Chen, Siyan; Kazi, Dhruv S.; Yeh, Robert W. (19 January 2021). "Cardiovascular Deaths During the COVID-19 Pandemic in the United States". Journal of the American College of Cardiology. 77 (2): 159–169. doi:10.1016/j.jacc.2020.10.055. PMC 7800141. PMID 33446309.
- ↑ Adam, David (10 March 2022). "COVID's true death toll: much higher than official records". Nature. 603 (7902): 562. Bibcode:2022Natur.603..562A. doi:10.1038/d41586-022-00708-0. PMID 35277684. S2CID 247407282.
- ↑ Wang, Haidong; Paulson, Katherine R.; Pease, Spencer A.; et al. (16 April 2022). "Estimating excess mortality due to the COVID-19 pandemic: a systematic analysis of COVID-19-related mortality, 2020–21". The Lancet. 399 (10334): 1513–1536. doi:10.1016/S0140-6736(21)02796-3. ISSN 0140-6736. PMC 8912932. PMID 35279232.
- ↑ Ueda, Michiko; Nordström, Robert; Matsubayashi, Tetsuya (13 April 2021). "Suicide and mental health during the COVID-19 pandemic in Japan". Journal of Public Health. 44 (3): 541–548. doi:10.1093/pubmed/fdab113. PMC 8083330. PMID 33855451.
- ↑ Rockett, Ian R. H.; Wang, Shuhui; Lian, Yinjuan; Stack, Steven (1 October 2007). "Suicide-associated comorbidity among US males and females: a multiple cause-of-death analysis". Injury Prevention. 13 (5): 311–315. doi:10.1136/ip.2007.015230. ISSN 1353-8047. PMC 2610621. PMID 17916887.
- ↑ Kutcher, Stanley P.; Szumilas, Magdalena (29 January 2008). "Youth suicide prevention". CMAJ. 178 (3): 282–285. doi:10.1503/cmaj.071315. ISSN 0820-3946. PMC 2211358. PMID 18227445.
- ↑ Holt-Lunstad, Julianne; Smith, Timothy B.; Layton, J. Bradley (27 July 2010). "Social Relationships and Mortality Risk: A Meta-analytic Review". PLOS Medicine. 7 (7): e1000316. doi:10.1371/journal.pmed.1000316. ISSN 1549-1676. PMC 2910600. PMID 20668659.
- ↑ Cohen, Larry; Davis, Rachel; Realini, Anna (1 September 2016). "Communities are not all created equal: Strategies to prevent violence affecting youth in the United States". Journal of Public Health Policy. 37 (1): 81–94. doi:10.1057/s41271-016-0005-4. ISSN 1745-655X. PMID 27638244. S2CID 205132439.
- ↑ "Lifestyle Risk Factors | Tracking | NCEH | CDC". www.cdc.gov. 31 August 2021. Archived from the original on 10 July 2022. Retrieved 8 July 2022.
- ↑ Carlson, Susan A. (2018). "Percentage of Deaths Associated With Inadequate Physical Activity in the United States". Preventing Chronic Disease. 15: E38. doi:10.5888/pcd18.170354. PMC 5894301. PMID 29602315. Archived from the original on 10 July 2022. Retrieved 7 July 2022.
- ↑ Danaei, Goodarz; Ding, Eric L.; Mozaffarian, Dariush; Taylor, Ben; Rehm, Jürgen; Murray, Christopher J. L.; Ezzati, Majid (28 April 2009). "The Preventable Causes of Death in the United States: Comparative Risk Assessment of Dietary, Lifestyle, and Metabolic Risk Factors". PLOS Medicine. 6 (4): e1000058. doi:10.1371/journal.pmed.1000058. PMC 2667673. PMID 19399161. S2CID 15272724.
- ↑ Ford, Earl S.; Bergmann, Manuela M.; Boeing, Heiner; Li, Chaoyang; Capewell, Simon (July 2012). "Healthy lifestyle behaviors and all-cause mortality among adults in the United States". Preventive Medicine. 55 (1): 23–27. doi:10.1016/j.ypmed.2012.04.016. PMC 4688898. PMID 22564893.
- ↑ Carlson, Susan A. (2018). "Percentage of Deaths Associated With Inadequate Physical Activity in the United States". Preventing Chronic Disease. 15: E38. doi:10.5888/pcd18.170354. PMC 5894301. PMID 29602315. S2CID 4509842. Archived from the original on 10 July 2022. Retrieved 8 July 2022.
- ↑ Aubrey D.N.J., de Grey (2007). "Life Span Extension Research and Public Debate: Societal Considerations" (PDF). Studies in Ethics, Law, and Technology. 1 (1, Article 5). CiteSeerX 10.1.1.395.745. doi:10.2202/1941-6008.1011. S2CID 201101995. Archived from the original (PDF) on October 13, 2016. Retrieved August 7, 2011.
- ↑ Zhavoronkov, Alexander; Bhupinder, Bhullar (2015-10-04). "Classifying aging as a disease in the context of ICD-11". Frontiers in Genetics. 6: 326. doi:10.3389/fgene.2015.00326. PMC 4631811. PMID 26583032.
- ↑ Stambler, Ilia (2017-10-01). "Recognizing Degenerative Aging as a Treatable Medical Condition: Methodology and Policy". Aging and Disease. 8 (5): 583–589. doi:10.14336/AD.2017.0130. PMC 5614323. PMID 28966803. Archived from the original on 2021-05-21. Retrieved 2023-04-13.
- ↑ "Opening the door to treating ageing as a disease". The Lancet Diabetes & Endocrinology. 6 (8): 587. 2018-08-01. doi:10.1016/S2213-8587(18)30214-6. PMID 30053981. S2CID 51726070. Archived from the original on 2023-05-03. Retrieved 2023-04-13.
- ↑ Calimport, Stuart; et al. (2019-10-01). "To help aging populations, classify organismal senescence". Science. 366 (6465): 576–578. Bibcode:2019Sci...366..576C. doi:10.1126/science.aay7319. PMC 7193988. PMID 31672885.
- ↑ Khaltourina, Daria; Matveyev, Yuri; Alekseev, Aleksey; Cortese, Franco; Ioviţă, Anca (July 2020). "Aging Fits the Disease Criteria of the International Classification of Diseases". Mechanisms of Ageing and Development. 189: 111230. doi:10.1016/j.mad.2020.111230. PMID 32251691. S2CID 214779653. Archived from the original on 2021-04-18. Retrieved 2023-04-13.
- ↑ Santos, Andreia Costa; Willumsen, Juana; Meheus, Filip; Ilbawi, Andre; Bull, Fiona C. (1 January 2023). "The cost of inaction on physical inactivity to public health-care systems: a population-attributable fraction analysis". The Lancet Global Health. 11 (1): e32–e39. doi:10.1016/S2214-109X(22)00464-8. ISSN 2214-109X. PMC 9748301. PMID 36480931.
{{cite journal}}: Check|pmc=value (help) - ↑ Puterman, Eli; Weiss, Jordan; Hives, Benjamin A.; Gemmill, Alison; Karasek, Deborah; Mendes, Wendy Berry; Rehkopf, David H. (14 July 2020). "Predicting mortality from 57 economic, behavioral, social, and psychological factors". Proceedings of the National Academy of Sciences. 117 (28): 16273–16282. doi:10.1073/pnas.1918455117. ISSN 0027-8424. PMC 7369318. PMID 32571904.
- ↑ Bakalar, Nicholas (4 July 2011). "Researchers Link Deaths to Social Ills". The New York Times. Archived from the original on 31 January 2023. Retrieved 31 January 2023.
- ↑ Stringhini, Silvia; Carmeli, Cristian; Jokela, Markus; et al. (25 March 2017). "Socioeconomic status and the 25 × 25 risk factors as determinants of premature mortality: a multicohort study and meta-analysis of 1·7 million men and women". The Lancet. 389 (10075): 1229–1237. doi:10.1016/S0140-6736(16)32380-7. ISSN 0140-6736. PMC 5368415. PMID 28159391.
- ↑ G. Lucchini, Roberto; London, Leslie (25 November 2014). "Global Occupational Health: Current Challenges and the Need for Urgent Action". Annals of Global Health. 80 (4): 251–256. doi:10.1016/j.aogh.2014.09.006. PMID 25459325.
- ↑ Batool, Rubeena; Zaman, Khalid; Khurshid, Muhammad Adnan; Sheikh, Salman Masood; Aamir, Alamzeb; Shoukry, Alaa Mohamd; Sharkawy, Mohamed A.; Aldeek, Fares; Khader, Jameel; Gani, Showkat (1 October 2019). "Economics of death and dying: a critical evaluation of environmental damages and healthcare reforms across the globe". Environmental Science and Pollution Research. 26 (29): 29799–29809. doi:10.1007/s11356-019-06159-x. ISSN 1614-7499. PMID 31407261. S2CID 199528114.
- 1 2 3 Tran, Khanh Bao; Lang, Justin J.; Compton, Kelly; Xu, Rixing; Acheson, Alistair R.; Henrikson, Hannah Jacqueline; Kocarnik, Jonathan M.; Penberthy, Louise; Aali, Amirali; Abbas, Qamar; et al. (20 August 2022). "The global burden of cancer attributable to risk factors, 2010–19: a systematic analysis for the Global Burden of Disease Study 2019". The Lancet. 400 (10352): 563–591. doi:10.1016/S0140-6736(22)01438-6. ISSN 0140-6736. PMC 9395583. PMID 35988567.
- ↑ Leventer-Roberts, Maya; Haklai, Ziona; Applbaum, Yael; Goldberger, Nehama; Cohen, Dror; Levinkron, Ohad; Feldman, Becca; Balicer, Ran (7 June 2021). "Validating reported cause of death using integrated electronic health records from a nation-wide database". Journal of Public Health. 43 (2): 341–347. doi:10.1093/pubmed/fdz146. PMID 31774532.
- ↑ Goldstein, Sarah A.; D’Ottavio, Alfred; Spears, Tracy; Chiswell, Karen; Hartman, Robert J.; Krasuski, Richard A.; Kemper, Alex R.; Meyer, Robert E.; Hoffman, Timothy M.; Walsh, Michael J.; Sang, Charlie J.; Paolillo, Joseph; Li, Jennifer S. (21 July 2020). "Causes of Death and Cardiovascular Comorbidities in Adults With Congenital Heart Disease". Journal of the American Heart Association. 9 (14): e016400. doi:10.1161/JAHA.119.016400. PMC 7660712. PMID 32654582.
- ↑ Brooks, E. G.; Reed, K. D. (1 June 2015). "Principles and Pitfalls: a Guide to Death Certification". Clinical Medicine & Research. 13 (2): 74–82. doi:10.3121/cmr.2015.1276. PMC 4504663. PMID 26185270.
- ↑ "Underlying Cause of Death, 1999-2020 Request". wonder.cdc.gov. Archived from the original on 20 January 2012. Retrieved 7 July 2022.
- ↑ "Underlying and Multiple Cause of Death Codes" (PDF). Archived (PDF) from the original on 10 July 2022. Retrieved 7 July 2022.
- ↑ Vester, M. E. M.; van Rijn, R. R.; Duijst, W. L. J. M.; Beenen, L. F. M.; Clerkx, M.; Oostra, R. J. (July 2020). "Added value of post-mortem computed tomography (PMCT) to clinical findings for cause of death determination in adult "natural deaths"". International Journal of Legal Medicine. 134 (4): 1457–1463. doi:10.1007/s00414-019-02219-6. ISSN 1437-1596. PMC 7295833. PMID 31853676.
- ↑ "ICD - ICD-10 - International Classification of Diseases, Tenth Revision". www.cdc.gov. 29 December 2021. Archived from the original on 4 July 2018. Retrieved 7 July 2022.
- ↑ Brody, Jane E. (14 February 2022). "When the Death Certificate Omits the True Cause of Death". The New York Times. Archived from the original on 10 July 2022. Retrieved 7 July 2022.
- 1 2 "Guidance for doctors completing medical certificates of cause of death in England and Wales (accessible version)". GOV.UK. Archived from the original on 10 July 2022. Retrieved 7 July 2022.
- ↑ "Death certificates may not adequately report dementia as cause of death". National Institute on Aging. Archived from the original on 4 July 2022. Retrieved 7 July 2022.
- ↑ McGivern, Lauri; Shulman, Leanne; Carney, Jan K.; Shapiro, Steven; Bundock, Elizabeth (November 2017). "Death Certification Errors and the Effect on Mortality Statistics". Public Health Reports. 132 (6): 669–675. doi:10.1177/0033354917736514. PMC 5692167. PMID 29091542. S2CID 8126036.
- ↑ Alipour, Jahanpour; Payandeh, Abolfazl (August 2021). "Common errors in reporting cause-of-death statement on death certificates: A systematic review and meta-analysis". Journal of Forensic and Legal Medicine. 82: 102220. doi:10.1016/j.jflm.2021.102220. PMID 34325081. S2CID 236516668.
- ↑ "Reporting Cause of Death: Quick Reference". Archived from the original on 10 July 2022. Retrieved 7 July 2022.
- ↑ "Certified causes of death inaccurate in fifth of cases, study suggests". The Guardian. 2 December 2012. Archived from the original on 10 July 2022. Retrieved 8 July 2022.
- ↑ "Leading causes of death by age group" (PDF). National Center for Injury Prevention and Control. 2018.
- 1 2 3 "National Vital Statistics Report" (PDF). National Vital Statistics Report, Vol. 50, No. 15. September 16, 2002.
- ↑ Day, Ryan Knutson, Liz (21 May 2012). "Methodology: How We Calculated the Tower Industry Death Rate". Archived from the original on 5 February 2018. Retrieved 13 April 2023.
- ↑ "Bureau of Labor Statistics; National Census of Fatal Occupational Injuries in 2006" (PDF). Retrieved 2014-06-09.
External links
- Deaths: Leading Causes for 2009 Archived 2023-03-16 at the Wayback Machine
- Leading causes of death in the U.S. for 2015-2020 Archived 2023-04-13 at the Wayback Machine
| In medicine |
| ||||||||||||
|---|---|---|---|---|---|---|---|---|---|---|---|---|---|
| Lists |
| ||||||||||||
| Mortality |
| ||||||||||||
| After death |
| ||||||||||||
| Paranormal |
| ||||||||||||
| Legal |
| ||||||||||||
| Fields |
| ||||||||||||
| Other |
| ||||||||||||
| |||||||||||||