wikiHow is a “wiki,” similar to Wikipedia, which means that many of our articles are co-written by multiple authors. To create this article, 9 people, some anonymous, worked to edit and improve it over time.
This article has been viewed 70,808 times.
Learn more...
When buying an asset as an investment, it is critical to understand how that asset can be expected to behave in the future. A high, stable growth rate is the obvious desired outcome. One way to estimate the expected growth of an asset is to calculate its historical growth rate; over a long period of time, an asset can be expected to behave in a consistent way, so the past growth rate is a good indicator of the future growth rate. Learning how to calculate an asset growth rate requires using a relatively simple formula.
Steps
-
1Record the asset's price at several points in time. To calculate a growth rate, you will need at least 2 data points. The farther apart these data points are, the more accurate the growth rate is likely to be. For example, it is better to use price points 10 years apart than points 1 year apart.
- Having more than 2 price points will allow you to calculate the asset's constant change in price over small periods of time. This is useful is you plan to adjust your figures for market movements.
-
2Familiarize yourself with the formula used for calculating a growth rate. An asset's growth rate between 2 price points can be calculated using the following formula: GR = (P2 - P1) / P1. In this formula, "GR" represents the growth rate, "P1" represents the early price point, and "P2" represents the later price point.Advertisement
-
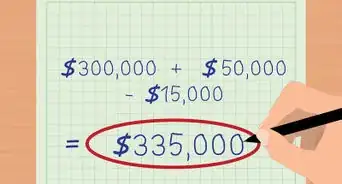
3Calculate the asset's growth rate using the formula above. To arrive at the growth rate between your 2 points in time, plug your numbers into the growth formula. For example, consider a stock that was priced at $43 per share 10 years ago, and is currently priced at $60.
- Using the formula above, the stock's growth rate is (60 - 43) / 43, or 0.39. This means that the stock increased in value by 39 percent over the 10-year period analyzed.
- Note that this growth rate is not an annual return. The asset above can be expected to grow by 39 percent every decade, not every year.
-
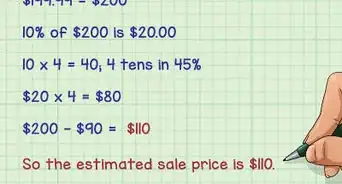
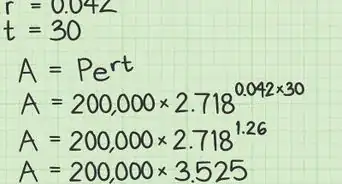
4Annualize the growth rate for easy analysis. Generally, you will want to know how big of a return you can expect on an asset on an annual basis. Converting a long-term growth rate to an annual growth rate uses a slightly more complicated formula than above. The formula is: i = (P2 / P1) ^ (1 / n) - 1. In this formula, "i" represents the annual growth rate, and "n" represents the number of years between the 2 price points.
- In the example above, the annual growth rate is: (60 / 43) ^ (1 / 10) - 1, or 0.0338. This means that this stock grew by an average of 3.38 percent each year over the 10-year period.
- Using an annualized growth rate will better allow you to compare assets against each other. It will also allow you to determine whether an asset meets your required rate of return for a given level of risk.


Warnings
- When calculating growth rates in this way, be wary of procedures like stock splits that can skew your results. A stock split cuts the price of a stock in half instantly (although it doubles the number of shares outstanding), so an adjustment would be necessary to account for the sudden drop in price.⧼thumbs_response⧽
Things You'll Need
- Pencil
- Paper
- Calculator

-Step-10.webp)


-Step-10.webp)