This article was co-authored by wikiHow Staff. Our trained team of editors and researchers validate articles for accuracy and comprehensiveness. wikiHow's Content Management Team carefully monitors the work from our editorial staff to ensure that each article is backed by trusted research and meets our high quality standards.
There are 10 references cited in this article, which can be found at the bottom of the page.
This article has been viewed 37,464 times.
Learn more...
An organization or organizational chart is a way of depicting the structure of your company or organization in a visual way. It shows the relationships between people and/or departments. When creating an organizational chart, you should start by figuring out how your company is organized overall and what the chain of command is. Then you should outline that information on a piece of paper, after which you can use software to create a professional-looking chart.
Steps
Outlining Your Structure
-
1Look at how your organization makes decisions. Most businesses are generally either arranged horizontally or vertically. Horizontally means the structure of power is spread out among employees. A vertical structure means that the power in the company is primarily hierarchical, moving from general employees to middle managers and then to top managers.[1]
- In a horizontal system, more employees are empowered to make decisions. It can lead to more mistakes, but decisions also happen more quickly. In a vertical system, you must go up the structure of power for a decision to be made.[2]
-
2Organize by department. One way to organize your chart is to arrange it by department. It doesn't matter whether your company divides into departments by products, functions, or locations. You can use the major departments, then sub-divide into divisions within those departments.[3]Advertisement
-
3Divide by employees. Another way to arrange an organizational chart is by your employees. Use your employees' names, and organize your chart by the connections they have to one another. This type of chart works well for both horizontal and vertical power structures, as you can draw lines to show relationships however you want.[4]
- Keep in mind that you can also use a hybrid of a departmental and employee chart. Make the chart fit your needs.
-
4Gather the information you need. If you're doing an employee-based chart, you'll need the names of employees, their titles, and their relationships to one another. Add their employee number if you'd like. For a departmental chart, collect the names of all the departments and how they relate to one another.[5]


Working on the Design
-
1Make a rough outline. Start by creating a visual of your structure, beginning with the largest parts of the organization first, such as the main departments. You could also start with the main managers, if you're using an employee-based chart. The point of this exercise is to establish a visual of what your chart needs to look like and how much information you'll want to include.
-
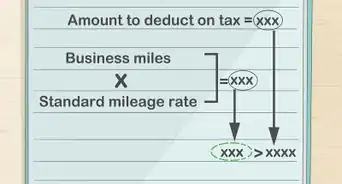
2Decide how much detail you want. For instance, in a large organization, including every employee is probably not feasible. Even including every sub-department may not be feasible. Make a decision about the amount of detail you're going to include.[6]
-
3Select a design. One way to design an organizational chart is like a family tree. You have the CEO in a box at the top. Underneath that, you have lines coming out to the next major departments or managers, also enclosed in boxes.[7] This design works especially well for a hierarchical company.
- On the other hand, a thought-bubble type design might work better in a less hierarchical company. If you have three equal departments with no CEO, you could connect all three departments in the design, with each department spreading out from a middle square or bubble with the name of the company in it.[8]


Using Software to Build an Organizational Chart
-
1Pick software. Microsoft Office is a good place to start when choosing software to build your chart, as it's readily available and user friendly. Word, Excel, Outlook, and PowerPoint will all let you build a chart, for instance.[9] You can also find templates and programs on the internet that will let you build an organizational chart.[10]
-
2Choose a chart style. Usually, any software will let you choose the style of chart you want. In Office, choose a chart style under "SmartArt." While you can choose from a variety of styles for charts, the style "Organizational Chart" also has an assistant to help you auto-fill the blanks of the chart.[11]
- SmartArt is under the Insert tab in Illustrations. "Organizational Chart" is under Hierarchy.
-
3Add the boxes you'll need. Once you have your chart in place, start adding in the information you've outlined into the chart. Begin by adding all the boxes and connecting lines you'll need. Though you can put more in later, you'll find it easier to have the structure in place first.[12]
- The lines you add can connect departments to each other, not just show connections from the top to the bottom.
-
4Fill in your company's specific details. Add the information by clicking inside the box and typing. It's easiest to begin at the top, especially if you have a mostly hierarchical company. Then, work your way down through each department. If you're using a thought-bubble style, start in the middle and work your way outward.[13]
-
5Add design elements. Once you've got your information filled in, you can add design touches. For example, you can change the color of the boxes, so different departments have different colors. You could also change up the font, such as having bold font or larger font for the higher levels and regular font or smaller font for the lower levels.[14]


References
- ↑ http://open.lib.umn.edu/strategicmanagement/chapter/9-3-creating-an-organizational-structure/
- ↑ https://connectsus.com/about/resources/how-to-create-organizational-chart
- ↑ http://open.lib.umn.edu/strategicmanagement/chapter/9-3-creating-an-organizational-structure/
- ↑ https://connectsus.com/about/resources/how-to-create-organizational-chart
- ↑ https://www.valdosta.edu/administration/finance-admin/human-resources/our-services/compensation-and-classification/how-to-create-an-organizational-chart.php
- ↑ https://www.valdosta.edu/administration/finance-admin/human-resources/our-services/compensation-and-classification/how-to-create-an-organizational-chart.php
- ↑ https://developers.google.com/chart/interactive/docs/gallery/orgchart
- ↑ https://blog.hubspot.com/marketing/organizational-structure-building-blocks#sm.0001lkjur56dxf9rzzv19qrmiu0s0
- ↑ https://support.office.com/en-us/article/Create-an-organization-chart-21ada00d-82e6-4340-9033-439ac2843c37
- ↑ http://www.conceptdraw.com/How-To-Guide/video-how-to-draw-an-organization-chart
- ↑ https://support.office.com/en-us/article/Create-an-organization-chart-21ada00d-82e6-4340-9033-439ac2843c37
- ↑ https://support.office.com/en-us/article/Create-an-organization-chart-21ada00d-82e6-4340-9033-439ac2843c37
- ↑ https://support.office.com/en-us/article/Create-an-organization-chart-21ada00d-82e6-4340-9033-439ac2843c37
- ↑ https://support.office.com/en-us/article/Create-an-organization-chart-21ada00d-82e6-4340-9033-439ac2843c37
About This Article