This article was co-authored by wikiHow Staff. Our trained team of editors and researchers validate articles for accuracy and comprehensiveness. wikiHow's Content Management Team carefully monitors the work from our editorial staff to ensure that each article is backed by trusted research and meets our high quality standards.
The wikiHow Tech Team also followed the article's instructions and verified that they work.
This article has been viewed 340,999 times.
Learn more...
Break-even analysis is a tool for evaluating the profit potential of a business model and for evaluating various pricing strategies. You can easily compile fixed costs, variable costs, and pricing options in Excel to determine the break even point for your product. This is the number of units that you need to sell at the price you set in order to break even.
Steps
Adding a Variable Costs Table
-
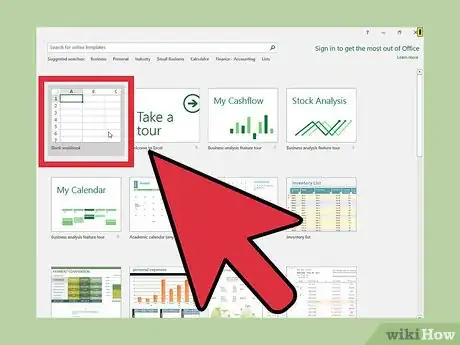
1Open Excel and create a new blank workbook. You'll be creating multiple sheets in this workbook to handle tracking all of your costs.
-
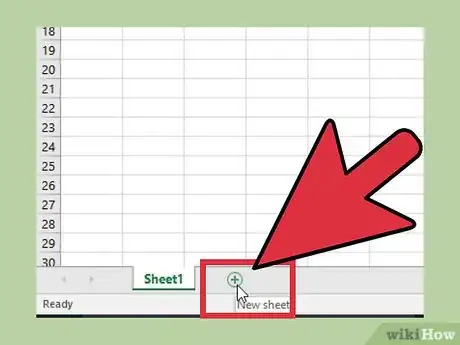
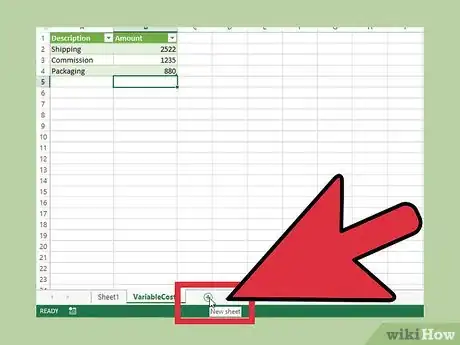
2Click the "+" button next to "Sheet1" at the bottom of the screen. This will create a new blank worksheet.Advertisement
-
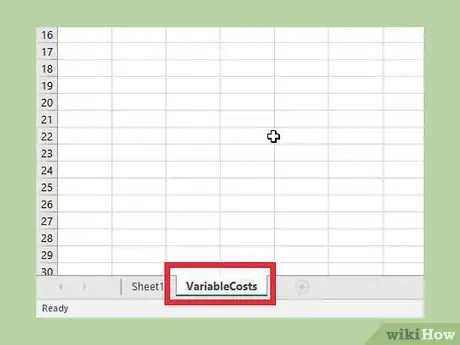
3Rename the new sheet to "VariableCosts." This sheet will house the table that tracks all of your product's variable costs, such as shipping, commission, and other costs.
-
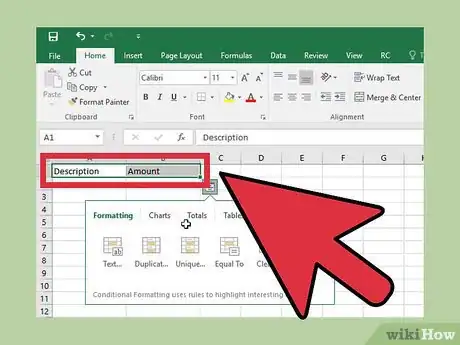
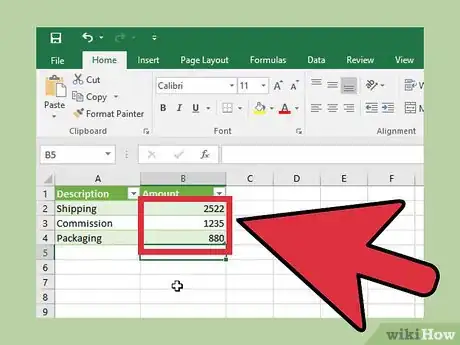
4Create header labels for the new sheet. To create a basic variable costs table, enter "Description" into A1 and "Amount" into B1.
-
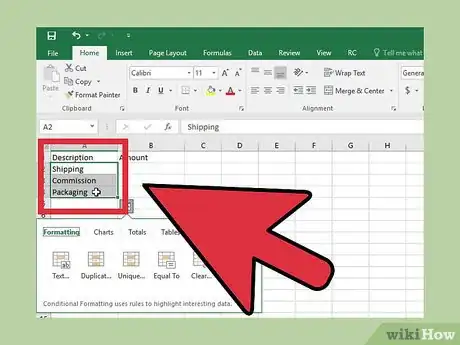
5Enter in the names of your business's variable costs in column A. Below the "Description" header, enter the types of variable costs you'll be dealing with for your product.
-
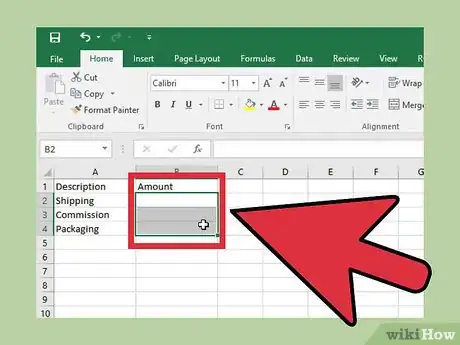
6Leave column B ("Amount") blank for now. You'll be filling out the actual costs later in the process.
-
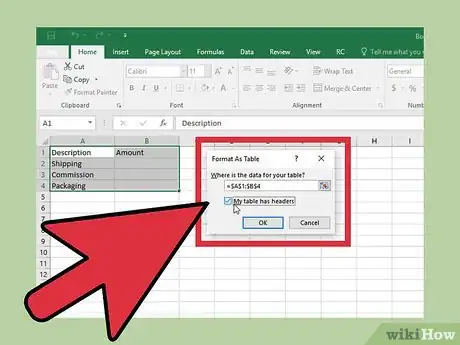
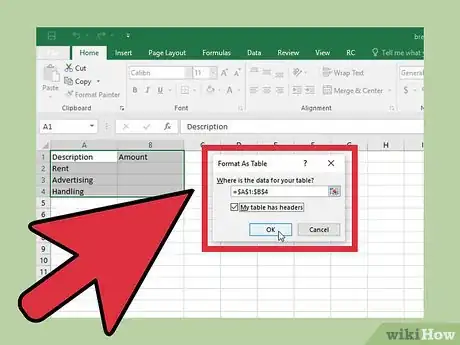
7Create a table from the data you've entered. Turning the data into a table will make it easy to plug into formulas later:
- Select all of the data, including the header row and the blank amounts, by clicking and dragging your mouse over all of the cells.
- Click the "Format as Table" button. You'll find this in the Home tab. If you're using Excel for Mac, click the Tables tab, click the "New" button, and then select "Insert Table with Headers."
- Check the "My table has headers" box. This will preserve the labels in the first row as header labels.
- Click the "Table Name" field in the upper-right corner and name it "VariableCosts."
Adding a Fixed Costs Table
-
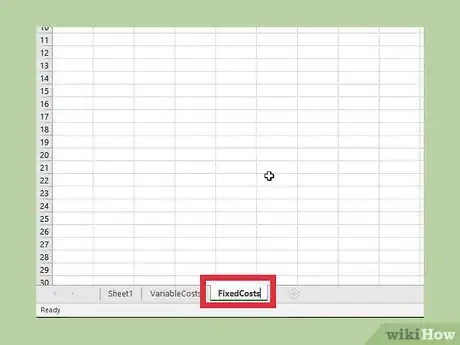
1Click the "+" button next to "VariableCosts" at the bottom of the screen. This will create another blank worksheet.
-
2Rename the new sheet to "FixedCosts." This sheet will house all of the fixed costs for your product, such as rent, insurance, and other costs that don't change.
-
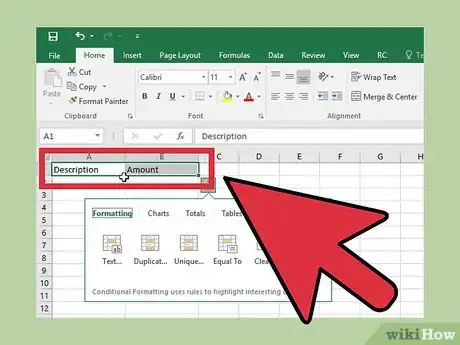
3Create the header labels. Like with the Variable Costs sheet, create a "Description" label in cell A1 and an "Amount" label in cell B1.
-
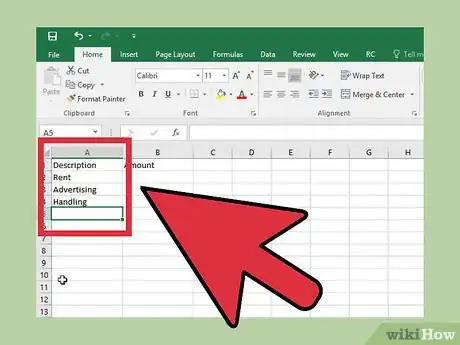
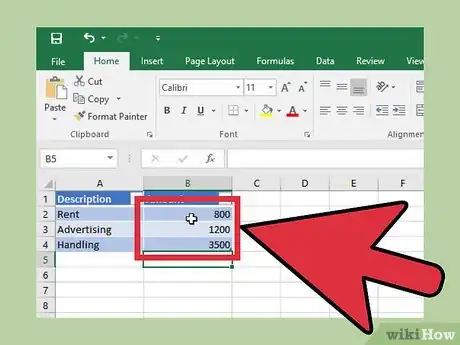
4Enter in the names of your business's fixed costs in column A. Fill out the first column with descriptions of your fixed costs, like "Rent."
-
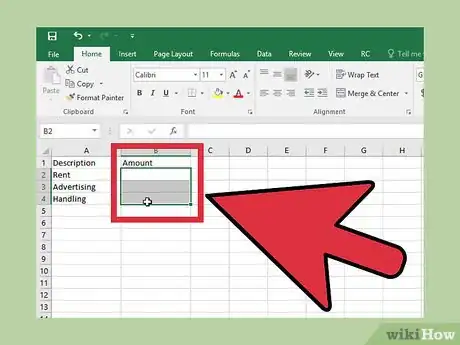
5Leave column B ("Amount") blank for now. You'll be filling out these costs after creating the rest of the spreadsheet.
-
6Create a table from the data you've entered. Select everything you created on this sheet, including the headers:
- Click the "Format as Table" button in the Home tab.
- Check "My table has headers" to turn row 1 into headers for the table.
- Click the "Table Name" field and name the table "FixedCosts."
Creating the Break Even Sheet
-
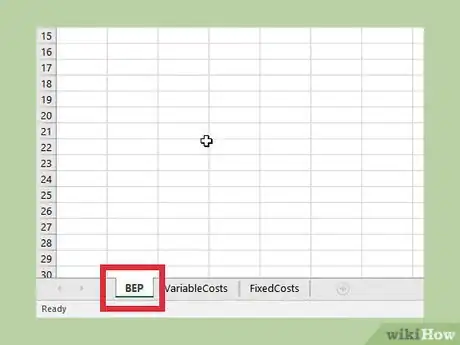
1Rename Sheet1 to "BEP" and select it. This sheet will house your main BEP (Break Even Point) chart. You don't have to rename it to "BEP," but it will be easier to navigate your workbook if you do.
-
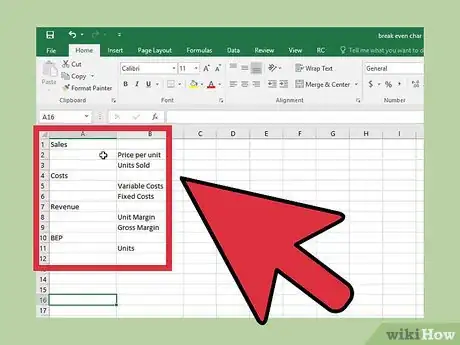
2Create the layout for your break even sheet. For the purposes of this example, create your sheet using the following layout:
- A1: Sales - This is the label for the Sales section of the spreadsheet.
- B2: Price Per Unit - This will be the price you charge for each item you sell.
- B3: Units Sold - This will be the number of units you have sold at the specified price in a set timeframe.
- A4: Costs - This is the label for the Costs section of the spreadsheet.
- B5: Variable Costs - These are the costs of your product that you have control over (shipping, commission rates, etc.)
- B6: Fixed Costs - These are the costs of your product that you don't have control over (facility rent, insurance, etc.)
- A7: Revenue - This is the amount of money selling your products generates before costs are considered.
- B8: Unit Margin - This is the amount of money you make per unit after costs are considered.
- B9: Gross Margin - This is the total amount of money you make for all the units sold after costs.
- A10: BEP - This is the label for the Break Even Point section of the spreadsheet.
- B11: Units - This is the number of units you need to sell to match your cost outlay.
-
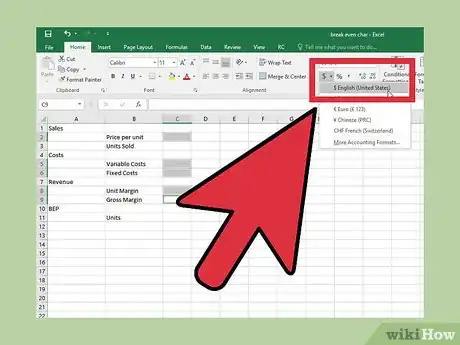
3Change the numeric formats for the output and input cells. You'll need to change the numeric formats for certain cells in order for your data to appear correctly:
- Highlight C2, C5, C6, C8, and C9. Click the drop-down menu in the "Number" section of the Home tab and choose "Currency."
- Highlight C3 and C11. Click the drop-down menu and select "More number formats." Select "Number" and then set "Decimal places" to "0."
-
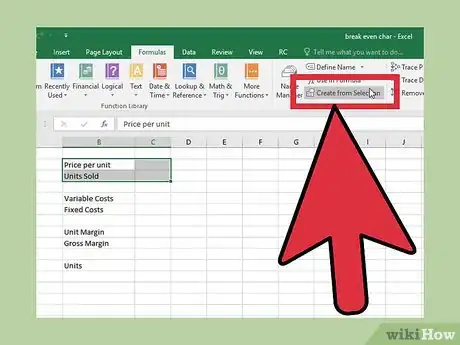
4Create ranges to use in the formulas. Select and create the following ranges to make your formulas work. This will create variables that can be plugged into your formulas, allowing you to easily reference and update these values.
- Select B2:C3 and then click the "Formulas" tab. Click "Create from selection" and then click "OK."
- Select B5:C6 and then click the "Formulas" tab. Click "Create from selection" and then click "OK."
- Select B8:C9 and then click the "Formulas" tab. Click "Create from selection" and then click "OK."
- Select B11:C11 and then click the "Formulas" tab. Click "Create from selection" and then click "OK."
Entering Formulas
-
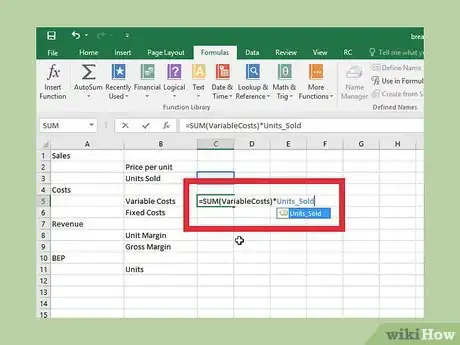
1Enter the variable costs formula. This will calculate the total variable costs for the number of items you sell. Click C5 and enter the following formula:
- =SUM(VariableCosts)*Units_Sold
-
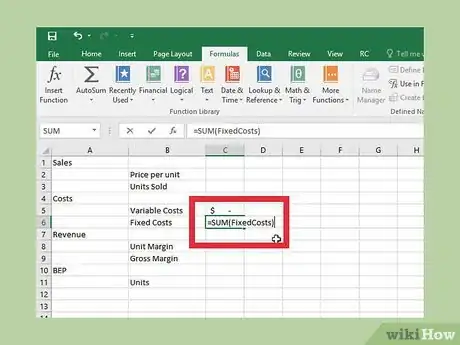
2Enter the fixed costs formula. This will calculate the total fixed costs for your product. Click C6 and enter the following formula:
- =SUM(FixedCosts)
-
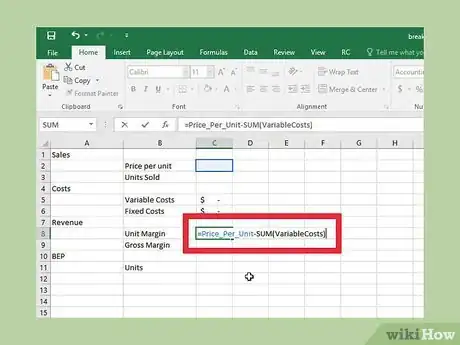
3Enter the unit margin formula. This will calculate the margin you make after variable costs have been considered. Click C8 and enter the following formula:
- =Price_Per_Unit-SUM(VariableCosts)
-
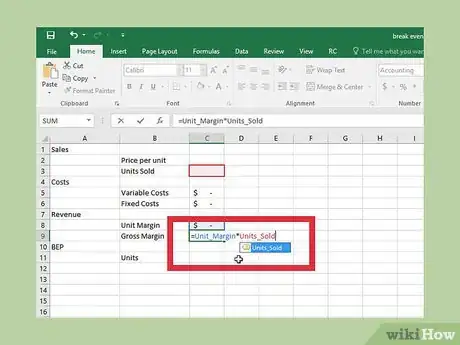
4Enter the gross margin formula. This determines the total amount you make for all of the units you sell after variable costs. Click C9 and enter the following formula:
- =Unit_Margin*Units_Sold
-
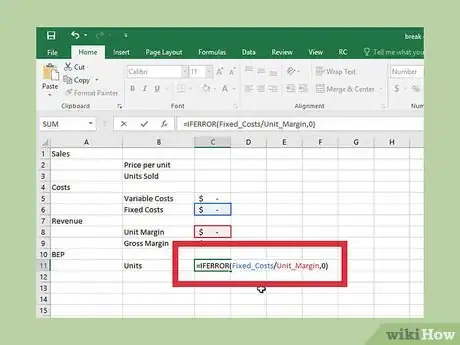
5Enter the BEP formula. This takes your fixed costs and compares them to your margins, informing you how many units you need to sell to break even. Click C11 and enter the following formula:
- =IFERROR(Fixed_Costs/Unit_Margin,0)
Finding the Break Even Point
-
1Enter your business's variable costs. Return to the VariableCosts table and fill out all of the costs related to your product. The more accurate you are here, the more accurate your BEP calculation will be.
- Each cost in the VariableCosts table should be per unit sold.
-
2Enter your business's fixed costs. Enter these costs into your Fixed Costs table. These are the costs of running your business, and should all be set to the same interval (for example, monthly costs).
-
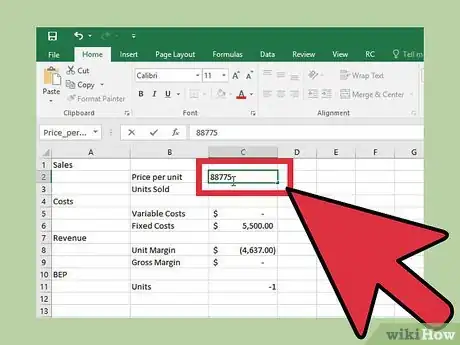
3Enter a price per unit. In the BEP sheet, enter an initial estimated price per unit. You'll be able to adjust this as you perform the calculations
-
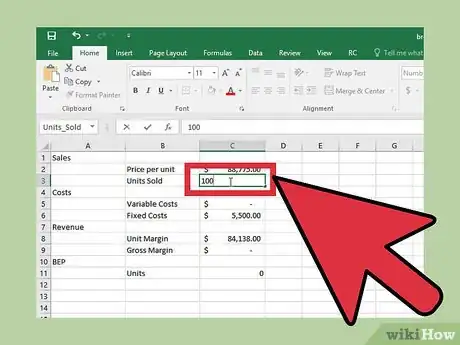
4Enter the number of units you want to sell. This is the number of units you intend to sell in the same timeframe as your Fixed Costs. For example, if your fixed costs includes monthly rent and insurance, the Units Sold will be the number of units sold in that same timeframe.
-
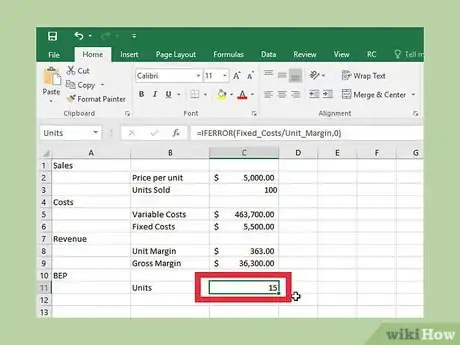
5Read the "Units" output. The Units output cell (C11) will display the number of units that you'll need to sell in your timeframe to break even. This number will change depending on the Price Per Unit as well as your Variable Costs and Fixed Costs tables.
-
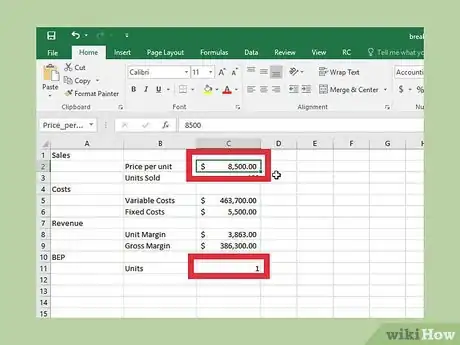
6Make adjustments to the price and costs. Changing the Price Per Unit will change the number of units you need to break even. Try changing the price and see what happens with your BEP value.[1]
Community Q&A
-
QuestionWhat if I have multiple products? Also, what if I don't know my variable costs, but just want them to be a percentage of sales?
 Community AnswerIn this case, you can either do each separately and then add the end result together, or use an average.
Warnings
- When entering your sales volume and your fixed expenses, make sure they are both based on the same period.⧼thumbs_response⧽
