X
This article was co-authored by wikiHow staff writer, Jack Lloyd. Jack Lloyd is a Technology Writer and Editor for wikiHow. He has over two years of experience writing and editing technology-related articles. He is technology enthusiast and an English teacher.
This article has been viewed 646,344 times.
Learn more...
This wikiHow teaches you how to add a data chart to your Microsoft Word document.
Steps
Part 1
Part 1 of 2:
Inserting a Graph
-
1Open a Microsoft Word document. To do so, you can double-click an existing Word document, or you can open Microsoft Word and select your document from the Recent section.
- If you're opening a new document, simply open the Microsoft Word program and click Blank document instead.
-
2Click in the document where you want to insert your graph. Doing so will place the blinking cursor where you clicked; this is where your graph will appear when you add it.
- For example, clicking below a paragraph of text will set that location as the place to insert your graph.
Advertisement -
3Click the Insert tab. It's at the top of the Word page, to the right of the Home tab.
-
4Click Chart. You'll see this option below and to the right of the Insert tab. Its icon resembles several different-colored bars.
-
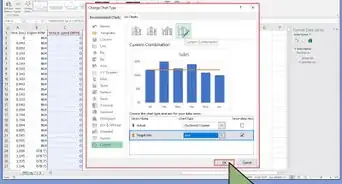
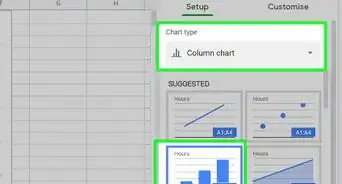
5Click a chart format. These are listed on the left side of the Chart pop-up window.
- A few common chart formats are Line, Column, and Pie.
- You can customize your chart's format by clicking an appearance option at the top of your format's window.
-
6Click OK. Doing so will insert your chart into your document.
- You'll also see a small Excel window with cells appear--this is where you'll input your data.


Advertisement
Part 2
Part 2 of 2:
Adding Graph Data
-
1Click a cell in the Excel window. Doing so will select it, which will allow you to add a point of data to that cell.
- The values in the "A" column dictate the X-axis data of your graph.
- The values in the "1" row each pertain to a different line or bar (e.g., "B1" is a line or bar, "C1" is a different line or bar, and so on).
- Numerical values outside of the "A" column or the "1" row represent different points of data on the Y-axis.
- Anything written in an Excel cell can be re-written to reflect your data.
-
2Type in a number or name.
-
3Press ↵ Enter or ⏎ Return. Doing so will enter your data into the cell, allowing you to move on to another cell.
-
4Repeat this process for every point of data you need. As you enter data, your graph will change to display it.
-
5Click X in the top right corner of the Excel window. Doing so will close the window and save your graph changes.
- You can re-open the Excel window at any time by clicking on your graph.


Advertisement
Community Q&A
-
QuestionHow do I label the axes in a line graph?
 Community AnswerThe "Chart Tools" menu. Click on the tab entitled "Layout" in the Chart Tools menu. Click on "Axis Titles" from within the "Labels" group. Click on "Primary Horizontal Axis Title" or "Secondary Horizontal Axis Title" to add a horizontal axis text box to your chart.
 -
QuestionHow do I make a table around existing text in my document?
 Community AnswerYou need to click "Insert" and then click "Smartapp." Then click on "Relationships" on the left hand side and pick your table.
 -
QuestionHow do I change the title if I update entries?Community AnswerYou can just click on your title and type in the updated title when you're ready.
Advertisement


About This Article
Jack Lloyd
wikiHow Technology Writer
This article was co-authored by wikiHow staff writer, Jack Lloyd. Jack Lloyd is a Technology Writer and Editor for wikiHow. He has over two years of experience writing and editing technology-related articles. He is technology enthusiast and an English teacher. This article has been viewed 646,344 times.
How helpful is this?
Co-authors: 22
Updated: July 28, 2022
Views: 646,344
Categories: Microsoft Word | Graphs
Article SummaryX
1. Click where you want to put the graph.
2. Click Insert.
3. Click Chart.
4. Select a format.
5. Click OK.
6. Click the Excel window.
7. Add graph data.
Did this summary help you?
Advertisement