wikiHow is a “wiki,” similar to Wikipedia, which means that many of our articles are co-written by multiple authors. To create this article, 32 people, some anonymous, worked to edit and improve it over time.
There are 7 references cited in this article, which can be found at the bottom of the page.
This article has been viewed 1,112,686 times.
Learn more...
The IQR is the "interquartile range" of a data set. It is used in statistical analysis to help draw conclusions about a set of numbers. The IQR is often preferred over the range because it excludes most outliers. Read on to learn how to find the IQR!
Steps
Understanding the IQR
-
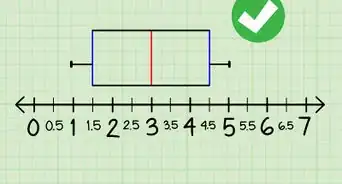
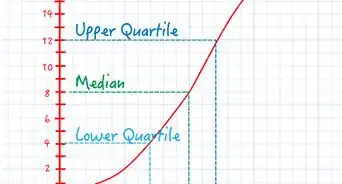
1Know how the IQR is used. Essentially, it is a way of understanding the spread or "dispersion" of a set of numbers. The interquartile range is defined as the difference between the upper quartile (the highest 25%) and the lower quartile (the lowest 25%) of a data set.[1]
Tip: The lower quartile is usually written as Q1, and the upper quartile is Q3 – which would technically make the halfway point of the data set Q2, and the highest point Q4.
-
2Understand quartiles. To visualize a quartile, chop a list of numbers into four equal parts. Each of these parts is a "quartile."[2] Consider the set: 1, 2, 3, 4, 5, 6, 7, 8.
- 1 and 2 are the first quartile, or Q1
- 3 and 4 are the second quartile, or Q2
- 5 and 6 are the third quartile, or Q3
- 7 and 8 are the fourth quartile, or Q4
Advertisement -
3Learn the formula. In order to find the difference between the upper and lower quartile, you'll need to subtract the 25th percentile from the 75th percentile. [3]
The formula is written as: Q3 – Q1 = IQR.


Organizing the Data Set
-
1Gather your data. If you're learning this for a class and taking a test, you might be provided with a ready-made set of numbers, e.g. 1, 4, 5, 7, 10. This is your data set – the numbers that you will be working with. You may, however, need to arrange the numbers yourself from some sort of table or word problem. [4]
Make sure that each number refers to the same sort of thing: for instance, the number of eggs in each nest of a given bird population, or the number of parking spots attached to each house on a given block.
-
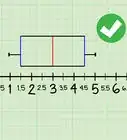
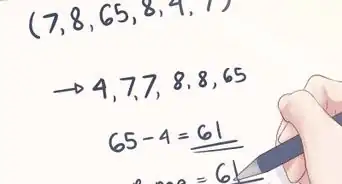
2Organize your data set in ascending order. In other words: arrange the numbers from lowest to highest. Take your cue from the following examples.[5]
- Even number of data example (Set A): 4 7 9 11 12 20
- Odd number of data example (Set B): 5 8 10 10 15 18 23
-
3Divide the data in half. To do this, find the midpoint of your data: the number or numbers in the very center of the set. If you have an odd amount of numbers, choose the exact middle number. If you have an even amount of the numbers, the midpoint will rest between the two middlemost numbers.[6]
- Even example (Set A), in which the midpoint lies between 9 and 11: 4 7 9 | 11 12 20
- Odd example (Set B), in which (10) is the midpoint: 5 8 10 (10) 15 18 23


Calculating the IQR
-
1Find the median of the lower and upper half of your data. The median is the "midpoint," or the number that is halfway into a set.[7] In this case, you aren't looking for the midpoint of the entire set, but rather the relative midpoints of the upper and lower subsets. If you have an odd number of data, do not include the middle number – in Set B, for instance, you would not figure in one of the 10s.[8]
- Even example (Set A):
- Median of lower half = 7 (Q1)
- Median of upper half = 12 (Q3)
- Odd example (Set B):
- Median of lower half = 8 (Q1)
- Median of upper half = 18 (Q3)
- Even example (Set A):
-
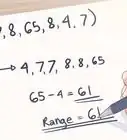
2Subtract Q3 - Q1 to determine the IQR.[9] Now you know how many numbers lie between the 25th percentile and the 75th percentile. You can use this to understand how widely-spread the data is. For instance, if a test is scored out of 100, and the IQR of the scores is 5, you can assume that most of the people taking it had a similar grasp of the material because the high-low range is not very large. If the IQR of the test scores is 30, however, you might start to wonder why some people scored so high and others scored so low.
- Even example (Set A): 12 - 7 = 5
- Odd example (Set B): 18 - 8 = 10


Community Q&A
-
QuestionHow do I find the IQR when the upper and lower quartile are the same number?
 Community AnswerFind the IQR by subtracting Q1 from Q3. If they are the same number, the IQR equals zero.
 -
QuestionCan the IQR be negative?Community AnswerNo, if it is done correctly, all numbers should be in ascending order, therefore the first quartile would be smaller or the same as the third quartile.
-
QuestionHow do I find IQR of 1,3,4,5,8,9,10,11,12,14,16?Community AnswerIn 1,3,4,5,8,9,10,11,12,14,16 the median for the lower quartile is 4 and the median for the upper quartile is 12. Subtract Q3 by Q1 and that would make it 12-4 and 12-4= 8.


References
- ↑ https://www.ncbi.nlm.nih.gov/pmc/articles/PMC3198538/
- ↑ https://www.mathsisfun.com/data/quartiles.html
- ↑ https://www.mathsisfun.com/definitions/interquartile-range.html
- ↑ https://www.khanacademy.org/math/cc-sixth-grade-math/cc-6th-data-statistics/cc-6th/e/calculating-the-interquartile-range--iqr-
- ↑ https://www.mathsisfun.com/data/quartiles.html
- ↑ https://sphweb.bumc.bu.edu/otlt/mph-modules/bs/bs704_summarizingdata/bs704_summarizingdata7.html
- ↑ https://www.mathgoodies.com/lessons/vol8/median
- ↑ https://sphweb.bumc.bu.edu/otlt/mph-modules/bs/bs704_summarizingdata/bs704_summarizingdata7.html
- ↑ https://www.mathsisfun.com/definitions/interquartile-range.html
About This Article
To find the IQR, start by arranging the numbers in your data set from lowest to highest. Then, divide your data set in half and find the median of both the lower and upper half. If you have an odd amount of numbers, don't include the middle number. Finally, subtract the median of the lower half from the median of the upper half to find the IQR. If you want to know how to use the IQR value, keep reading the article!