X
wikiHow is a “wiki,” similar to Wikipedia, which means that many of our articles are co-written by multiple authors. To create this article, 18 people, some anonymous, worked to edit and improve it over time.
There are 11 references cited in this article, which can be found at the bottom of the page.
This article has been viewed 95,121 times.
Learn more...
A rational function is an equation that takes the form y = N(x)/D(x) where N and D are polynomials. Attempting to sketch an accurate graph of one by hand can be a comprehensive review of many of the most important high school math topics from basic algebra to differential calculus.[1] Consider the following example: y = (2x2 - 6x + 5)/(4x + 2).
Steps
-
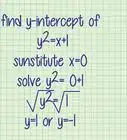
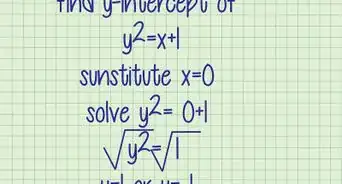
1Find the y intercept.[2] Simply set x = 0. Everything but the constant terms vanish, leaving y = 5/2. Expressing this as a coordinate pair, (0, 5/2) is a point on the graph. Graph that point.
-
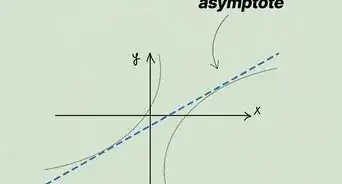
2Find the horizontal asymptote. Long divide the denominator into the numerator to determine the behavior of y for large absolute values of x. In this example, division shows that y = (1/2)x - (7/4) + 17/(8x + 4). For large positive or negative values of x, 17/(8x + 4) approaches zero, and the graph approximates the line y = (1/2)x - (7/4). Using a dashed or lightly drawn line, graph this line.[3]
- If the degree of the numerator is less than the degree of the denominator, there is no division to do, and the asymptote is y = 0.
- If deg(N) = deg(D), the asymptote is a horizontal line at the ratio of the leading coefficients.
- If deg(N) = deg(D) + 1, the asymptote is a line whose slope is the ratio of the leading coefficients.
- If deg(N) > deg(D) + 1, then for large values of |x|, y quickly goes to positive or negative infinity as a quadratic, cubic, or higher degree polynomial. In this case, it probably isn't worthwhile to accurately graph the quotient of the division.
Advertisement -
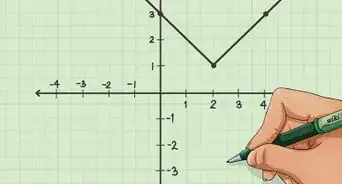
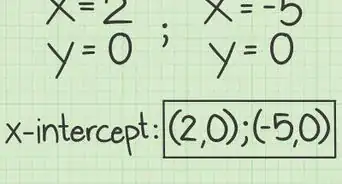
3Find the zeros. A rational function has a zero when it's numerator is zero, so set N(x) = 0. In the example, 2x2 - 6x + 5 = 0. The discriminant of this quadratic is b2 - 4ac = 62 - 4*2*5 = 36 - 40 = -4. Since the discriminant is negative, N(x), and consequently f(x), has no real roots. The graph never crosses the x-axis. If any zeros were found, add those points to the graph.[4]
-
4Find the vertical asymptotes. A vertical asymptote occurs when the denominator is zero.[5] Setting 4x + 2 = 0 gives the vertical line x = -1/2. Graph each vertical asymptote with a light or dashed line. If some value of x makes both N(x) = 0 and D(x) = 0, there may or may not be a vertical asymptote there. This is rare, but see the tips for how to deal with it if it occurs.
-
5Look at the remainder of the division in the step 2. When is it positive, negative, or zero? In the example, the numerator of the remainder is 17 which is always positive. The denominator, 4x + 2, is positive to the right of the vertical asymptote and negative to the left. This means that the graph approaches the linear asymptote from the above for large positive values of x and from below for large negative values of x. Since 17/(8x + 4) can never be zero, this graph never intersects the line y = (1/2)x - (7/4). Don't add anything to the graph right now, but note these conclusions for later.[6]
-
6Find the local extrema.[7] A local extremum may occur whenever N'(x)D(x)- N(x)D'(x) = 0. In the example, N'(x) = 4x - 6 and D'(x) = 4. N'(x)D(x) - N(x)D'(x) = (4x - 6)(4x + 2) - (2x2 - 6x + 5)*4 = 0. Expanding, combining terms, and dividing by 4 leaves x2 + x - 4 = 0. The quadratic formula shows roots near x = 3/2 and x = -5/2. (These differ by about 0.06 from the exact values, but our graph isn't going to be precise enough to worry about that level of detail. Choosing a decent rational approximation makes the next step easier.)
-
7Find the y-values of each local extremum.[8] Plug the x-values from the previous step back into the original rational function to find the corresponding y-values. In the example, f(3/2) = 1/16 and f(-5/2) = -65/16. Add these points, (3/2, 1/16) and (-5/2, -65/16), to the graph. Since we approximated in the previous step, these aren't the exact minima and maxima, but are probably close. (We know (3/2, 1/16) is very close to the local minimum. From step 3, we know that y is always positive when x > -1/2 and we found a value as small as 1/16, so at least in this case, the error is probably less than the thickness of the line.)
-
8Connect the dots and smoothly extend the graph from the known points to the asymptotes taking care to approach them from the correct direction.[9] Take care not to cross the x-axis except at the points already found in step 3. Don't cross the horizontal or linear asymptote except at the points already found in step 5. Don't change from upward sloping to downward sloping except at the extreme found in the previous step.[10]


Advertisement
Community Q&A
-
QuestionHow do I create a graph has no x intercept?
 DonaganTop AnswererThat would be a graph of a function where y is never equal to zero. An example is y = x² + 1. There is no x value for which the corresponding y value is zero. The graph is a parabola opening upward from a minimum y value of 1.
 -
QuestionDon't we at some point take the Limit of the function? If not then, on what kind of the function can we do that?
 OrangejewsCommunity AnswerThe step about horizontal asymptotes finds the limit as x goes to + and - infinity. You might also take one-sided limits at each vertical asymptote to see if the graph approaches +inf or -inf from each side.
Advertisement


References
- ↑ https://www.purplemath.com/modules/grphrtnl.htm
- ↑ https://virtualnerd.com/pre-algebra/linear-functions-graphing/equations/x-y-intercepts/y-intercept-definition
- ↑ https://www.purplemath.com/modules/asymtote2.htm
- ↑ https://www.ck12.org/book/CK-12-Precalculus-Concepts/section/2.8/
- ↑ https://www.purplemath.com/modules/asymtote.htm
- ↑ https://courses.lumenlearning.com/waymakercollegealgebra/chapter/graph-rational-functions/
- ↑ https://www.math.utah.edu/lectures/math1210/18PostNotes.pdf
- ↑ https://www.khanacademy.org/math/in-in-grade-12-ncert/in-in-playing-with-graphs-using-differentiation/copy-of-critical-points-ab/v/identifying-relative-extrema
- ↑ https://www.khanacademy.org/math/algebra2/rational-expressions-equations-and-functions/graphs-of-rational-functions/v/horizontal-vertical-asymptotes
- ↑ https://www.khanacademy.org/math/algebra2/rational-expressions-equations-and-functions/graphs-of-rational-functions/v/another-rational-function-graph-example
- ↑ https://www.khanacademy.org/math/algebra2/polynomial-functions/advanced-polynomial-factorization-methods/v/factoring-5th-degree-polynomial-to-find-real-zeros
About This Article
Advertisement