X
wikiHow is a “wiki,” similar to Wikipedia, which means that many of our articles are co-written by multiple authors. To create this article, 28 people, some anonymous, worked to edit and improve it over time.
There are 14 references cited in this article, which can be found at the bottom of the page.
This article has been viewed 214,629 times.
Learn more...
Statistics is all about data. It helps us to make sense of all the raw data by systematic organisation and interpretation. Knowing how to use statistics gives you the ability to separate the wheat from the chaff.
Steps
Part 1
Part 1 of 3:
Know the Importance of Statistics
-
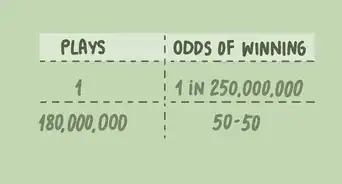
1Note that statistics are used every day. Have you voted for a politician because he claimed his economic policies would lower the unemployment rate and increase the GDP? Have you chosen a surgery that your doctor said would extend your life expectancy by 10 years if successful, but had a 5% risk of serious side effects? Have you chosen to lower your insurance premiums by $30 per month by increasing the deductible from $500 to $1000? These are some of many everyday situations where a good understanding of statistics can serve as a guide to making better decisions.[1]
-
2Work on gaining knowledge of statistics.[2]
- Average - the usual, or what might be considered ordinary - The 'average' family has 2 children (made up statistic).
Advertisement -
3Learn the terms most often used in statistical analysis.[3]
-
4Start applying them to everyday life. They can be found in newspapers, media, politics, and sports.
-
5Learn about statistics in order to understand what others may be telling you and to facilitate your understanding and ability to know what questions to ask.
-
6Learn the best way to represent your statistics, if needed.


Advertisement
Part 2
Part 2 of 3:
The Use of Statistics
Room Full of Kids
Providing a given set of variables, this article will explain the process.
-
1Find some software that will help you manipulate a given set of values.
-
2Insert the values that are displayed in the image. How that is done will depend on your software. Chances are, it will have a grid-like appearance.
-
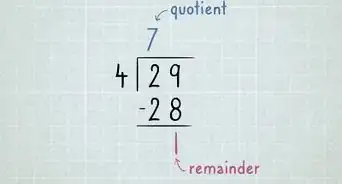
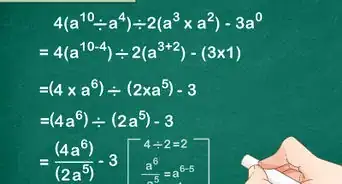
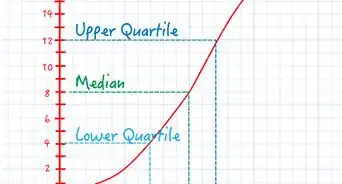
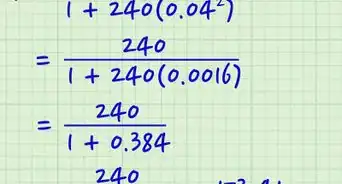
3Query the program. Basically, you are asking the program to come up with (in this instance), the mean (5.5), the mode (6), and the median (6).[4]
- Note that the software doesn't have to lay the information out in a straight line to come up with the answer.
-
4Understand what it indicates. These numbers indicate that if this was a room full of children (24 of them), that the average age (the mean) is 5.5 years old. The mode of six would indicate that there are more six-year-old children than any other age in the room. The median is indicated by taking the data set (1,1,1,2,3,4,4,5,5,5,6,6,6,6,6,7,7,7,7,8,8,8,9,9) and counting 12 in from each side. In this instance, it puts you straight in the middle of the sixes. Therefore, the median is six. You would add the numbers (in this case 6+6), then divide by two, which of course, would be 6.[5]


Advertisement
Seasonal Sports Statistics
-
1Sports statistics and the understanding and manipulation thereof can make or break a person's wallet. Thousands of dollars can be lost on the basis of a point spread. Statistics is the bread and butter of the sports world.
-
2Decide what you are going to use the statistics for. You can use stats to tell about the percentage of games won, the percentage of games won versus another team, etc.
-
3Go to your newspaper for the information or your team's web page or sports web page.
-
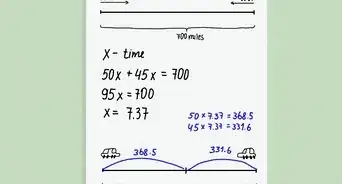
4Calculate the win percentage. Divide the number of wins by the total number of games.[6]
-
5Calculate the loss percentage. Divide the number of losses by the total number of games.
-
6Example:
- Minnesota Vikings have a current tally of 1 win and 3 losses out of 4 games.
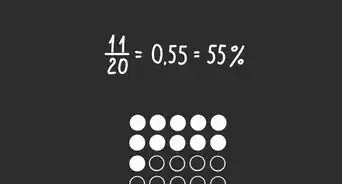
- Divide one by four to get a win percentage of 25%.
- Divide three by four to get a loss percentage of 75%.
- Washington Redskins with 3 wins and 2 losses. This would, seemingly, be comparing apples and oranges, because of the different number of games played.
- Divide three by five for a win percentage of 60%.
- Divide two by five for a loss percentage of 40%.
- With this information, you can tell that the Redskins are easily outplaying the Vikings at this juncture.
- Minnesota Vikings have a current tally of 1 win and 3 losses out of 4 games.


Advertisement
Living Statistics
-
1Living statistics would accomplish stats like Cost of Living, Employment Rate, Crime Rate among many other things.
-
2Pick a site with statistical information about various cities.
-
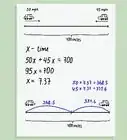
3Determine the median income of your county.
- In the 2000 census, Thurston County, Washington had a median income of $46,975, compared to a national median income of $41,994. By dividing 46,975 by 41,994, you can figure out that Thurston County's median income is 11% higher than the national median income.
- Also in the 2000 census, McDowell County, West Virginia's median income was $16,931 and the national median income was $41,994. Divide 16,931 by 41,994 to see that McDowell County is 40% below the national median.


Advertisement
Crime Statistics

Political Statistics[9]

Part 3
Part 3 of 3:
Definitions
-
1
-
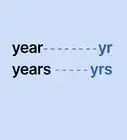
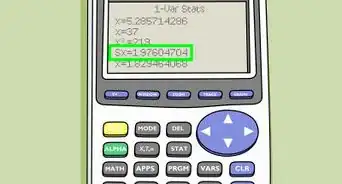
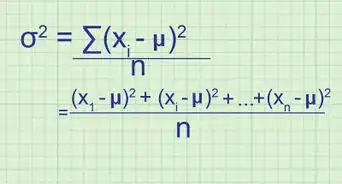
2Median - Relates to, or constitutes the middle value of a distribution.[11]
- Find the Median of: 9, 3, 44, 17, 15 (Odd amount of numbers)
- Line up your numbers: 3, 9, 15, 17, 44 (smallest to largest)
- The Median is: 15 (The number in the middle)
- Find the Median of: 8, 3, 44, 17, 12, 6 (Even amount of numbers)
- Line up your numbers: 3, 6, 8, 12, 17, 44
- Add the 2 middles numbers and divide by 2: 8+12 = 20 ÷ 2 = 10
- The Median is 10.
- Find the Median of: 9, 3, 44, 17, 15 (Odd amount of numbers)
-
3Standard Deviation - A measure of the spread of the values in a given set. The higher the standard deviation, the less numbers in the set tend to cluster near the mean.[12]
-
4Distribution - Statistical data arranged to show the frequency with which the possible values of a variable occur.
-
5Bell-shaped curve - The curve representing a continuous frequency distribution with a shape having the overall curvature of the vertical cross section of a bell; usually applied to the normal distribution.[13]
-
6Probability - The measure of how likely something is going to occur (e.g. the chances of the coin landing on heads is 1/2, the chances of a dice rolling in a certain number is 1/6).[14]
-
7Outliers - are the numbers that can feasibly throw off the statistics because they are 'one offs'. By that, they are atypical of the rest of the data.[15]


Advertisement
Community Q&A
-
QuestionWhy do I use standard deviation?
 Community AnswerStandard deviation is a measure of the variation or diversity of scores in a set of data. It is used to determine how much data varies from the average of a population, to measure uncertainty and is also used to measure the volatility of a stock.
 -
QuestionGive you tell me some details about these commonly-used descriptive statistics: frequency, mean, mode, median and standard deviation?
 DonaganTop Answerer
 -
QuestionIf the variance of given data is 100 and if it's coefficient of variation is 20%, then what's the mean?
 Community Answer200 CV is equal to the standard deviation by the mean. Twenty percent equals 100 divided by the mean. Therefore, the mean is 20 percent times 100.
Advertisement
Warnings
- Statistics are only as good or as bad as the person wielding them. Take every use of statistics with a grain of salt and use your knowledge of statistics to come to a decision of your own.⧼thumbs_response⧽
Advertisement

-Step-13.webp)
-Step-24-Version-2.webp)
References
- ↑ https://onlinedegrees.mtu.edu/news/every-number-counts-importance-applied-statistics-our-daily-lives-infographic
- ↑ https://stats.libretexts.org/Bookshelves/Introductory_Statistics/Book%3A_Introductory_Statistics_(Shafer_and_Zhang)/01%3A_Introduction_to_Statistics/1.01%3A_Basic_Definitions_and_Concepts
- ↑ https://openstax.org/books/introductory-business-statistics/pages/1-1-definitions-of-statistics-probability-and-key-terms
- ↑ https://www.khanacademy.org/math/statistics-probability/summarizing-quantitative-data/mean-median-basics/a/mean-median-and-mode-review
- ↑ https://www.khanacademy.org/math/statistics-probability/summarizing-quantitative-data/mean-median-basics/a/mean-median-and-mode-review
- ↑ https://www.omnicalculator.com/sports/winning-percentage
- ↑ http://www.bestplaces.net/crime/
- ↑ http://www.merriam-webster.com/dictionary/recidivism
- ↑ http://www.infoplease.com/ipa/A0873848.html
- ↑ https://www150.statcan.gc.ca/n1/edu/power-pouvoir/ch11/mode/5214873-eng.htm
- ↑ https://www.mathsisfun.com/median.html
- ↑ https://www.mathsisfun.com/data/standard-deviation.html
- ↑ https://www.khanacademy.org/math/statistics-probability/modeling-distributions-of-data/normal-distributions-library/a/normal-distributions-review
- ↑ https://www.khanacademy.org/math/statistics-probability/probability-library/basic-theoretical-probability/a/probability-the-basics
- ↑ https://courses.lumenlearning.com/introstats1/chapter/outliers/
About This Article
Advertisement


-Step-13.webp)