wikiHow is a “wiki,” similar to Wikipedia, which means that many of our articles are co-written by multiple authors. To create this article, volunteer authors worked to edit and improve it over time.
The wikiHow Tech Team also followed the article's instructions and verified that they work.
This article has been viewed 68,502 times.
Learn more...
Grouping your data into a pivot table allows you to arrange the information as you like and provides a way to illustrate the conclusions you can make from analyzing the data. Adding a field to a pivot table gives you another way to refine, sort and filter the data. The field you choose to add to your pivot table can be used as a row label, column label or even a report filter, depending upon your needs. Regardless of the scenario, we've got you covered.
Steps
-
1Launch Microsoft Excel.
-
2Open the workbook file containing the source data and pivot table you'll be working with.Advertisement
-
3Select the tab for the worksheet on which your pivot table is displayed by clicking it.
-
4Click inside the pivot table to force the Pivot Table Field List or Pivot Table Wizard to appear.
-
5Review the pivot table, making note of the fields that have already been used as row labels and column labels.
-
6Compare the pivot table to the source data to ascertain which fields remain available to be used.
-
7Determine which field you would like to add to your pivot table.
-
8Decide how you would like your data to be arranged by that field.
- In a pivot table, the data is grouped and then arranged by the row and column fields. The data can then be filtered by a "Filter Report" field.
- Add a field to your pivot table to provide another method by which the data is organized.
-
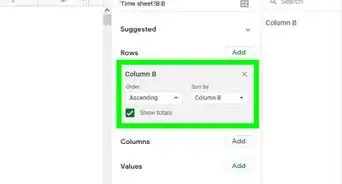
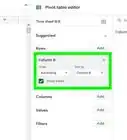
9Drag the field you are adding and drop it into the "Row Labels" area.
-
10Reorder the row labels in this section and observe how your pivot table changes.
-
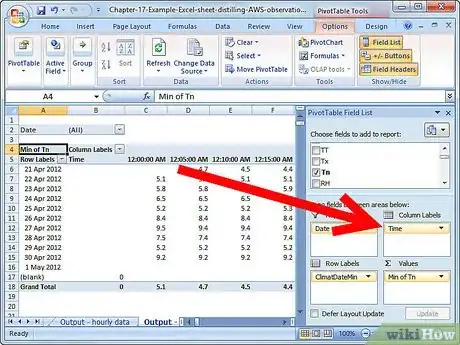
11Move the field into the "Column Labels" area and determine if this arrangement better suits your needs.
- You can also reorder the fields in this section; doing so will provide a different display and grouping of the data.
-
12Add a field to the "Report Filter" section and then click the arrow beside that filter in the pivot table.
-
13Review the values made available by this filter field to test this arrangement.
-
14Finalize your decision for the placement and arrangement of your newly added field.
- Click and drag the field name of your added field and drop it into your preferred section in the "Pivot Table Field List."


