wikiHow is a “wiki,” similar to Wikipedia, which means that many of our articles are co-written by multiple authors. To create this article, 46 people, some anonymous, worked to edit and improve it over time.
This article has been viewed 333,674 times.
Learn more...
Line graphs provide a visual representation of the relationship between variables and how that relationship changes.[1] For example, you might make a line graph to show how an animal's growth rate varies over time, or how a city's average high temperature varies from month to month. You can also graph more than one data set on the same line graph, as long as it relates the same two variables. So how do you make a line graph? Just follow these steps below to find out.
Steps
Labeling the Graph
-
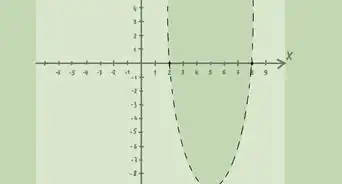
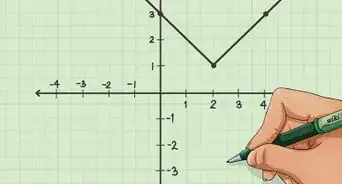
1Draw a large cross in the middle of your graph paper. This represents the two axes y and x -- one vertical (going up-and-down), one horizontal (going left-and-right). The vertical axis is designated the Y-axis and the horizontal as the X-axis. The place where the lines cross is called the origin.
- The areas below the X-axis and to the left of the Y-axis represent negative numbers. If your data set doesn't include negative numbers, you can omit those portions of the graph.
-
2Label each axis with the variable it represents. To continue the temperature-time example from the introduction, you would label the x-axis as months during the year, and the y-axis as temperature.[2]Advertisement
-
3Identify the range of data you have to include for each variable.[3] To continue the temperature-time example, you'd select a range that was large enough to include the highest and lowest temperatures you plan to graph. If the range isn't very high, you can have a larger scale, spreading it out more so that it fills up the graph instead of just covering 10% of it.
-
4Decide how many units every line on the graph represents for each of your variables. You might designate a scale of 10 degrees Fahrenheit (12.22 degrees Celsius) per line to measure temperature along the Y-axis, and a scale of one month per line to measure time along the X-axis.
- Label several of the lines along each axis with the scale measurements. You don't need to label every line, but you should space the labeled line at regular intervals along the axis.


Plotting Your Data
-
1Plot your data on the graph. For example: If the high temperature in your hometown was 40 degrees Fahrenheit (4.44 degrees Celsius) in January, locate the "January" line on the X-axis and the "40 degrees" line on the Y-axis. Trace both lines to the point where they intersect. Place a dot on the intersection. Repeat for all of your other data until you've plotted each point on the graph.[4]
-
2Connect the left-most dot and the dot to its right with a straight line. Continue connecting the dots, one by one, working from left to right.[5] Make sure that it looks like you're connecting the points with straight lines only, so that the graph does not look curved. Once you've connected all of the points, you will have successfully graphed all of the data.
-
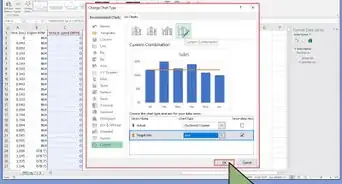
3Repeat the process if you're graphing multiple data sets. If you're graphing multiple data sets on the graph, use a distinctive color of pen, or style of line, for the first data set. Place an example of the color/line style off to the side of the graph and label it with the name of the information being displayed. For example: "High Temperatures."
- Repeat steps 1 and 2 for the next data set, using a different-color pen or a different style of line for each data set.
- Place an example of the second line color/style in the margin and label it, too. For example, you could use a red pen to graph high temperatures, then use a blue pen to graph low temperatures over the same period on the same graph. Continue repeating steps 1 and 2 for each remaining data set you want to include on the graph.
-
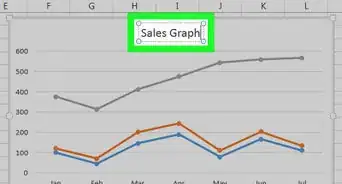
4Write the graph's title at the top of the page. For example: Average Monthly High and Low Temperatures in Seattle, 2009. You should do this last after you know how much space all of the graphs will take up on the page.[6]


Community Q&A
-
QuestionHow do I make a double line graph?
 DonaganTop AnswererA double line graph is simply the lines of two equations plotted on the same graph.
 -
QuestionHow far apart should I put the time labels on the x-axis?
 Community AnswerIt would probably be most efficient to put the numbers on every gridline or every other gridline.
 -
QuestionHow do I draw a line graph for showing the water meter amount each day?DonaganTop AnswererOne axis would represent the amount used. The other axis would represent the date.
Things You'll Need
- Graph paper (have extra paper if needed)
- Pen or pencil
- Ruler


References
- ↑ https://labwrite.ncsu.edu/res/gh/gh-linegraph.html
- ↑ https://www.mathsisfun.com/data/line-graphs.html
- ↑ https://www.rapidtables.com/tools/line-graph.html
- ↑ https://labwrite.ncsu.edu/res/gh/gh-linegraph.html
- ↑ https://www.wtamu.edu/academic/anns/mps/math/mathlab/col_algebra/col_alg_tut27_graphline.htm
- ↑ https://www.mathsisfun.com/data/line-graphs.html
- http://www.saburchill.com/facts/facts0013.html
About This Article
To make a line graph, start by drawing a large cross in the middle of your graph paper to represent the x- and y-axis. Next, label each axis with the variable it represents and also label each line with a value, making sure that you’re including the whole range of your data. Once you’ve labeled the graph, place a dot on the graph where the lines intersect for each piece of data in your set. Finally, connect the dots from left to right using straight lines between each dot, or data point. For tips on how to graph multiple data sets in one graph, read on!