This article was co-authored by wikiHow staff writer, Nicole Levine, MFA. Nicole Levine is a Technology Writer and Editor for wikiHow. She has more than 20 years of experience creating technical documentation and leading support teams at major web hosting and software companies. Nicole also holds an MFA in Creative Writing from Portland State University and teaches composition, fiction-writing, and zine-making at various institutions.
This article has been viewed 26,557 times.
Learn more...
This wikiHow teaches you how to to use the SQL Server Query Store to monitor the performance of your database queries.
Steps
Enabling the Query Store
-
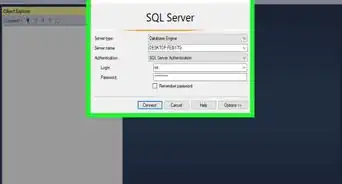
1Open the SQL Server Management Studio. You can use the Query Store feature of SQL Server to monitor your database for performance issues. This feature is included with SQL Server 2016 and later, but you'll need to enable it manually.[1]
-
2Open Object Explorer. If you don’t see Object Explorer already, click the View menu at the top of the screen, then click Object Explorer.[2]Advertisement
-
3Right-click the database you want to check. A menu will appear.[3]
- The Query Store can’t be used to monitor the master or tempdb databases.
-
4Click Properties.
-
5Click Query Store. It’s on the Properties dialog box.
-
6Select On under ″Operation Mode (Requested).″ The Query Store will begin tracking all queries.
-
7Refresh the database in the Object Explorer panel. This adds the Query Store folder to the panel.
-
8Customize when the Query Store aggregates new data. The Query Store will aggregate new stats every 60 minutes by default. Here’s how to change the interval (using 15 minutes as an example):[4]
- ALTER DATABASE <database_name>
- SET QUERY_STORE (INTERVAL_LENGTH_MINUTES = 15);.


Finding the Top Resource-consuming Queries
-
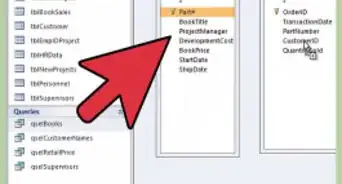
1Click the - next to ″Query Store″ in the Object Explorer. This displays all Query Store options.
- Use this method to find out which specific queries are using the most server resources.[5]
-
2Click Top Resource Consuming Queries. This opens a graph that displays the 25 most resource-consuming queries in the database. These results are pretty broad, but you can further customize the graph to get more helpful information.[6]
-
3Click Configure. It’s at the top-right corner of the report. A dialog window will appear.
-
4Select your resource consumption criteria. In the top section (″Resource Consumption Criteria″), choose which resource you want to check (e.g., CPU Time, Memory Consumption), and the desired statistic (e.g., Avg, Total).
-
5Select a time period. Under the ″Time Interval″ section, choose the time period for which you want to view results. You can select an option from the drop-down menu or insert specific dates into the provided boxes.
-
6Choose how many results to see. To see all queries for the selected time period, click All under the ″Return″ header. To display a specific number of queries, select Top and enter a number (e.g. 10, 100).
- If you want to stick to the top 25 worst offenders, there’s no need to make any changes under the ″Return″ header.
-
7Click OK. The stats will now refresh to display what you want to see.
-
8Adjust the view (optional). Use the small graph icons (the grid, chart, and bar graph) to view the results in various formats. These buttons are at the top-right corner of the results.


Checking for Regressed Queries
-
1Click the - next to ″Query Store″ in the Object Explorer. This displays all Query Store options.
- Use this method to find specific queries that are performing more slowly than they used to.[7]
-
2Click Regressed Queries. This opens the Regressed Queries panel, where you’ll find the queries and plans in the Query Store.[8]
-
3Select a plan from the first drop-down menu. It’s the menu labeled ″Check for regression in″ above the top-left corner of the panel. Each of the plans will display a different graphical performance report for your queries.
- For example, if you want to check for issues with in the amount of time it takes for queries to run, select Duration.
- To see issues relating to RAM usage, select Memory Consumption.
-
4Select a statistic from the second drop-down menu. This is the menu labeled ″Based on″ (to the right of the previous menu. This re-displays the results.


References
- ↑ https://docs.microsoft.com/en-us/sql/relational-databases/performance/monitoring-performance-by-using-the-query-store?view=sql-server-2017
- ↑ https://docs.microsoft.com/en-us/sql/ssms/object/open-and-configure-object-explorer?view=sql-server-2017
- ↑ https://docs.microsoft.com/en-us/sql/relational-databases/performance/monitoring-performance-by-using-the-query-store?view=sql-server-2017
- ↑ https://docs.microsoft.com/en-us/sql/relational-databases/performance/monitoring-performance-by-using-the-query-store?view=sql-server-2017#Regressed
- ↑ https://docs.microsoft.com/en-us/sql/relational-databases/performance/query-store-usage-scenarios?view=sql-server-2017
- ↑ https://blogs.msdn.microsoft.com/docast/2017/07/27/troubleshoot-sql-query-performance-issues-using-query-store/
- ↑ https://www.scarydba.com/2016/09/19/query-store-plan-forcing-use/
- ↑ https://docs.microsoft.com/en-us/sql/relational-databases/performance/monitoring-performance-by-using-the-query-store?view=sql-server-2017#Regressed


About This Article

1. Enable the Query Store in Management Studio.
2. Refresh the database.
3. Expand the Query Store folder.
4. Click Top Resource Consuming Queries.
5. Click Configure.
6. Set your parameters.
7. Click OK.