Learn to plot and graph polar equations using radians, angles, and tables
X
wikiHow is a “wiki,” similar to Wikipedia, which means that many of our articles are co-written by multiple authors. To create this article, 15 people, some anonymous, worked to edit and improve it over time.
This article has been viewed 80,039 times.
Learn more...
Polar functions are functions of the form r = f(θ). While you can make some really cool graphs with them, they are really quite tricky to work with.[1]
Steps
-
1Understand how polar equations work. Coordinates in polar equations are of the form (r,θ), where r represents radius and θ represents angle. This means you rotate θ radians around and go out r units.[2]
-
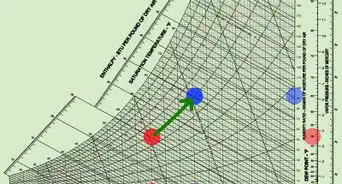
2Make a table with values of the angle and radius. Take any random values of θ (around ten values would suffice) and calculate r against each of them using the relationship given between r and θ. This will help you plot them out on a graph easier, because you can just refer to a table instead of having to come up with coordinates in your head.[3]Advertisement
-
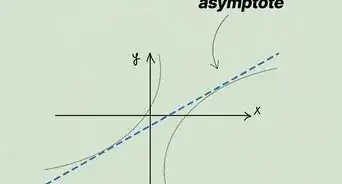
3Plot the various (r,θ) points as found in the table.[4]
The wikiHow How to Plot Polar Coordinates will be helpful. -
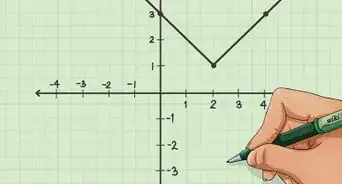
4Join the plotted points with a smooth curve and you're done![5]


Advertisement
Community Q&A
-
QuestionHow do I graph r = 2 + 3cos theta?
 Community AnswerMake a theta and r table. Plug in various values of theta. Lastly, graph on polar graph paper.
 -
QuestionHow do I graph 1 - 3 sin theta?
 DonaganTop AnswererLet one of the axes (say, the x-axis) show the values of theta (Θ) from 0° to 90° (or higher). Let the other axis (y) show the values of the function (1 - 3 sin Θ). Construct a table of values pairing each theta value with its respective function value. Then plot the graph as you would with x and y values. You'll need a trig table for the sine values.
Advertisement
Warnings
- If you graph this by hand, making θ's interval too large will result in an inaccurate graph. Try to choose an interval that won't be too inaccurate but won't be too time consuming to graph.⧼thumbs_response⧽
Advertisement


References
- ↑ https://www.khanacademy.org/math/ap-calculus-bc/bc-advanced-functions-new/bc-9-7/v/derivatives-in-polar-coordinates
- ↑ https://courses.lumenlearning.com/boundless-algebra/chapter/the-polar-coordinate-system/
- ↑ https://openstax.org/books/calculus-volume-2/pages/7-3-polar-coordinates
- ↑ https://www.ck12.org/book/ck-12-trigonometry-second-edition/section/6.2/
- ↑ https://www.alamo.edu/contentassets/35e1aad11a064ee2ae161ba2ae3b2559/additional/math2412-graphs-polar-equations.pdf
About This Article
Advertisement