Economy of Russia
The economy of Russia has gradually transformed from a planned economy into a mixed market-oriented economy.[28] It has enormous natural resources, particularly oil and natural gas.[29] It is the world's 11th-largest economy by nominal GDP, and 6th-largest by purchasing power parity (PPP).[5] Due to a volatile currency exchange rate, Russia's GDP as measured in dollars fluctuates sharply.[30] Russia's membership to the WTO was accepted in 2011.
 | |
| Currency | Russian ruble (RUB, ₽) |
|---|---|
| calendar year[1] | |
Trade organizations | WTO, BRICS, EAEU, CIS, GECF, APEC, G20 and others |
Country group |
|
| Statistics | |
| Population | |
| GDP | |
| GDP rank | |
GDP growth |
|
GDP per capita | |
GDP per capita rank | |
GDP by sector |
|
Population below poverty line | |
Labor force | |
Labor force by occupation |
|
| Unemployment |
|
Average gross salary | RUB 76,604 / €700 per month |
| RUB 66,645 / €609 per month | |
Main industries | Complete range of mining and extractive industries producing coal, oil, gas, chemicals, and metals; all forms of machine building from rolling mills to high-performance aircraft and space vehicles; defence industries (including radar, missile production, advanced electronic components), shipbuilding; road and rail transportation equipment; communications equipment; agricultural machinery, tractors, and construction equipment; electric power generating and transmitting equipment; medical and scientific instruments; consumer durables, textiles, foodstuffs, handicrafts |
| External | |
| Exports | |
Export goods | crude petroleum, refined petroleum, natural gas, coal, wheat, iron (2019) |
Main export partners |
|
| Imports | |
Import goods | cars and vehicle parts, packaged medicines, broadcasting equipment, aircraft, computers (2019) |
Main import partners |
|
FDI stock | |
Gross external debt | |
| Public finances | |
| 3.8% of GDP (2022)[22] | |
| Revenues | 49.606 ₽ trillion[20] 33.22% of GDP (2022)[20] |
| Expenses | 53.038 ₽ trillion[20] 35.52% of GDP (2022)[20] |
Russia's vast geography is an important determinant of its economic activity, with the country holding a large share of the world's natural resources.[31] It has been widely described as an energy superpower;[32] as it has the world's largest natural gas reserves,[33] 2nd-largest coal reserves,[34] 8th-largest oil reserves,[35] and the largest oil shale reserves in Europe.[36] It is the world's leading natural gas exporter,[37] the 2nd-largest natural gas producer,[38] and the 2nd-largest oil exporter,[39] and producer.[40] Russia's foreign exchange reserves are the world's 4th-largest.[41] It has a labour force of roughly 70 million people, which is the world's 7th-largest.[42] Russia is the world's 3rd-largest exporter of arms.[43] The oil and gas sector accounted up to roughly 40% of Russia's federal budget revenues, and up to 60% of its exports in 2019.[44] Russia has the world's 5th-largest number of billionaires.[45] Russias inequality of household income and wealth remains comparatively high.[46]
Following the 2022 Russian invasion of Ukraine, the country has faced several sanctions and boycotts from the Western world and its allies, to isolate the Russian economy from the Western financial system.[47] In spite of economic sanctions, Russia's economy appears relatively resilient.[48][49][50][51]
History
The Russian economy is volatile. Since 1989 its institutional environment was transformed from a socialist command economy to a capitalistic market system. Its industrial structure dramatically shifted away from heavy investment in manufacturing and agriculture toward market services, oil, gas, and mining. Richard Connolly argues that for the last four centuries, there are four main characteristics of the Russian economy that have shaped the system and persisted despite the political upheavals. First of all the weakness of the legal system means that impartial courts do not rule and contracts are problematic. Second is the underdevelopment of modern economic activities, with very basic peasant agriculture dominant into the 1930s. Third is technological underdevelopment, eased somewhat by borrowing from the West in the 1920s. And fourth lower living standards compared to Western Europe and North America.[52]
Russian Empire
Soviet Union
Beginning in 1928, the course of the Soviet Union's economy was guided by a series of five-year plans. By the 1950s, the Soviet Union had rapidly evolved from a mainly agrarian society into a major industrial power.[53] By the 1970s the Soviet Union was in an Era of Stagnation. The complex demands of the modern economy and inflexible administration overwhelmed and constrained the central planners. The volume of decisions facing planners in Moscow became overwhelming. The cumbersome procedures for bureaucratic administration foreclosed the free communication and flexible response required at the enterprise level for dealing with worker alienation, innovation, customers, and suppliers.

From 1975 to 1985, corruption and data manipulation became common practice within the bureaucracy to report satisfied targets and quotas, thus entrenching the crisis. Starting in 1986, Mikhail Gorbachev attempted to address economic problems by moving towards a market-oriented socialist economy. Gorbachev's policies of Perestroika failed to rejuvenate the Soviet economy; instead, a process of political and economic disintegration culminated in the breakup of the Soviet Union in 1991.
Transition to market economy (1991–98)
.jpg.webp)
Following the collapse of the Soviet Union, Russia underwent a radical transformation, moving from a centrally planned economy to a globally integrated market economy. Corrupt and haphazard privatization processes turned over major state-owned firms to politically connected "oligarchs", which has left equity ownership highly concentrated.
Yeltsin's program of radical, market-oriented reform came to be known as a "shock therapy". It was based on the policies associated with the Washington Consensus, recommendations of the IMF and a group of top American economists, including Larry Summers[54][55][56] who in 1994 urged for "the three '-ations'—privatization, stabilization, and liberalization" to be "completed as soon as possible."[57] With deep corruption afflicting the process, the result was disastrous, with real GDP falling by more than 40% by 1999, hyperinflation which wiped out personal savings, crime and destitution spreading rapidly.[58][59] The jump in prices from shock therapy wiped out the modest savings accumulated by Russians under socialism and resulted in a regressive redistribution of wealth in favour of elites who owned non-monetary assets.[60]
Shock therapy was accompanied by a drop in the standard of living, including surging economic inequality and poverty,[61] along with increased excess mortality[62][63] and a decline in life expectancy.[64] Russia suffered the largest peacetime rise in mortality ever experienced by an industrialized country.[65] Likewise, the consumption of meat decreased: in 1990, an average citizen of the RSFSR consumed 63 kg of meat a year; by 1999, it had decreased to 45 kg.[66]
The majority of state enterprises were privatized amid great controversy and subsequently came to be owned by insiders[67] for far less than they were worth.[55] For example, the director of a factory during the Soviet regime would often become the owner of the same enterprise. Under the government's cover, outrageous financial manipulations were performed that enriched a narrow group of individuals at key positions of business and government.[68] Many of them promptly invested their newfound wealth abroad, producing an enormous capital flight.[69] This rapid privatization of public assets, and the widespread corruption associated with it, became widely known throughout Russia as "prikhvatizatisiya," or "grab-itization."[70]
Difficulties in collecting government revenues amid the collapsing economy and dependence on short-term borrowing to finance budget deficits led to the 1998 Russian financial crisis.
In the 1990s Russia was "the largest borrower" from the International Monetary Fund, with loans totalling $20 billion. The IMF was criticised for lending so much, as Russia introduced little of the reforms promised for the money and a large part of these funds could have been "diverted from their intended purpose and included in the flows of capital that left the country illegally".[71][72]
Recovery and growth (1999–2008)
Russia bounced back quickly from the August 1998 financial crash, partly because of a devaluation of the ruble, which made domestic producers more competitive nationally and internationally.
Between 2000 and 2002, significant pro-growth economic reforms included a comprehensive tax reform, which introduced a flat income tax of 13%; and a broad effort at deregulation which benefited small and medium-sized enterprises.[73]
Between 2000 and 2008, Russian economy got a major boost from rising commodity prices. GDP grew on average 7% per year.[58] Disposable incomes more than doubled and in dollar-denominated terms increased eightfold.[74] The volume of consumer credit between 2000 and 2006 increased 45 times, fuelling a boom in private consumption.[75][76] The number of people living below poverty line declined from 30% in 2000 to 14% in 2008.[77][78]
Inflation remained a problem however, as the central bank aggressively expanded money supply to combat appreciation of the ruble.[79] Nevertheless, in 2007 the World Bank declared that the Russian economy achieved "unprecedented macroeconomic stability".[80] Until October 2007, Russia maintained impressive fiscal discipline with budget surpluses every year from 2000.[73]
2009–14

Russian banks were hit by the global credit crunch in 2008, though no long term damage was done thanks to proactive and timely response by the government and central bank, which shielded the banking system from effects of the global financial crisis.[81][82][83] A sharp, but brief recession in Russia was followed by a strong recovery beginning in late 2009.[58]
Between 2000 and 2012 Russia's energy exports fuelled a rapid growth in living standards, with real disposable income rising by 160%.[84] In dollar-denominated terms this amounted to a more than sevenfold increase in disposable incomes since 2000.[74] In the same period, unemployment and poverty more than halved and Russians' self-assessed life satisfaction also rose significantly.[85] This growth was a combined result of the 2000s commodities boom, high oil prices, as well as prudent economic and fiscal policies.[86] However, these gains have been distributed unevenly, as the 110 wealthiest individuals were found in a report by Credit Suisse to own 35% of all financial assets held by Russian households.[87][88] Russia also has the second-largest volume of illicit money outflows, having lost over $880 billion between 2002 and 2011 in this way.[89] Since 2008 Forbes has repeatedly named Moscow the "billionaire capital of the world".[90]
In July 2010, Russia together with Belarus and Kazakhstan became a founding member of the Customs Union of the Eurasian Economic Community (EurAsEC), and the EurAsEC Single Economic Space, a common market of the same countries, came into force on January 1, 2012, superseding the bilateral agreements on free trade. At the same time Russia's membership to the WTO was accepted in 2011.[91] Russia joined the World Trade Organization (WTO) on 22 August 2012 after 19 years of negotiations.[92][93][94] On September 20, 2012 the multi-lateral Free Trade Area of the Commonwealth of Independent States (CIS FTA) came into force for Russia and subsequently superseded previous bilateral agreements among 9 participating post-Soviet states.[95] In 2015, Russia became a founding member of the Eurasian Economic Union (EAEU), which replaced EurAsEC and envisaged a supranational economic union (the deepest stage of economic integration[96]).[97]
Rapid GDP and income growth continued until 2013. The most important topic of discussion in the economy for a decade was the middle-income trap. In 2013, the World Bank announced that Russia had graduated to a high-income economy based on the results of 2012[98][99][100] but in 2016 it was reclassified as an upper-middle income economy[101][102] due to changes in the exchange rate of the Russian ruble, which is a floating currency. While the UN Human Development Index, which assesses progress in the standard of living, health and education, ranks Russia among the 'very high human development' countries.[103][104]
Russian leaders repeatedly spoke of the need to diversify the economy away from its dependence on oil and gas and foster a high-technology sector.[105] In 2012 oil, gas and petroleum products accounted for over 70% of total exports.[106] This economic model appeared to show its limits, when after years of strong performance, the Russian economy expanded by a mere 1.3% in 2013.[58] Several reasons were proposed to explain the slowdown, including a prolonged recession in the EU, which is Russia's largest trading partner, stagnant oil prices, lack of spare industrial capacity and demographic problems.[107] Political turmoil in neighbouring Ukraine added to the uncertainty and suppressed investment.
2014–21
.svg.png.webp)
Following the annexation of Crimea in March 2014 and Russia's involvement in the ongoing War in Donbas, the United States, the European Union, Canada and Japan imposed sanctions on Russia.[108] This led to the decline of the Russian ruble and sparked fears of a Russian financial crisis. Russia responded with sanctions against a number of countries, including a one-year period of total ban on food imports from the European Union and the United States.
According to the Russian economic ministry in July 2014, GDP growth in the first half of 2014 was 1%. The ministry projected growth of 0.5% for 2014.[109] The Russian economy grew by a better than expected 0.6% in 2014.[110] Russia is rated one of the most unequal of the world's major economies.[111]
As of 2015, real income was still lower for 99% of Russians than it was in 1991.[65]
The Russian economy risked going into recession from early 2014, mainly due to falling oil prices, sanctions, and the subsequent capital flight.[112] While in 2014 GDP growth remained positive at 0.6%,[113] in 2015 the Russian economy shrunk by 3.7% and was expected to shrink further in 2016.[114] By 2016, the Russian economy rebounded with 0.3% GDP growth and officially exited recession. The growth continued in 2017, with an increase of 1.5%.[115][116]
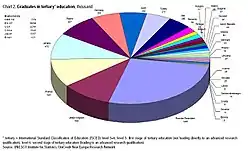
In January 2016, Bloomberg rated Russia's economy as the 12th most innovative in the world,[117] up from 14th in January 2015[118] and 18th in January 2014.[119] Russia has the world's 15th highest patent application rate, the 8th highest concentration of high-tech public companies, such as internet and aerospace and the third highest graduation rate of scientists and engineers.[117]
According to the British company BP (Statistical Yearbook 2018), proven oil reserves in Russia at the end of 2017 were 14.5 billion tons, natural gas was 35 trillion cubic meters.[120] Gold reserves in Russia's subsoil, according to the U.S. Geological Survey, were 5,500 tons at the end of 2017.[121]
In 2019, the Ministry of Natural Resources estimated the country's mineral reserves in physical terms. At the end of 2017, oil reserves were 9.04 billion tons, gas reserves were 14.47 trillion cubic meters, gold reserves were 1,407 tons, and diamonds reserves were 375 million metric carats. Then for the first time the Ministry evaluated the mineral reserves of Russia in terms of value. The value of oil reserves amounted to 39.6 trillion rubles, the value of gas amounted to 11.3 trillion rubles, coking coal amounted to almost 2 trillion rubles, iron ore amounted to 808 billion rubles, diamonds amounted to 505 billion rubles, gold amounted to 480 billion rubles. The combined value of all mineral and energy resources (oil, gas, gold, copper, iron ore, thermal and lignite coal, and diamonds) amounted to 55.24 trillion rubles (US$844 billion), or 60% of GDP for 2017. The assessment occurred after the adoption of a new classification of reserves in Russia and the object of the methodology was only those fields for which a license was issued, so the assessment of the Ministry of Natural Resources is less than the total volume of explored reserves. Experts criticized such "an unsuccessful attempt to estimate reserves," pointing out that "one should not take such an estimate seriously" and "the form contains an incorrect formula for calculating the value".[122][123]
2022–present
In 2022, there have been heavy sanctions due to the Russian invasion of Ukraine that will likely result in steep recession.[124] Since early 2022 many official economic statistics are not published.[125] Sanctions also included asset freezes on the Russian Central Bank,[126] which holds $630 billion in foreign-exchange reserves,[127] to prevent it from offsetting the impact of sanctions.[128]
According to most estimates, every day of the war in Ukraine costs Russia $500 million to $1 billion.[129][130][131]
On 27 June 2022 Russia defaulted on part of its foreign currency, its first such default since 1918.[132]
In November 2022 it was reported that Russia had officially entered a recession as the Federal State Statistics Service had reported a national GDP loss for the second consecutive quarter.[133]
As part of the sanctions imposed on Russia, on 2 September 2022, the finance ministers of the G7 group agreed to cap the price of Russian oil and petroleum products, designed to allow Russia to maintain production, but limiting the revenue from oil sales.[134][135]
In 2022, the Economist calculated that Russia did graduate into the category of high-income economies by 2022, if counted at purchasing power parity rather than the exchange rate, but could fall below the threshold because of invasion of Ukraine.[136] In December 2022 in a study an economist at the Bank of Russia’s Research and Forecasting Department, finds that the import dependence of the Russian economy is relatively low, does not exceed the median for other countries and the share of imports in most industries is lower than in other countries. The key explanation for this could be the low involvement of the Russian economy in global value supply chains and its focus on production of raw materials. However, 60% of Russia’s imports come from the countries that have announced sanctions against Russia.[137]
TASS reported poor results for the Russian economy for quarter 1 2023 with revenues of 5.7 trillion roubles – down 21% (mainly due to falling oil revenues), expenditure 8.1 trillion roubles – up 34% (mainly due to increased military costs), creating a deficit 2.4 trillion roubles – ($29.4 billion)[138]
Following Central Bank of Russia interventions, the exchange rate of rouble against the dollar remained relatively stable in 2022, although in 2023 it started to decrease significantly, reaching 97 RUB per 1 USD on 15 August 2023. Both the interventions and the exchange rate decrease resulted in significant criticism of the Central Bank by Russian state propaganda.[139] Quarter 2 of 2023 saw a 13% fall in the value of the rouble against the dollar and a current account surplus estimated in to be falling by 80% from the annual 2022 surplus of $233 billion.[140]
In August and September 2022 the Central Bank of Russia started raising the key lending rate, ending up at 13% in September, while USD to RUB exchange rate remained at 95 RUB.[141] As of June 2023 share of Russia's exports to EU dropped to 1.7% while Russia's imports from EU dropped to 1.5%.[142] In October 2023 the "psychological barrier" of 100 RUB per 1 USD was crossed.[143]
The 2024 budget expects revenues of 35 trillion rubles ($349 billion) with expenditure of 36.6 trillion, based on a Urals oil forecast of $71.30 per barrel, a 90.1 rubles to 1 USD exchange rate and inflation of 4.5%. Defence spending will double to 10.78 trillion, 29.4% of expenditure. Russia currently has a record low unemployment rate of just 3 percent.[144]
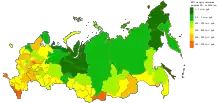
_per_capita_in_2022_by_IMF.png.webp) Gross domestic product (PPP) per capita in April 2022
Gross domestic product (PPP) per capita in April 2022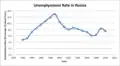 Unemployment rate of Russia since the fall of the Soviet Union
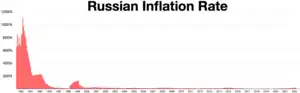
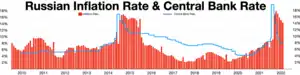 Russian inflation rate 2012–2022
Data
The following table shows the main economic indicators in 1980–2021. Inflation below 5% is in green.[145]
| Year | GDP
(in Bil. US$PPP) |
GDP per capita
(in US$ PPP) |
GDP
(in Bil. US$nominal) |
GDP per capita
(in US$ nominal) |
GDP growth
(real) |
Inflation rate
(in Per cent) |
Unemployment
(in Per cent) |
Government debt
(in % of GDP) |
|---|---|---|---|---|---|---|---|---|
| 1992 | 1,602.6 | 10,805.2 | 71.6 | 482.8 | n/a | n/a | 5.2% | n/a |
| 1993 | n/a | |||||||
| 1994 | n/a | |||||||
| 1995 | n/a | |||||||
| 1996 | n/a | |||||||
| 1997 | 51.5% | |||||||
| 1998 | ||||||||
| 1999 | ||||||||
| 2000 | ||||||||
| 2001 | ||||||||
| 2002 | ||||||||
| 2003 | ||||||||
| 2004 | ||||||||
| 2005 | ||||||||
| 2006 | ||||||||
| 2007 | ||||||||
| 2008 | ||||||||
| 2009 | ||||||||
| 2010 | ||||||||
| 2011 | ||||||||
| 2012 | ||||||||
| 2013 | ||||||||
| 2014 | ||||||||
| 2015 | ||||||||
| 2016 | ||||||||
| 2017 | ||||||||
| 2018 | ||||||||
| 2019 | ||||||||
| 2020 | ||||||||
| 2021 | ||||||||
| 2022 |
Income inequality
In Russia, areas where income is higher have increased air pollution. However while income may have been higher in these regions a greater disparity in income inequality was found. It was discovered that "greater income inequality within a region is associated with more pollution, implying that it is not only the level of income that matters but also its distribution".[146] In Russia areas lacking in hospital beds suffer from greater air pollution than areas with higher numbers of beds per capita which implies that the poor or inadequate distribution of public services also may add to the environmental inequality of that region.[146]
Currency and monetary policy
The currency of the Russian Federation is the Russian ruble.
The currency exchange rate is floating. The Central Bank of the Russian Federation follows inflation targeting policy. Higher inflation than in developed countries has remained throughout the last 25-30 post-Soviet years and the devaluation of the currency (in relation to foreign currencies and in relation to domestic goods) is significantly compensated by higher interest rates and an increase in nominal incomes and assets. This situation is typical for developing markets. Typically devaluations of the ruble relative to foreign currency strongly stimulate the export-oriented economy of Russia.
Ruble's Real Effective Exchange Rate remains in 2022-23 higher than in 1996 and 1998[147] when the sharp devaluations happened relative to the foreign currency.
Public policy
Federal, regional and municipal budgets
Fiscal policy
Russia was expected to have a Government Budget deficit of $21 billion in 2016.[148] The budget deficit narrowed to 0.6% of GDP in 2017 from 2.8% in 2016.[149]
Debts
Russia is a creditor nation and has a positive net international investment position (NIMP). Russia has one of the lowest government debts (total external and domestic) and lowest external debts (total public and private) among major economies.[150][151][152][153]
In 2022, domestic government debt increased by 13.9 percent to 18.78 billion rubles.[154][155] Russia Domestic government Debt data was reported at 19,801.921 RUB bn in May 2023.[156]
In 2022, the share of external debt to GDP was 17%, decreasing from 26.3% in 2021.[152][157] Russia's external debt was estimated at 381.8 billion U.S. dollars as of January 1, 2023, down 20.8 percent from the previous year.[158] Russia External Debt reached 357.9 USD billion in March 2023, compared with 380.5 USD billion in the previous quarter.[159]
National wealth fund
On 1 January 2004, the Government of Russia established the Stabilization fund of the Russian Federation as part of the federal budget to balance it if price of oil falls. On 1 February 2008 the Stabilization fund was divided into two parts. The first is a reserve fund equal to 10% of GDP and was to be invested in a similar way as the Stabilization Fund. The second is the National Welfare Fund of the Russian Federation to be invested in more risky instruments, including some shares in domestic and foreign companies. The Reserve fund which started with $125 billion was exhausted by 2017 and discontinued. The National Wealth Fund started with $32 billion in 2008 and by December 2022 was $148 billion.[160]
Russia has one of the lowest foreign debts among major economies.[161]
Corruption
.png.webp)
Russia was the lowest rated European country in Transparency International's Corruption Perceptions Index for 2020; ranking 129th out of 180 countries.[162] Corruption is perceived as a significant problem in Russia,[163] impacting various aspects of life, including the economy,[164] business,[165] public administration,[166][167] law enforcement,[168] healthcare,[169] and education.[170] The phenomenon of corruption is strongly established in the historical model of public governance in Russia and attributed to general weakness of rule of law in Russia.[171] As of 2020, the percentage of business owners who distrust law enforcement agencies rose to 70% (from 45% in 2017); 75% don't believe in impartiality of courts and 79% do not believe that legal institutions protect them from abuse of law such as racketeering or arrest on dubious grounds.[172]
Sectors
Energy

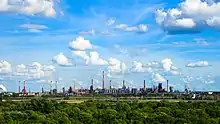
The mineral-packed Ural Mountains and the vast fossil fuel (oil, gas, coal), and timber reserves of Siberia and the Russian Far East make Russia rich in natural resources, which dominate Russian exports. Oil and gas exports, specifically, continue to be the main source of hard currency.
Russia has been widely described as an energy superpower;[32] as it has the world's largest natural gas reserves,[33] the second-largest coal reserves,[34] the eighth-largest oil reserves,[35] and the largest oil shale reserves in Europe.[36] It is the world's leading natural gas exporter,[37] the second-largest natural gas producer,[38] and the second-largest oil exporter,[39] and producer.[40] Fossil fuels cause most of the greenhouse gas emissions by Russia.[173] The country is the world's fourth-largest electricity producer,[174] and the ninth-largest renewable energy producer in 2019.[175] Russia was also the world's first country to develop civilian nuclear power, and to construct the world's first nuclear power plant.[176] In 2019, It was the world's fourth-largest nuclear energy producer.[177]
In the mid-2000s, the share of the oil and gas sector in GDP was around 20%, and in 2013 it was 20–21% of GDP.[178] The share of oil and gas in Russia's exports (about 50%) and federal budget revenues (about 50%) is large, and the dynamics of Russia's GDP are highly dependent on oil and gas prices,[179] but the share in GDP is much less than 50%. According to the first such comprehensive assessment published by the Russian statistics agency Rosstat in 2021, the maximum total share of the oil and gas sector in Russia's GDP, including extraction, refining, transport, sale of oil and gas, all goods and services used, and all supporting activities, amounts to 16.9% in 2017, 21.1% in 2018, 19.2% in 2019 and 15.2% in 2020. This is more than the share of GDP in the United States (8%) and Canada (less 10%). This is comparable to the share of GDP in Norway (14%) and Kazakhstan (13.3%). It is much lower than the share of GDP in the United Arab Emirates (30%) and Saudi Arabia (50%). This assessment did not include, for example, the production of used pumps or specialized education, which should have been included, according to experts.[180][181][182][183][184] Russia consumes domestically two-thirds of its gas production and a quarter of its oil production while it sells three-quarters of its oil on the world market and Russia's share of the traded world oil market is 17.5% - more than Saudi Arabia's.[185][186] At the same time, experts note that there are formal and informal part of the rent and the total oil and gas rent in 2023 can be estimated at about 24% of Russia's GDP. Michael Alexeyev, a professor of economics at Indiana University, notes that the oil and gas taxes reported by the government do not include corporate dividends and the so-called indirect or additional revenues derived from the expenditure of oil and gas rents in the economy.[187]
Mining
Russia is also a leading producer and exporter of minerals and gold. Russia is the largest diamond-producing nation in the world, estimated to produce over 33 million carats in 2013, or 25% of global output valued at over $3.4 billion, with state-owned ALROSA accounting for approximately 95% of all Russian production.[188]
In 2019, the country was the 3rd world producer of gold;[189] 2nd worldwide producer of platinum;[190] 4th worldwide producer of silver;[191] 9th largest world producer of copper;[192] 3rd largest world producer of nickel;[193] 6th largest world producer of lead;[194] 9th largest world producer of bauxite;[195] 10th largest world producer of zinc;[196] 2nd worldwide producer of vanadium;[197] 2nd largest world producer of cobalt;[198] 5th largest world producer of iron ore;[199] 7th largest world producer of boron;[200] 9th largest world producer of molybdenum;[201] 13th largest world producer of tin;[202] 3rd largest world producer of sulfur;[203] 4th largest world producer of phosphate;[204] 8th largest world producer of gypsum;[205] in addition to being the world's 10th largest producer of salt.[206] It was the world's 6th largest producer of uranium in 2018.[207]
Agriculture

Russia's agriculture sector contributes about 5% of the country's total GDP, although the sector employs about one-eighth of the total labour force.[208] It has the world's third-largest cultivated area, at 1,265,267 square kilometres (488,522 sq mi). However, due to the harshness of its environment, about 13.1% of its land is agricultural,[1] and only 7.4% of its land is arable.[209] The main product of Russian farming has always been grain, which occupies considerably more than half of the cropland.[208] Russia is the world's largest exporter of wheat,[210] and is the largest producer of barley,[211] buckwheat, oats,[212] and rye,[213] and the second-largest producer of sunflower seed.[214] Various analysts of climate change adaptation foresee large opportunities for Russian agriculture during the rest of the 21st century as arability increases in Siberia, which would lead to both internal and external migration to the region.[215]
More than one-third of the sown area is devoted to fodder crops, and the remaining farmland is devoted to industrial crops, vegetables, and fruits.[208] Owing to its large coastline along three oceans, Russia maintains one of the world's largest fishing fleets, ranking sixth in the world in tonnage of fish caught; capturing 4,773,413 tons of fish in 2018.[216] It is also home to the world's finest caviar (the beluga), and produces about one-third of all canned fish, and some one-fourth of the world's total fresh and frozen fish.[208]
Industry
Defence industry

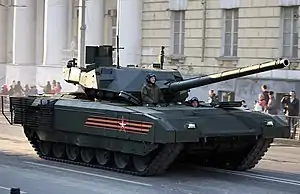
The defence industry of Russia is a strategically important sector and a large employer in the country. Russia has a large and sophisticated arms industry, capable of designing and manufacturing high-tech military equipment, including a fifth-generation fighter jet, nuclear powered submarines, firearms, and short range/long range ballistic missiles. It is the world's second-largest exporter of arms, behind only the United States.[1]
Aerospace

Aircraft manufacturing is an important industry sector in Russia, employing around 355,300 people. The Russian aircraft industry offers a portfolio of internationally competitive military aircraft such as MiG-29 and Su-30, while new projects such as the Sukhoi Superjet 100 are hoped to revive the fortunes of the civilian aircraft segment. In 2009, companies belonging to the United Aircraft Corporation delivered 95 new fixed-wing aircraft to its customers, including 15 civilian models. In addition, the industry produced over 141 helicopters. It is one of the most science-intensive hi-tech sectors and employs the largest number of skilled personnel. The production and value of the military aircraft branch far outstrips other defence industry sectors, and aircraft products make up more than half of the country's arms exports.[217]
The Space industry of Russia consists of over 100 companies and employs 250,000 people.[218]
Automotive industry

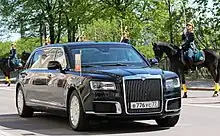
Automotive production is a significant industry in Russia, directly employing around 600,000 people or 1% of the country's total workforce. Russia produced 1,767,674 vehicles in 2018, ranking 13th among car-producing nations in 2018, and accounting for 1.8% of the worldwide production.[219] Following the 2022 sanctions and the withdrawal of Western manufacturers the production dropped to 450,000 passenger cars in 2022, the lowest level since the dissolution of the Soviet Union in 1991.[220] The main local brands are light vehicle producers AvtoVAZ and GAZ, while KamAZ is the leading heavy vehicle producer. In December 2022 the only foreign car manufacturers are eleven Chinese carmakers that have production operations or are constructing their plants in Russia.[221]
Electronics
Russia was experiencing a regrowth of microelectronics, with the revival of JCS Mikron until sanctions took effect in 2022.[222][223][224]
Retail
As of 2013, Russians spent 60% of their pre-tax income on shopping, the highest percentage in Europe. This is possible because many Russians pay no rent or house payments, owning their own home after privatization of state-owned Soviet housing. Shopping malls were popular with international investors and shoppers from the emerging middle class. Russia had over 1,000 shopping malls in 2020, although in 2022 many international companies left Russia resulting in empty stores in malls.[225] A supermarket selling groceries is a typical anchor store in a Russian mall.[226]
Retail sales in Russia[227]
| Year | 2009 | 2010 | 2011 | 2012 | 2013 | 2014 | 2015 | 2016 | 2017 | 2018 | 2019 | 2020 | 2021 | 2022 |
|---|---|---|---|---|---|---|---|---|---|---|---|---|---|---|
| Total retail sales (RUB trillions) | 14.60 | 16.49 | 19.08 | 21.3 | 23.7 | 26.4 | 27.6 | 29.75 | 27.88 | 31.58 | 33.62 | 33.56 | 39.47 | 42.51 |
Telecommunications
Russia's telecommunications industry is growing in size and maturity. As of December 2007, there were an estimated 4,900,000 broadband lines in Russia.[228]
As of 2020, 122,488,468 Russians (85% of the country's total population) were Internet users.[229]
There are four national mobile phone networks, MegaFon, Tele2, Beeline and MTS with total subscriptions between 2011 to 2021 ranging between 200 and 240 million.[230]
Transportation

Railway transport in Russia is mostly under the control of the state-run Russian Railways.[231] The total length of common-used railway tracks is the world's third-longest, and exceeds 87,157 km (54,157 mi).[232] As of 2016, Russia has 1,452.2 thousand km of roads,[233] and its road density is among the world's lowest.[234] Russia's inland waterways are the world's second-longest, and total 102,000 km (63,380 mi).[235] Among Russia's 1,218 airports,[236] the busiest is Sheremetyevo International Airport in Moscow.[237]
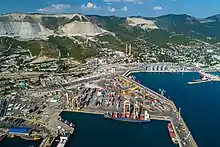
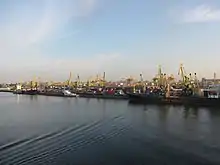
Russia's largest port is the Port of Novorossiysk in Krasnodar Krai along the Black Sea.[238] Russia is the world's sole country to operate nuclear-powered icebreakers, which advance the economic exploitation of the Arctic continental shelf of Russia, and the development of sea trade through the Northern Sea Route.[239]
Construction
In 2022 construction was worth 13 trillion rubles, 5% more than in 2021. Residential construction in 2022 reached 126.7 million square metres.[240]
The 2020-2030 target for construction is 1 billion m2 of housing, 20% of all housing stock to be renovated and to increase space from 27.8 m2 up to 33.3 m2 per person.[240]
Insurance
According to the Central Bank of Russia 422 insurance companies operate on the Russian insurance market by the end of 2013. The concentration of insurance business is significant across all major segments except compulsory motor third party liability market (CMTPL), as the top 10 companies in 2013 charged 58.1% premiums in total without compulsory health insurance (CHI).[241] Russian insurance market in 2013 demonstrated quite significant rate of growth in operations. Total amount of premiums charged (without CHI) in 2013 is RUB 904.9 bln (increase on 11.8% compared to 2012), total amount of claims paid is RUB 420.8 bln (increase on 13.9% compared to 2012). Premiums to GDP ratio (total without CHI) in 2013 increased to 1.36% compared to 1.31 a year before. The share of premiums in household spending increased to 1.39%. Level of claims paid on the market total without CHI is 46.5%, an insufficient increase compared to 2012. The number of policies in 2013 increased on 0.1% compared to 2012, to 139.6 mln policies.
Although relative indicators of the Russian insurance market returned to pre-crisis levels, the progress is achieved mainly by the increase of life insurance and accident insurance, the input of these two market segments in premium growth in 2013 largely exceeds their share on the market. As before, life insurance and accident insurance are often used by banks as an appendix to a credit contract protecting creditors from the risk of credit default in case of borrower's death or disability. The rise of these lines is connected, evidently, with the increase in consumer loans, as the total sum of credit obligations of population in 2013 increased by 28% to RUB 9.9 trillion. At the same time premium to GDP ratio net of life and accident insurance remained at the same level of 1.1% as in 2012. Thus, if "banking" lines of business are excluded, Russian insurance market is in stagnation stage for the last four years, as premiums to GDP ratio net of life and accident insurance remains at the same level of 1.1% since 2010.[242]
Information technology
The IT market is one of the most dynamic sectors of the Russian economy. Russian software exports have risen from just $120 million in 2000 to $3.3 billion in 2010.[244] Since the year 2000 the IT market has started growth rates of 30–40% a year, growing by 54% in 2006 alone. The biggest sector in terms of revenue is system and network integration, which accounts for 28.3% of the total market revenues.[245] Meanwhile, the fastest growing segment of the IT market is offshore programming.
The government has launched a program promoting construction of IT-oriented technology parks (Technoparks)—special zones that have an established infrastructure and enjoy a favorable tax and customs regime, in seven different places around the country: Moscow, Novosibirsk, Nizhny Novgorod, Kaluga, Tumen, Republic of Tatarstan and St. Peterburg Regions.[244]
Under a government decree signed in June 2013, a special "roadmap" is expected to ease business suppliers’ access to the procurement programs of state-owned infrastructure monopolies, including such large ones as Gazprom, Rosneft, Russian Railways, Rosatom, and Transneft. These companies will be expected to increase the proportion of domestic technology solutions they use in their operations. The decree puts special emphasis on purchases of innovation products and technologies. According to the new decree, by 2015, government-connected companies must double their purchases of Russian technology solutions compared to the 2013 level and their purchasing levels must quadruple by 2018.[246]
Russia is one of the few countries in the world with a home grown internet search engine who owns a relevant marketshare as the Russian-based search engine Yandex is used by 53.8% of internet users in the country.[247][248][249]
Known Russian IT companies are ABBYY (FineReader OCR system and Lingvo dictionaries), Kaspersky Lab (Kaspersky Anti-Virus, Kaspersky Internet Security), Mail.Ru (portal, search engine, mail service, Mail.ru Agent messenger, ICQ, Odnoklassniki social network, online media sources).
Tourism

According to a UNWTO report, Russia is the sixteenth-most visited country in the world, and the tenth-most visited country in Europe, as of 2018, with 24.6 million visits.[250] Russia is ranked 39th in the Travel and Tourism Competitiveness Report 2019.[251] According to Federal Agency for Tourism, the number of inbound trips of foreign citizens to Russia amounted to 24.4 million in 2019.[252] Russia's international tourism receipts in 2018 amounted to $11.6 billion.[250] In 2020, tourism accounted for about 4% of country's GDP.[253] Major tourist routes in Russia include a journey around the Golden Ring theme route of ancient cities, cruises on the big rivers like the Volga, and journeys on the famous Trans-Siberian Railway.[254] Russia's most visited and popular landmarks include Red Square, the Peterhof Palace, the Kazan Kremlin, the Trinity Lavra of St. Sergius and Lake Baikal.[255]
Economic integration
Russia joined the World Trade Organization (WTO) on 22 August 2012.[92] On September 20, 2012 the Free Trade Agreement of the Commonwealth of Independent States signed on October 18, 2011 came into force (CIS FTA) for Russia and superseded previous agreements.[95] Russia is a founding member of the Eurasian Economic Union (EAEU) and is party to EAEU trade agreements with Vietnam, Iran, Singapore, and Serbia. In 2018, the EAEU signed a trade cooperation agreement with China, and it is in trade negotiations with India, Israel, and Egypt. Russia is also a party to several agreements that predate the EAEU.[256] The EAEU Treaty in 2015 superseded previous integration agreements and envisaged an economic union (the deepest stage of economic integration[96]). The EAEU provides for free movement of goods, services, capital and labour without a work permit ("four economic freedoms" as in the European Union), pursues coordinated, harmonized and single policy in the sectors determined by the Treaty and international agreements within the Union. The EAEU has an Eurasian Customs Union and an integrated single market of 183 million people.[97]
External trade and investment
.jpg.webp)
Trade
Russia recorded a trade surplus of US$15.8 billion in 2013.[257] Balance of trade in Russia is reported by the Central Bank of Russia. Historically, from 1997 until 2013, Russia balance of trade averaged US$8.338billion reaching an all-time high of US$20.647 billion in December 2011 and a record low of −185 US$ million in February 1998. Russia runs regular trade surpluses primarily due to exports of commodities.
In 2015, Russia main exports are oil and natural gas (62.8% of total exports), ores and metals (5.9%), chemical products (5.8%), machinery and transport equipment (5.4%) and food (4.7%). Others include: agricultural raw materials (2.2%) and textiles (0.2%).[258]
Russia top exports in 2021 were: Crude oil $110.9b, Processed oil $69.9b, gold $17.3b, coal $15.4b and natural gat $7.3b.[259]
Russia top imports in 2021 were: Transmission equipment $10.7b, medication $7.3b, tankers $3.7b, parts and accessories for data processing 3.7b and storage units $3.3b.[259]
Foreign trade of Russia – Russian export and import[259]
| Year | 2005 | 2006 | 2007 | 2008 | 2009 | 2010 | 2011 | 2012 | 2013 | 2014 | 2015 | 2016 | 2017 | 2018 | 2019 | 2020 | 2021 |
|---|---|---|---|---|---|---|---|---|---|---|---|---|---|---|---|---|---|
| Export (US$ Billions) | 241 | 302 | 352 | 468 | 302 | 397 | 517 | 525 | 527 | 498 | 344 | 302 | 379 | 451 | 427 | 337 | 492 |
| Import (US$ Billions) | 99 | 138 | 200 | 267 | 171 | 229 | 306 | 316 | 315 | 287 | 183 | 207 | 260 | 240 | 247 | 231 | 293 |
| Top Trading Partners for Russia for 2021[259] | |||||||||||||||||||||||||||||||||||||||||||||||||||||||||||||||||||||||||||||||||||||||||||||||||||||||||||
|---|---|---|---|---|---|---|---|---|---|---|---|---|---|---|---|---|---|---|---|---|---|---|---|---|---|---|---|---|---|---|---|---|---|---|---|---|---|---|---|---|---|---|---|---|---|---|---|---|---|---|---|---|---|---|---|---|---|---|---|---|---|---|---|---|---|---|---|---|---|---|---|---|---|---|---|---|---|---|---|---|---|---|---|---|---|---|---|---|---|---|---|---|---|---|---|---|---|---|---|---|---|---|---|---|---|---|---|
|
| ||||||||||||||||||||||||||||||||||||||||||||||||||||||||||||||||||||||||||||||||||||||||||||||||||||||||||
2013–

In 2017, Russian Federation's commercial services' shares of total exports and imports were 13.9% and 26.8%, respectively. Russian Federation had a trade-to-GDP ratio of 46.6% in 2017.[260] In 2013–2017, Russia had a trade surplus for goods, and a trade deficit for services. Since trade in goods is larger than trade in services, Russia had a significant trade surplus.[261] Trade is relatively important to the Russian economy: the ratio of Russia’s goods trade (exports plus imports) to GDP has averaged about 40% in recent years, compared to 20% for the United States. In 2021, Russia ranked 13th among world goods exporters and 22nd among importers. According to Russian official sources, its goods exports totaled $492 billion in 2021, up 46% from 2020 (not adjusting for inflation). Minerals, including oil and gas, accounted for almost 45% of these exports. Goods imports increased 27% to $294 billion in 2021. Machinery and mechanical appliances was the top import category, accounting for almost a third of Russia’s goods imports. In services trade, Russia ranked 26th among world exporters and 19th among importers in 2020, the most recent year for which there is data. It was a net services importer, exporting $49 billion worth of services and importing $76 billion.[256]
According to the World Bank, imports of goods and services occupied 21.3% of the Russian gross domestic product (GDP) in 2021 [262] and exports of goods and services occupied 30.9% of Russia's GDP.[263] Russia has trade-to-GDP ratio (trade openness) 49.26% [264] which is lower than an average of the countries. In December 2022 in a study an economist at the Bank of Russia’s Research and Forecasting Department, finds that the import dependence of the Russian economy is relatively low, does not exceed the median for other countries and the share of imports in most industries is lower than in other countries. The key explanation for this could be the low involvement of the Russian economy in global value supply chains and its focus on production of raw materials. However, 60% of Russia’s imports come from the countries that have announced sanctions against Russia.[137]
Mergers and acquisitions
Between 1985 and 2018 almost 28,500 mergers or acquisitions have been announced in Russia. This cumulates to an overall value of around 984 bil. USD which translates to 5.456 bil. RUB. In terms of value, 2007 has been the most active year with 158 bil. USD, whereas the number of deals peaked in 2010 with 3,684 (964 compared to the value record year 2007). Since 2010 value and numbers have decreased constantly and another wave of M&A is expected.[265]
The majority of deals in, into or out of Russia have taken place in the financial sector (29%), followed by banks (8.6%), oil and gas (7.8%) and Metals and Mining (7.2%).
Here is a list of the top deals with Russian companies participating ranked by deal value in mil. USD:
| Date Announced | Acquiror Name | Acquiror Mid Industry | Acquiror Nation | Target Name | Target Mid Industry | Target Nation | Value of Transaction ($mil) |
|---|---|---|---|---|---|---|---|
| 10/22/2012 | Rosneft Oil Co | Oil & Gas | Russian Fed | TNK-BP Ltd | Oil & Gas | Russian Fed | 27854.12 |
| 07/24/2012 | Rosneft Oil Co | Oil & Gas | Russian Fed | TNK-BP Ltd | Oil & Gas | Russian Fed | 26061.15 |
| 04/22/2003 | Yukosneftegaz | Oil & Gas | Russian Fed | Sibirskaia Neftianaia Co | Oil & Gas | Russian Fed | 13615.23 |
| 09/28/2005 | Gazprom | Oil & Gas | Russian Fed | Sibneft | Oil & Gas | Russian Fed | 13101.08 |
| 04/13/2005 | Shareholders | Other Financials | Russian Fed | Polyus | Metals & Mining | Russian Fed | 12867.39 |
| 12/16/2010 | MMC Norilsk Nickel PJSC | Metals & Mining | Russian Fed | MMC Norilsk Nickel PJSC | Metals & Mining | Russian Fed | 12800 |
| 07/27/2007 | Shareholders | Other Financials | Russian Fed | HydroOGK | Power | Russian Fed | 12381.83 |
| 12/10/2016 | QHG Shares Pte Ltd | Other Financials | Singapore | Rosneft Oil Co | Oil & Gas | Russian Fed | |
| 06/30/2010 | KazakhGold Group Ltd | Metals & Mining | Kazakhstan | Polyus Zoloto | Metals & Mining | Russian Fed | 10261.33 |
| 08/05/2008 | Vladimir Potanin | Other Financials | Russian Fed | MMC Norilsk Nickel PJSC | Metals & Mining | Russian Fed | 10021.11 |
The majority of the top 10 deals are within the Russian Oil and Gas sector, followed by Metals and Mining.
See also
- History of Russia (1991–present)
- List of companies of Russia
- List of Russian federal districts by GDP
- Monotown, a town whose economy is dominated by a single industry or company. The term is sometimes used regarding some towns in Russia
- Politics of Russia
- Taxation in Russia
- Types of legal entities in Russia
- Unitary enterprise, a government-owned corporation in Russia and some other post-Soviet states
- List of federal subjects of Russia by GDP per capita
References
- "Russia". CIA.gov. Central Intelligence Agency. Retrieved 30 May 2023.
- "World Economic Outlook Database, April 2019". IMF.org. International Monetary Fund. Retrieved 29 September 2019.
- "World Bank Country and Lending Groups". datahelpdesk.worldbank.org. World Bank. Retrieved 29 September 2019.
- Including 2,482,450 people living in annexed Crimea Том 1. Численность и размещение населения. Russian Federal State Statistics Service (in Russian). Archived from the original on 24 January 2020. Retrieved 3 September 2022.
- "World Economic Outlook database: October 2023". IMF.org. International Monetary Fund. Retrieved 11 April 2023.
- "Central Intelligence Agency". Cia.gov. Retrieved 5 April 2015.
- https://www.cbr.ru/eng/
- "Poverty headcount ratio at national poverty lines (% of population) – Russian Federation". data.worldbank.org. World Bank. Retrieved 21 March 2020.
- "Poverty and Inequality Platform". World Bank. Retrieved 17 May 2022.
- "Gini index (World Bank estimate) – Russian Federation". data.worldbank.org. World Bank. Retrieved 28 October 2020.
- "Human Development Index (HDI)". hdr.undp.org. HDRO (Human Development Report Office) United Nations Development Programme. Retrieved 12 November 2022.
- "Inequality-adjusted HDI (IHDI)". hdr.undp.org. UNDP. Retrieved 12 November 2022.
- "Labor force, total – Russia". World Bank & ILO. Retrieved 22 September 2020.
- "Employment to population ratio, 15+, total (%) (national estimate) – Russia". World Bank. Retrieved 29 September 2019.
- "Russia: Unemployment rate from November 2020 to November 2022". Statista. 28 December 2022. Retrieved 30 December 2022.
- "Russian Total Imports and Exports Data (2010–2021)". www.trendeconomy.com. 14 November 2022.
- "Export Partners of Russia". The Observatory of Economic Complexity. Retrieved 5 April 2023.
- "Import Partners of Russia". The Observatory of Economic Complexity. Retrieved 5 April 2023.
- "UNCTAD 2022" (PDF). UNCTAD. Retrieved 6 January 2022.
- "Report for Selected Countries and Subjects: October 2022". imf.org. International Monetary Fund.
- "External Debt | Economic Indicators | CEIC". www.ceicdata.com.
- Korsunskaya, Darya; Marrow, Alexander (17 February 2023). "Russia stands by 2% of GDP budget deficit plan after huge Jan shortfall". Reuters.
- "Sovereigns rating list". Standardandpoors.com. Standard & Poor's. Retrieved 19 March 2015.
- "Russia on Cusp of Exiting Junk as S&P Outlook Goes Positive". Bloomberg.com. Bloomberg L.P. 17 March 2017.
- "Moody's changes outlook on Russia's Ba1 government bond rating to stable from negative". Moody's. 17 February 2017.
- "Russia's Outlook Raised to Stable by Fitch on Policy Action". Bloomberg. 14 October 2016.
- "International Reserves of the Russian Federation (End of period)". Central Bank of Russia. Retrieved 13 January 2023.
-
—Rosefielde, Steven, and Natalia Vennikova. “Fiscal Federalism in Russia: A Critique of the OECD Proposals.” Cambridge Journal of Economics, vol. 28, no. 2, Oxford University Press, 2004, pp. 307–18, JSTOR 23602130.
—Robinson, Neil. “August 1998 and the Development of Russia’s Post-Communist Political Economy.” Review of International Political Economy, vol. 16, no. 3, Taylor & Francis, Ltd., 2009, pp. 433–55, JSTOR 27756169.
—Charap, Samuel. “No Obituaries Yet for Capitalism in Russia.” Current History, vol. 108, no. 720, University of California Press, 2009, pp. 333–38, JSTOR 45319724.
—Rutland, Peter. “Neoliberalism and the Russian Transition.” Review of International Political Economy, vol. 20, no. 2, Taylor & Francis, Ltd., 2013, pp. 332–62, JSTOR 42003296.
—Kovalev, Alexandre, and Alexandre Sokalev. “Russia: Towards a Market Economy.” New Zealand International Review, vol. 18, no. 1, New Zealand Institute of International Affairs, 1993, pp. 18–21, JSTOR 45234200.
—Czinkota, Michael R. “Russia’s Transition to a Market Economy: Learning about Business.” Journal of International Marketing, vol. 5, no. 4, American Marketing Association, 1997, pp. 73–93, JSTOR 25048706. - Excerpted from Curtis, Glenn E., ed. (1998). "Russia – Natural Resources". Federal Research Division of the Library of Congress. Retrieved 25 June 2021.
Russia is one of the world's richest countries in raw materials, many of which are significant inputs for an industrial economy. Russia accounts for around 20 per cent of the world's production of oil and natural gas and possesses large reserves of both fuels. This abundance has made Russia virtually self-sufficient in energy and a large-scale exporter of fuels.
- Turak, Natasha (23 June 2022). "Russia's ruble hit its strongest level in 7 years despite massive sanctions. Here's why". CNBC.
- Bruno S. Sergi, ed. (23 May 2019). Modeling Economic Growth in Contemporary Russia. Emerald Group Publishing. pp. 99–. ISBN 978-1-78973-265-8. OCLC 1101173631.
- "The Future of Russia as an Energy Superpower". Harvard University Press. 20 November 2017. Retrieved 22 February 2021.
- N. Sönnichsen (15 June 2021). "Natural gas – countries with the largest reserves 2009–2019". Statista. Retrieved 2 July 2021.
Russia has the largest proved natural gas reserves in the world. As of 2019, it had 38 trillion cubic meters worth of the fossil fuel, four trillion cubic meters more than ten years prior.
- "Statistical Review of World Energy 69th edition" (PDF). bp.com. BP. 2020. p. 45. Retrieved 8 November 2020.
- "Crude oil – proved reserves". CIA World Factbook. Central Intelligence Agency. Archived from the original on 26 March 2023. Retrieved 2 July 2021.
- 2010 Survey of Energy Resources (PDF). World Energy Council. 2010. p. 102. ISBN 978-0-946121-021. Retrieved 8 November 2020.
- "Natural gas – exports". CIA World Factbook. Central Intelligence Agency. Archived from the original on 5 April 2022. Retrieved 2 July 2021.
- "Natural gas – production". CIA World Factbook. Central Intelligence Agency. Archived from the original on 26 March 2023. Retrieved 2 July 2021.
- "Crude oil – exports". CIA World Factbook. Central Intelligence Agency. Archived from the original on 26 March 2023. Retrieved 2 July 2021.
- "Crude oil – production". CIA World Factbook. Central Intelligence Agency. Archived from the original on 26 March 2023. Retrieved 2 July 2021.
- "International Reserves of the Russian Federation (End of period)". Central Bank of Russia. Retrieved 21 June 2021.
- "Labor force – The World Factbook". Central Intelligence Agency. Retrieved 16 June 2021.
- "SIPRI Arms Transfers Database". sipri.org. Retrieved 14 June 2022.
- Davydova, Angelina (24 November 2021). "Will Russia ever leave fossil fuels behind?". BBC. Retrieved 3 March 2022.
Overall in Russia, oil and gas provided 39% of the federal budget revenue and made up 60% of Russian exports in 2019.
- "Forbes Billionaires 2021". Forbes. Retrieved 13 April 2021.
- Russell, Martin (April 2018). "Socioeconomic inequality in Russia" (PDF). European Parliamentary Research Service. European Parliament. Retrieved 25 January 2022.
- Walsh, Ben (9 March 2022). "The unprecedented American sanctions on Russia, explained". Vox. Retrieved 31 March 2022.
- "The Ukraine war, sanctions, and the resilient Russian economy | ORF".
- "How Russia Is Surviving Western Sanctions | Wilson Center". www.wilsoncenter.org.
- "Russian ruble: How resilient against sanctions is Russia's economy?". World Economic Forum. 18 July 2022.
- "Why Russia's economy is more resilient than you might think". 30 June 2022.
- Richard Connolly, The Russian economy: a very short introduction (2020) pp 2–11.
- Davies 1998, p. 1, 3.
- Appel, Hilary; Orenstein, Mitchell A. (2018). From Triumph to Crisis: Neoliberal Economic Reform in Postcommunist Countries. Cambridge University Press. p. 3. ISBN 978-1108435055.
- "Nuffield Poultry Study Group — Visit to Russia 6th–14th October 2006" (PDF). The BEMB Research and Education Trust. 2007. Archived from the original (PDF) on 7 August 2007. Retrieved 27 December 2007.
- "How Harvard lost Russia". Institutional Investor. 27 February 2006. Archived from the original on 17 July 2014. Retrieved 24 July 2014.
- Mattei, Clara E. (2022). The Capital Order: How Economists Invented Austerity and Paved the Way to Fascism. University of Chicago Press. p. 302. ISBN 978-0226818399.
- "GDP growth (annual %)". World Bank. Retrieved 26 July 2014.
- "Members". APEC Study Center; City University of Hong Kong. Archived from the original on 10 August 2007. Retrieved 27 December 2007.
- Weber, Isabella (2021). How China escaped shock therapy : the market reform debate. Abingdon, Oxon: Routledge. p. 5. ISBN 978-0-429-49012-5. OCLC 1228187814.
- Scheidel, Walter (2017). The Great Leveler: Violence and the History of Inequality from the Stone Age to the Twenty-First Century. Princeton University Press. p. 222. ISBN 978-0691165028.
- Privatisation 'raised death rate'. BBC, 15 January 2009. Retrieved 24 November 2018.
- Rosefielde, Steven (2001). "Premature Deaths: Russia's Radical Economic Transition in Soviet Perspective". Europe-Asia Studies. 53 (8): 1159–1176. doi:10.1080/09668130120093174. S2CID 145733112.
- Ghodsee, Kristen (2017). Red Hangover: Legacies of Twentieth-Century Communism. Duke University Press. pp. 63–64. ISBN 978-0822369493.
- Weber, Isabella (2021). How China escaped shock therapy : the market reform debate. Abingdon, Oxon: Routledge. p. 2. ISBN 978-0-429-49012-5. OCLC 1228187814.
- "Поторебление мяса на душу населения в СССР, россии и развитьіх странах" (PDF). Archived from the original (PDF) on 17 December 2021.
- Nicholson, Alex. "Metal is the latest natural resource bonanza for Russia". International Herald Tribune. Archived from the original on 16 August 2007.
- Page, Jeremy (16 May 2005). "Analysis: punished for his political ambitions". The Times. UK. Retrieved 27 December 2007.
- "Russia: Clawing Its Way Back to Life (int'l edition)". BusinessWeek. 29 November 1999. Retrieved 27 December 2007.
- Ghodsee, Kristen; Orenstein, Mitchell A. (2021). Taking Stock of Shock: Social Consequences of the 1989 Revolutions. Oxford University Press. p. 31. doi:10.1093/oso/9780197549230.001.0001. ISBN 978-0197549247.
- 23 September 1999 (23 September 1999). "Business: The Economy Russia: The IMF's biggest failure". BBC. Retrieved 10 May 2015.
- "Facts About IMF Lending to Russia". International Monetary Fund. 13 September 1999. Retrieved 10 May 2015.
- An Assessment of Putin's Economic Policy Archived 22 March 2016 at the Wayback Machine, by Anders Aslund, Peterson Institute for International Economics, July 2008
- "Investing in Russia" (PDF). KPMG. April 2013. Retrieved 21 July 2014.
- РОЗНИЧНЫЙ ПОДХОД. Российские банки борются за частников (in Russian). Vtbmagazine.ru. Archived from the original on 19 June 2006. Retrieved 12 November 2011.
- "Ежегодно объем потребительского кредитования в России удваивается". Bank.samaratoday.ru. Archived from the original on 21 October 2011. Retrieved 12 November 2011.
- "Основные Социально-Экономические Индикаторы Уровня Жизни Населения". Gks.ru. Archived from the original on 15 July 2006. Retrieved 12 November 2011.
- "CIA – The World Factbook – Russia". Cia.gov. Retrieved 12 November 2011.
- "In Russia, a modern institution is quietly gaining ground". Emerging Markets. 26 November 2012. Archived from the original on 8 August 2014. Retrieved 27 July 2014.
- Russia attracts investors despite its image BBC News Retrieved in March 2008
- Jarko Fidrmuc; Philipp Johann Süß (September 2009). "The Outbreak of the Russian Banking Crisis" (PDF). University of Munich. Retrieved 26 July 2014.
- "Financial crisis: action taken by central banks and governments". The Guardian. 21 October 2008. Retrieved 26 July 2014.
- "Insight: No more easy pickings in Russia's banking market". Reuters. 22 May 2013. Retrieved 26 July 2014.
- ДИНАМИКА РЕАЛЬНЫХ ДОХОДОВ НАСЕЛЕНИЯ (in Russian). Rosstat. Archived from the original on 13 January 2021. Retrieved 21 July 2014.
- Guriev, Sergei; Tsyvinski, Aleh (2010). "Challenges Facing the Russian Economy after the Crisis". In Anders Åslund; Sergei Guriev; Andrew C. Kuchins (eds.). Russia After the Global Economic Crisis. Peterson Institute for International Economics; Centre for Strategic and International Studies; New Economic School. pp. 12–13. ISBN 9780881324976.
- Putin: Russia's Choice, (Routledge 2007), by Richard Sakwa, Chapter 9
- "Global Wealth Report 2013 – Pg. 53". Credit Suisse. Archived from the original on 14 February 2015. Retrieved 13 April 2015.
- "Russia's Wealth Inequality One Of Highest In The World". Huffington Post. 9 October 2013. Archived from the original on 9 October 2013. Retrieved 21 July 2014.
- "Illicit Financial Flows from Developing Countries: 2002–2011" (PDF). Global Financial Integrity. 2013. Retrieved 5 December 2014.
- Vorasarun, Chaniga (30 April 2008). "Cities Of The Billionaires". Forbes. Retrieved 21 August 2014.
Geromel, Ricardo (14 March 2013). "Forbes Top 10 Billionaire Cities – Moscow Beats New York Again". Forbes. Retrieved 21 August 2014. - "Russia becomes WTO member after 18 years of talks". BBC. 16 December 2011. Retrieved 26 January 2021.
- "WTO | Russian Federation - Member information".
- "Russia joins WTO after 19 years of talks | Financial Times". www.ft.com. Retrieved 15 August 2023.
- Elliott, Larry (22 August 2012). "Russia's entry to WTO ends 19 years of negotiations". The Guardian.
- "CIS Free Trade Agreement Comes into Force - U.S.-Ukraine Business Council (USUBC)".
- "Stages of Economic Integration: From Autarky to Economic Union".
- "Eurasian Economic Union". www.eaeunion.org.
- "New Country Classifications". 2 July 2013.
- "Country and Lending Groups". World Bank. Archived from the original on 2 July 2014. Retrieved 1 July 2013.
- "World Bank updates its country classification by GNI per capita".
- "New country classifications by income level: 2016-2017". July 2016.
- "World Bank Country and Lending Groups – World Bank Data Help Desk".
- https://www.europarl.europa.eu/RegData/etudes/BRIE/2022/729375/EPRS_BRI(2022)729375_EN.pdf
- "Russia HDI 2021".
- Kramer, Andrew E. (22 September 2011). "Economic Reforms Likely to Continue Under Putin". The New York Times. Retrieved 27 July 2014.
- "Russia – Analysis". EIA. 31 October 2017. Retrieved 17 February 2021.
- "On Bank of Russia key rate". Bank of Russia. 16 June 2014. Retrieved 26 July 2014.
- "EUROPA – EU Newsroom – EU sanctions against Russia over Ukraine crisis". europa.eu. Retrieved 22 June 2015.
- ВВП России в первом полугодии вырос на 1% — Минэкономразвития. Vedomosti (in Russian). 27 July 2014. Retrieved 7 August 2014.
- Anna Andrianova (2 April 2015). "Russian Economy Unexpectedly Expanded 0.4% in Fourth Quarter". Bloomberg.com. Retrieved 30 April 2015.
- "Unequal Russia: is anger stirring in the global capital of inequality?". The Guardian. 25 April 2017.
- Tim Bowler (19 January 2015). "Falling oil prices: Who are the winners and losers?". BBC News. Retrieved 30 April 2015.
- О состоянии внешней торговли в январе-феврале 2015 года [On the state of foreign trade in January–February 2015]. gks.ru (in Russian). Archived from the original on 27 April 2015. Retrieved 30 April 2015.
- Matlack, Carol (28 January 2016). "Russia's Great Downward Shift". Bloomberg.com. Bloomberg L.P. Retrieved 28 January 2016.
- "О производстве и использовании валового внутреннего продукта (ВВП) за 2017 год". www.gks.ru. Archived from the original on 12 June 2018. Retrieved 1 February 2018.
- "Russian Economy Crawled to Growth With Recession in Rearview". Bloomberg. 31 March 2017.
- These Are the World's Most Innovative Economies Bloomberg Business.
- Most Innovative: Countries Bloomberg Business.
- 30 Most Innovative Countries Bloomberg Business.
- "Statistical Review of World Energy". bp.com. Retrieved 11 May 2023.
- "Mineral Commodity Summaries | U.S. Geological Survey" (PDF). minerals.usgs.gov.
- "55 триллионов в запасе: как власти оценили все природные ресурсы России". 14 March 2019.
- "Russia's Natural Resources Make Up 60% of GDP". The Moscow Times. 14 March 2019. Retrieved 17 March 2019.
- "Russian Invasion to Shrink Ukraine Economy by 45 Percent This Year". World Bank. Retrieved 15 June 2022.
- "Secret Economy: What Hiding the Stats Does for Russia".
- "Germany open to Russian Central Bank asset seizure to finance Ukraine's recovery". Euractiv. 17 May 2022.
- Davidson, Kate; Weaver, Aubree Eliza (28 February 2022). "The West declares economic war on Russia". Politico. Archived from the original on 1 March 2022.
- Pop, Valentina (25 February 2022). "EU leaders agree more Russia sanctions, but save some for later". Financial Times. Archived from the original on 26 February 2022.
- "Cost of War: How much Russia spending each day on war with Ukraine?". Ground Report. 28 May 2022.
- "Ukraine war: Russia shells out $900 million a day over 'special military operation'". WION. 7 May 2022.
- "Moscow is having a hard time facing the costs of the Ukraine war". Israel Hayom. 22 August 2022.
- "Russia in debt default as payment deadline passes". BBC News. 25 June 2022. Retrieved 16 November 2022.
- "Russia falls into recession". Al Arabiya English. 16 November 2022. Retrieved 16 November 2022.
- "Russia's main oil product is trading way below the $60 price cap as just a handful of buyers keep up trade with the heavily sanctioned nation". Business Insider. 9 January 2023.
- "Western sanctions push Russia's energy revenues to lowest since 2020". Reuters. 3 February 2023.
- "Which countries have escaped the middle-income trap?". The Economist.
- "Russia's Import Dependence — ECONS.ONLINE". 26 January 2023.
- "Russian budget deficit expected to reach $29.42 bln in Q1 — Finance Ministry". 7 April 2023.
- ""The Most Powerful" Russian Currency and "Stable" Russian Economy: the Reality Behind the Propaganda". ukraineworld.org. Retrieved 18 August 2023.
- "Russian Cash Flood Turns to $5.4 Billion Trickle, Strains Ruble". 11 July 2023.
- "Russia raises interest rate to 13% as economy struggles". euronews. 15 September 2023. Retrieved 18 September 2023.
- "Russia's share in EU trade falls below 2% - Products Eurostat News - Eurostat". ec.europa.eu. Retrieved 6 October 2023.
- Marrow, Alexander (9 October 2023). "Russian rouble tumbles to over 18-month low vs dollar". Reuters. Retrieved 9 October 2023.
- "Russia's 2024 Budget Shows It's Planning for a Long War in Ukraine". 11 October 2023.
- "Report for Selected Countries and Subjects".
- Vornovytskyy, Marina S.; Boyce, James K. (1 January 2010). Economic Inequality and Environmental Quality: Evidence of Pollution Shifting in Russia. ScholarWorks@UMass Amherst. OCLC 698200672.
- https://www.ceicdata.com/en/indicator/russia/real-effective-exchange-rate
- "Russia's Budget Deficit to Reach $21Bln in 2016 – Finance Ministry". The Moscow Times. Archived from the original on 14 December 2015. Retrieved 30 May 2016.
- "Overview". World Bank. Retrieved 22 April 2018.
- "Russian finances strong but economic problems persist". TRT World. 29 May 2020. Retrieved 12 February 2022.
Now Russia is one of the least indebted countries in the world – thanks to all the oil revenue.
- https://www.ceicdata.com/en/indicator/russia/government-debt--of-nominal-gdp
- https://www.ceicdata.com/en/indicator/russia/external-debt--of-nominal-gdp
- https://data.worldbank.org/indicator/GC.DOD.TOTL.GD.ZS?locations=RU
- lenta.ru/news/2023/07/03/gosdolg/
- https://ach.gov.ru/upload/iblock/bca/ke0rrd7mtyvihkmhsjv43bgk5rzw1wc8.pdf
- https://www.ceicdata.com/en/russia/public-domestic-debt/domestic-debt
- https://www.statista.com/statistics/1049281/russia-external-debt-to-gdp-ratio/
- https://www.statista.com/statistics/1049304/russia-external-debt/
- https://www.ceicdata.com/en/indicator/russia/external-debt
- "Russia's National Wealth Fund at $148 billion at Jan 1 - Finance Ministry". euronews. 19 January 2023.
- Debt – external Archived 17 March 2019 at the Wayback Machine, CIA World Factbook. Retrieved 22 May 2010.
- "Corruptions Perceptions Index 2020". Transparency.org. 28 January 2021. Retrieved 31 January 2021.
- "Corruption Perceptions Index 2014". Transparency International. 3 December 2014. Retrieved 4 December 2015.
- Alferova, Ekaterina (26 October 2020). "В России предложили создать должность омбудсмена по борьбе с коррупцией" [Russia proposed to create the post of Ombudsman for the fight against corruption]. Известия (in Russian). Izvestia. Retrieved 5 November 2020.
- "Russia Corruption Report". GAN Integrity. June 2020. Retrieved 5 November 2020.
- Suhara, Manabu. "Corruption in Russia: A Historical Perspective" (PDF). Archived from the original (PDF) on 4 March 2016. Retrieved 4 December 2015.
- "Russia lost 4 billion dollars on unfavorable state procurement contracts in the last year". Meduza. Retrieved 7 December 2015.
- "Cops for hire". The Economist. 2010. Retrieved 4 December 2015.
- Klara Sabirianova Peter; Tetyana Zelenska (2010). "Corruption in Russian Health Care: The Determinants and Incidence of Bribery" (PDF). Retrieved 4 December 2015.
- Elena Denisova-Schmidt; Elvira Leontyeva; Yaroslav Prytula (2014). "Corruption at Universities is a Common Disease for Russia and Ukraine". Harvard University. Retrieved 4 December 2015.
- Maynes, Charles (26 January 2020). "New Reports Highlight Russia's Deep-Seated Culture of Corruption | Voice of America – English". www.voanews.com. Voice of America. Retrieved 5 November 2020.
- "80% of Russian Business Owners Fear Arbitrary Arrest". The Moscow Times. 26 May 2021. Retrieved 26 May 2021.
- "Russia: greenhouse gas emissions by sector". Statista. Retrieved 3 December 2020.
- "Electricity – production". CIA World Factbook. Central Intelligence Agency. Archived from the original on 31 March 2022. Retrieved 2 July 2021.
- Whiteman, Adrian; Rueda, Sonia; Akande, Dennis; Elhassan, Nazik; Escamilla, Gerardo; Arkhipova, Iana (March 2020). Renewable capacity statistics 2020 (PDF). Abu Dhabi: International Renewable Energy Agency. p. 3. ISBN 978-92-9260-239-0. Retrieved 8 November 2020.
- Long, Tony (27 June 2012). "June 27, 1954: World's First Nuclear Power Plant Opens". Wired. Retrieved 8 June 2021.
1954: The first nuclear power plant to be connected to an external grid goes operational in Obninsk, outside of Moscow... The nuclear reactor, used to generate electricity, heralded Obninsk's new role as a major Soviet scientific city, a status it retains in the Russian Federation where it carries the sobriquet of First Russian Science City.
- "Nuclear Power Today". www.world-nuclear.org. World Nuclear Association. October 2020. Retrieved 8 November 2020.
- "Нефть со всеми вытекающими". www.kommersant.ru. 27 October 2014.
- https://carnegiemoscow.org/commentary/61272
- https://rosstat.gov.ru/storage/mediabank/1b5RpebS/Maximov-tezisy.pdf
- "Росстат впервые рассчитал долю нефти и газа в российском ВВП". РБК. 13 July 2021.
- "Oil & gas share of Russia's GDP dropped to 15% in 2020". neftegazru.com. 14 July 2021.
- "Oil & gas share of Russia's GDP dropped to 15% in 2020 | NORVANREPORTS.COM | Business News, Insurance, Taxation, Oil & Gas, Maritime News, Ghana, Africa, World". 14 July 2021.
- "Oil & Gas Share Of Russia's GDP Dropped To 15% In 2020". OilPrice.com.
- "Что происходит с российской нефтью и газом? Разбираемся вместе с экспертами". 12 March 2022.
- ""Лишить Путина возможности вести войну"". Радио Свобода. 7 September 2022.
- "Какую роль нефть и газ играют в государственном бюджете и экономике". 25 October 2022.
- "Ranking Of The World's Diamond Mines By Estimated 2013 Production", Kitco, 20 August 2013.
- "USGS Gold Production Statistics" (PDF).
- "USGS Platinum Production Statistics" (PDF).
- "USGS Silver Production Statistics" (PDF).
- "USGS Copper Production Statistics" (PDF).
- "USGS Nickel Production Statistics" (PDF).
- "USGS Lead Production Statistics" (PDF).
- "USGS Bauxite Production Statistics" (PDF).
- "USGS Zinc Production Statistics" (PDF).
- "USGS Vanadinum Production Statistics" (PDF).
- "USGS Cobalt Production Statistics" (PDF).
- "USGS Iron Ore Production Statistics" (PDF).
- "USGS Boron Production Statistics" (PDF).
- "USGS Molybdenum Production Statistics" (PDF).
- "USGS Tin Production Statistics" (PDF).
- "USGS Sulfur Production Statistics" (PDF).
- "USGS Phosphate Production Statistics" (PDF).
- "USGS Gypsum Production Statistics" (PDF).
- "USGS Salt Production Statistics" (PDF).
- "World Uranium Mining". Archived from the original on 26 December 2018. Retrieved 28 April 2021.
- "Russia – Economy". Encyclopædia Britannica. Retrieved 1 July 2021.
- "Arable land (% of land area)". The World Bank. Retrieved 15 June 2021.
- Medetsky, Anatoly; Durisin, Megan (23 September 2020). "Russia's Dominance of the Wheat World Keeps Growing". Bloomberg L.P. Retrieved 15 June 2021.
- Shahbandeh, M. (8 July 2021). "Global barley producers by country 2020/21". Statista. Retrieved 18 July 2021.
This statistic provides a forecast of barley production volume worldwide in 2020/2021, by country. In that year, Russia produced about 20.63 million metric tons of barley.
- Shahbandeh, M. (12 November 2020). "Global leading oats producers 2020". Statista. Retrieved 18 July 2021.
- Shahbandeh, M. (10 February 2021). "Top countries in rye production 2019/2020". Statista. Retrieved 18 July 2021.
- Shahbandeh, M. (25 February 2021). "Sunflower seed production in major countries 2019/20". Statista. Retrieved 18 July 2021.
Russia is also a major producer of sunflower seeds worldwide, with a production volume of 15.3 million metric tons in 2019/2020.
- Lustgarten, Abrahm (16 December 2020). "How Russia Wins the Climate Crisis". The New York Times. Retrieved 15 June 2021.
- "The State of World Fisheries and Aquaculture" (PDF). Food and Agriculture Organization. 2018. Retrieved 4 February 2021.
- Manturov, Denis (2009). "Prospects for the Domestic Aircraft Industry". Military Parade (4): 8–9.
- Ionin, Andrey. "Russia's Space Program in 2006: Some Progress but No Clear Direction". Moscow Defense Brief. Centre for Analysis of Strategies and Technologies (2(#8)). Archived from the original on 27 August 2007.
- "Production Statistics 2018 Statistics". Retrieved 21 November 2019.
- "Russian car production slumped to lowest since Soviet times in 2022". Reuters. 1 February 2023. Archived from the original on 4 April 2023. Retrieved 23 May 2023.
- "Only 11 foreign car brands left in Russia out of 60 before the war". 15 December 2022.
- "Electronics regrowth in Russia". Eetimes.ru. Archived from the original on 7 February 2011. Retrieved 8 December 2014.
- "Electronics in Russia". English.pravda.ru. 25 December 2003. Archived from the original on 22 December 2004. Retrieved 8 December 2014.
- "Elbrus processors developer preparing to transfer production to Zelenograd's Mikron from Taiwan - media". Interfax. 30 May 2022.
- "The Proliferation Of Shopping Malls In Russia". 8 January 2023.
- Andrew E. Kramer (1 January 2013). "Malls Blossom in Russia, With a Middle Class". The New York Times. Retrieved 2 January 2013.
I feel like I'm in Disneyland
- "Retail trade revenue in Russia from 2010 to 2022". Retrieved 10 April 2023.
- Lenta.ru. "Internet usage statistic". It.tut.by. Archived from the original on 25 June 2009. Retrieved 12 November 2011.
- "The World Factbook — Central Intelligence Agency". www.cia.gov. Retrieved 3 January 2018.
- "Number of mobile cellular subscriptions in Russia from 2000 to 2021". Retrieved 21 August 2023.
- "Passenger transportation" (PDF). Russian Railways. 2017. Retrieved 2 July 2021.
- "Railways – The World Factbook". Central Intelligence Agency. Retrieved 15 June 2021.
- "О развитии дорожной инфраструктуры" [On the development of road infrastructure]. Government of Russia. 29 April 2016. Retrieved 14 January 2021.
- "Europe continues to report the world's highest Road Network Density, followed by East Asia and Pacific". International Road Federation. 16 December 2020. Retrieved 19 May 2021.
- "Waterways – The World Factbook". Central Intelligence Agency. Retrieved 15 June 2021.
- "Airports – The World Factbook". Central Intelligence Agency. Retrieved 15 June 2021.
- "Sheremetyevo today". www.svo.aero. Retrieved 10 June 2021.
- D. Elagina (22 January 2021). "Cargo throughput volume in Russia in 2020, by port". Statista. Retrieved 10 June 2021.
The Russian sea port Novorossiysk, located in the Azov-Black Sea basin, handled almost 142 million metric tons of cargo in 2020 and became the leading port in the country by the cargo throughput.
- "Nuclear icebreakers – what's so special about them?". Poseidon Expeditions. Retrieved 24 May 2021.
Russia is the only country constructing nuclear-powered icebreakers in the world. They were purposely built for the strategic importance of the Northern Sea Route and a more evident need to guarantee the safety of the Russian trade vessels in winter and Arctic settlements' dependency on supplies.
- "RUSSIAN CONSTRUCTION INDUSTRY: MOVING UPWARD?". Retrieved 21 August 2023.
- "Russian Insurance Market in 2013" (PDF). Rgs.ru. Retrieved 8 December 2014.
- Zubet, Alexei. "Russian Insurance Market in 2013" (PDF). Financial University, Moscow. Archived from the original (PDF) on 2 November 2014. Retrieved 30 August 2022.
- Huffington Post: Countries With The MOST College Graduates retrieved 27 September 2013
- "The 8th Annual Survey of the Russian Software Export Industry" (PDF). Russoft. 22 November 2011. Archived from the original (PDF) on 14 May 2012. Retrieved 5 May 2012.
- "Russian IT market worth $2,4 billion". Silicon Taiga. 26 December 2006. Archived from the original on 30 September 2007. Retrieved 12 November 2011.
- "Medvedev's Cabinet compels state-owned corporations to buy Russian technology". Russoft. Archived from the original on 19 December 2013. Retrieved 23 June 2013.
- "The internet business in Russia: Europe's great exception – The Economist". The Economist. 19 May 2012. Retrieved 14 March 2015.
- "Most Popular Search Engines in the World – Top Ten List – Tech Robo". Tech Robo. Archived from the original on 6 May 2015. Retrieved 14 March 2015.
- "Самые популярные поисковые системы в России". Topmira.com. Retrieved 8 December 2014.
- "UNWTO World Tourism Barometer". UNWTO World Tourism Barometer English Version. World Tourism Organization (UNWTO). 18 (6): 18. 2020. doi:10.18111/wtobarometereng. ISSN 1728-9246.
- Uppink Calderwood, Lauren; Soshkin, Maksim. Fisher, Mike (ed.). The Travel & Tourism Competitiveness Report 2019 (PDF). Geneva: World Economic Forum. p. xiii. ISBN 978-2-940631-01-8. Retrieved 11 November 2020.
- "Выборочная статистическая информация, рассчитанная в соответствии с Официальной статистической методологией оценки числа въездных и выездных туристских поездок – Ростуризм" [Selected statistical information calculated in accordance with the Official Statistical Methodology for Estimating the Number of Inbound and Outbound Tourist Trips – Rostourism]. tourism.gov.ru (in Russian). Federal Agency for Tourism (Russia). Archived from the original on 22 January 2021. Retrieved 11 November 2020.
- "Вице-премьер считает, что вклад туризма в ВВП России может вырасти в три раза за 10 лет" [Deputy Prime Minister believes that the contribution of tourism to Russia's GDP could triple in 10 years]. ТАСС (in Russian). TASS. 26 September 2020. Retrieved 11 November 2020.
- "Tourism Highlights 2014" (PDF). UNWTO (World Tourism Organization). 2014. Archived from the original (PDF) on 12 January 2015. Retrieved 20 January 2015.
- Vlasov, Artem (17 December 2018). "Названы самые популярные достопримечательности России" [The most popular sights of Russia are named]. Izvestia (in Russian). Retrieved 15 December 2020.
- https://crsreports.congress.gov/product/pdf/IF/IF12066
- "President Obama's Signature Paves Way for Permanent Normal Trade Relations with Russia and Moldova". ustr.gov. Archived from the original on 2 February 2017. Retrieved 27 January 2017.
- "Russian Federation | SITC Rev2 Groups | Exports to World | 2015 | WITS | Data". wits.worldbank.org. Retrieved 3 October 2017.
- "Russian Federation – Trade At a glance – Most Recent Value – WITS – Data". wits.worldbank.org.
- https://www.unescap.org/sites/default/d8files/knowledge-products/Russian_Federation.pdf
- Melchior, Arne (2019). "Russia in world trade: Between globalism and regionalism". Russian Journal of Economics. 5 (4): 354–384. doi:10.32609/j.ruje.5.49345. S2CID 210124625.
- "World Bank Open Data".
- "World Bank Open Data".
- "Trade openness".
- "M&A Statistics by Countries – Institute for Mergers, Acquisitions and Alliances (IMAA)". Institute for Mergers, Acquisitions and Alliances (IMAA). Retrieved 27 February 2018.
 This article incorporates text from this source, which is in the public domain. Soviet Union: A Country Study. Federal Research Division.
Further reading
- Alexeev, Michael, and Shlomo Weber, eds. The Oxford handbook of the Russian economy (Oxford UP, 2013) excerpt.
- Åslund, Anders. Russia's Crony Capitalism: The Path from Market Economy to Kleptocracy (Yale University Press, 2019). excerpt
- Connolly, Richard. The Russian economy: a very short introduction (2020) excerpt
- Davies, Robert William (28 March 1998). Soviet Economic Development from Lenin to Khrushchev. Cambridge University Press. ISBN 978-0-521-62742-9.
- Gustafson, Thane. Wheel of Fortune: The Battle for Oil and Power in Russia (Harvard UP, 2012). excerpt
- Meyers, William Henry, Schmitz, Andrew, eds. Transition to agricultural market economies: the future of Kazakhstan, Russia, and Ukraine (2015)
- Miller, Chris. Putinomics: Power and money in resurgent Russia (UNC Press Books, 2018). excerpt
- Moser, Nat. Oil and the Economy of Russia: From the Late-Tsarist to the Post-Soviet Period (2017)
- Novokmet, Filip Thomas Piketty, and Gabriel Zucman (2017). From Soviets to Oligarchs: Inequality and Property in Russia 1905–2016
- Zinchenko, L. A., et al. "Main features of the Russian economy and its development." International Journal of Applied Business and Economic Research 15.23 (2017): 265–272.
External links
- Ministry of Finance of the Russian Federation
- Ministry of Economic Development (Russia)
- World Bank Summary Trade Statistics Russia
- Russia profile at the CIA World Factbook
- Russia profile at The World Bank
| History |
|
|---|---|
| Natural resources | |
| Industry | |
| Infrastructure | |
| Services | |
| Finance | |
| Regional economies | |
| Economic regions | |
| Other | |
| |