Mouthier-Haute-Pierre
Mouthier-Haute-Pierre (French pronunciation: [mutje ot pjɛʁ]) is a commune in the Doubs department in the Bourgogne-Franche-Comté region in eastern France.
Mouthier-Haute-Pierre | |
|---|---|
.JPG.webp) A general view of Mouthier-Haute-Pierre | |
 Coat of arms | |
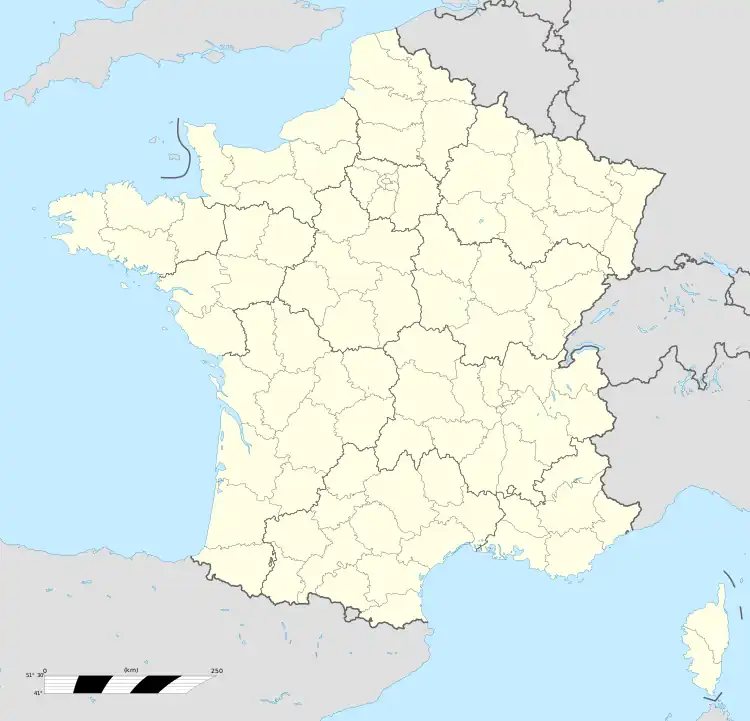
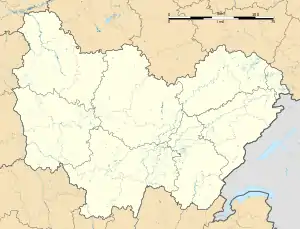
Location of Mouthier-Haute-Pierre | |
 Mouthier-Haute-Pierre  Mouthier-Haute-Pierre | |
| Coordinates: 47°02′23″N 6°16′36″E | |
| Country | France |
| Region | Bourgogne-Franche-Comté |
| Department | Doubs |
| Arrondissement | Besançon |
| Canton | Ornans |
| Government | |
| • Mayor (2020–2026) | Romuald Maugain[1] |
| Area 1 | 12.13 km2 (4.68 sq mi) |
| Population | 344 |
| • Density | 28/km2 (73/sq mi) |
| Time zone | UTC+01:00 (CET) |
| • Summer (DST) | UTC+02:00 (CEST) |
| INSEE/Postal code | 25415 /25920 |
| Elevation | 370–867 m (1,214–2,844 ft) |
| 1 French Land Register data, which excludes lakes, ponds, glaciers > 1 km2 (0.386 sq mi or 247 acres) and river estuaries. | |
The village is located in the upper Loue valley, just downstream of its source, in a particularly scenic landscape consisting of a natural amphitheatre dominated by steep cliffs. Other prominent features of the scenery are the 50-metre (160 ft) Syratu Falls, the Gorges de Nouailles, a canyon up to 350 meters deep, the Baume Archée and Faux-Monnayeurs caves and the source of Pontet.
The town grew up around a monastery of which it took its name, Monasterium of Alta Petra. Quoted from 870 in the division of Lothaire II, it was attached to the abbey of Cluny around 1120 with the rank of priory. It is probably during this time that the beginning of the winemaking activity marks the local identity. From the eighteenth century, many workshops and mills develop on the banks of the river and the town reach more than 1,000 inhabitants. Touched by the phylloxera crisis at the end of the nineteenth century, the vineyards were replaced by cherry trees intended to the production of a famous artisanal kirsch. By 2016, Mouthier-Haute-Pierre had a population of 328 people.
Geography
.JPG.webp)
The commune lies 15 km (9.3 mi) southeast of Ornans.
Population
| Year | Pop. | ±% |
|---|---|---|
| 1962 | 253 | — |
| 1968 | 315 | +24.5% |
| 1975 | 338 | +7.3% |
| 1982 | 360 | +6.5% |
| 1990 | 356 | −1.1% |
| 1999 | 343 | −3.7% |
| 2008 | 310 | −9.6% |
| 2012 | 314 | +1.3% |
See also
References
- "Répertoire national des élus: les maires". data.gouv.fr, Plateforme ouverte des données publiques françaises (in French). 2 December 2020.
- "Populations légales 2020". The National Institute of Statistics and Economic Studies. 29 December 2022.