List of municipalities in Quebec
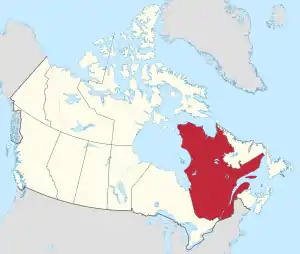
Quebec is the second-most populous province in Canada with 8,501,833 residents as of 2021 and is the largest in land area at 1,298,599.75 km2 (501,392.17 sq mi).[1] For statistical purposes, the province is divided into 1,282 census subdivisions,[2] which are municipalities and equivalents.[3] Quebec's 1,218 municipalities include 87 regional county municipalities at the supralocal level and 1,131 local municipalities (88.2% of its census subdivisions). Generally, most local municipalities, as well as some unorganized territories, are nested within regional county municipalities.[4] The 1,218 municipalities are directly responsible for the provision of public transit, fire protection, potable water, water purification, and waste management services to its residents.[4] They also share responsibility with the province in the provision of housing, road networks, police protection, recreation and culture, parks and natural spaces, and land use planning and development.[4]

.JPG.webp)
_2014.jpg.webp)
Below the regional county municipality level, the Government of Quebec's Ministry of Municipal Affairs and Housing recognizes 10 types of local municipalities – cities, towns, village municipalities, parish municipalities, township municipalities, united township municipalities, Cree village municipalities, Naskapi village municipalities, northern village municipalities, and simply "municipalities".[5][6] Cities and towns are legislated primarily by the Loi sur les cités et villes (Cities and Towns Act).[7] The Cree Villages and the Naskapi Village Act presides over the province's Cree and Naskapi village municipalities,[8] while the Act Respecting Northern Villages and the Kativik Regional Government presides over northern villages.[9] The 5 other types of municipalities are legislated primarily by the Code municipal du Québec (Municipal Code of Quebec).[10] The Municipal Powers Act and 40 other pieces of legislation also apply to municipalities.[4]
Of Quebec's 1,130 local municipalities, 656 or 58% of them are simply "municipalities".[5][6] Among the remaining 474, there are 232 towns, 42 village municipalities, 133 parish municipalities, 42 township municipalities, 2 united township municipalities, 8 Cree village municipalities, 1 Naskapi village municipality, and 14 northern village municipalities.[5][6] Despite still being a legal municipal status type,[7] there are no longer any cities in Quebec,[5][2] although one town is permitted to brand itself as a city in its official name.[11]
In 2021, Quebec's local municipalities covered 38.4% of the province's land mass yet were home to 99.5% of its population.[12][lower-alpha 1] Montreal is the province's largest municipality with 1,762,949 residents.[12] Chisasibi, Eastmain, Kawawachikamach, Nemaska, Saint-Louis-de-Gonzague-du-Cap-Tourmente, Waskaganish, Waswanipi, Wemindji, and Whapmagoostui are Quebec's smallest municipalities each with a population of 0.[12][lower-alpha 2] The largest municipality by land area is Eeyou Istchee Baie-James at 283,123.42 km2 (109,314.56 sq mi), while the smallest by land area is Notre-Dame-des-Anges at 0.04 km2 (0.015 sq mi).[12]
Regional county municipalities
A regional county municipality (French: Municipalité régionale de comté) in Quebec is a membership of numerous local municipalities, which in some cases can include unorganized territories, that was formed to administer certain services at the regional level such as waste management, public transit, land use planning and development, property assessment, etc.[14] Its council comprises the mayors of all local municipalities within its membership and in some cases one or more other elected representatives.[14]
Quebec legally recognizes 87 regional county municipalities (RCMs).[14][lower-alpha 3] They had a cumulative population of 3,909,607 in the 2021 Census of Population.[15] The most and least populated of the province's incorporated RCMs are Roussilon with 185,568 residents and Le Golfe-du-Saint-Laurent with 3,382 residents.[15] Quebec's largest and smallest RCMs by land area are Caniapiscau at 64,936.44 km2 (25,072.10 sq mi) and L'Île-d'Orléans at 194.58 km2 (75.13 sq mi).[15]
| Name[15] | 2021 Census of Population[15] | ||||
|---|---|---|---|---|---|
| Population (2021) |
Population (2016) |
Change |
Land area (km²) |
Population density (/km2) | |
| Abitibi | 24,764 | 24,639 | +0.5% | 7,627.63 | 3.2 |
| Abitibi-Ouest | 20,526 | 20,538 | −0.1% | 3,312.45 | 6.2 |
| Acton | 15,654 | 15,594 | +0.4% | 579.64 | 27.0 |
| Antoine-Labelle | 36,462 | 35,243 | +3.5% | 14,809.85 | 2.5 |
| Argenteuil | 34,752 | 32,389 | +7.3% | 1,234.69 | 28.1 |
| Arthabaska | 74,348 | 72,014 | +3.2% | 1,887.09 | 39.4 |
| Avignon | 13,415 | 14,461 | −7.2% | 3,487.37 | 3.8 |
| Beauce-Centre | 19,253 | 19,125 | +0.7% | 839.60 | 22.9 |
| Beauce-Sartigan | 53,384 | 52,406 | +1.9% | 1,952.73 | 27.3 |
| Beauharnois-Salaberry | 68,322 | 64,320 | +6.2% | 468.48 | 145.8 |
| Bécancour | 20,748 | 20,404 | +1.7% | 1,143.13 | 18.2 |
| Bellechasse | 38,000 | 37,233 | +2.1% | 1,749.91 | 21.7 |
| Bonaventure | 17,557 | 17,660 | −0.6% | 4,379.46 | 4.0 |
| Brome-Missisquoi | 64,786 | 58,314 | +11.1% | 1,650.20 | 39.3 |
| Caniapiscau | 3,882 | 3,881 | 0.0% | 64,936.44 | 0.1 |
| Charlevoix | 13,371 | 12,997 | +2.9% | 3,736.80 | 3.6 |
| Charlevoix-Est | 15,409 | 15,509 | −0.6% | 2,288.97 | 6.7 |
| Coaticook | 18,906 | 18,497 | +2.2% | 1,338.86 | 14.1 |
| D'Autray | 44,080 | 42,189 | +4.5% | 1,234.67 | 35.7 |
| Deux-Montagnes | 102,052 | 98,203 | +3.9% | 242.88 | 420.2 |
| Drummond | 107,967 | 103,397 | +4.4% | 1,599.10 | 67.5 |
| Joliette | 71,124 | 66,550 | +6.9% | 417.41 | 170.4 |
| Kamouraska | 21,307 | 21,073 | +1.1% | 2,241.05 | 9.5 |
| La Côte-de-Beaupré | 30,240 | 28,199 | +7.2% | 4,845.19 | 6.2 |
| La Côte-de-Gaspé | 17,547 | 17,117 | +2.5% | 4,088.39 | 4.3 |
| La Haute-Côte-Nord | 10,278 | 10,846 | −5.2% | 11,295.82 | 0.9 |
| La Haute-Gaspésie | 10,950 | 11,316 | −3.2% | 5,053.88 | 2.2 |
| La Haute-Yamaska | 92,796 | 88,306 | +5.1% | 636.00 | 145.9 |
| La Jacques-Cartier | 47,813 | 43,485 | +10.0% | 3,183.75 | 15.0 |
| La Matanie | 20,883 | 21,301 | −2.0% | 3,315.74 | 6.3 |
| La Matapédia | 17,592 | 17,925 | −1.9% | 5,354.53 | 3.3 |
| La Mitis | 18,363 | 18,210 | +0.8% | 2,275.56 | 8.1 |
| La Nouvelle-Beauce | 37,988 | 36,785 | +3.3% | 905.33 | 42.0 |
| La Rivière-du-Nord | 140,394 | 128,170 | +9.5% | 447.88 | 313.5 |
| La Vallée-de-la-Gatineau | 20,547 | 20,182 | +1.8% | 12,362.49 | 1.7 |
| La Vallée-de-l'Or | 43,347 | 43,226 | +0.3% | 24,094.84 | 1.8 |
| La Vallée-du-Richelieu | 131,803 | 124,420 | +5.9% | 587.84 | 224.2 |
| Lac-Saint-Jean-Est | 52,475 | 52,741 | −0.5% | 2,767.51 | 19.0 |
| L'Assomption | 128,087 | 124,759 | +2.7% | 255.16 | 502.0 |
| L'Érable | 23,534 | 23,425 | +0.5% | 1,287.03 | 18.3 |
| L'Île-d'Orléans | 6,817 | 7,082 | −3.7% | 194.58 | 35.0 |
| L'Islet | 17,598 | 17,798 | −1.1% | 2,097.09 | 8.4 |
| Le Domaine-du-Roy | 31,095 | 31,285 | −0.6% | 17,476.45 | 1.8 |
| Le Fjord-du-Saguenay | 23,110 | 21,600 | +7.0% | 38,672.61 | 0.6 |
| Le Golfe-du-Saint-Laurent | 3,382 | 4,736 | −28.6% | 40,686.75 | 0.1 |
| Le Granit | 21,948 | 21,462 | +2.3% | 2,731.55 | 8.0 |
| Le Haut-Richelieu | 121,277 | 117,443 | +3.3% | 934.85 | 129.7 |
| Le Haut-Saint-François | 22,926 | 22,335 | +2.6% | 2,269.68 | 10.1 |
| Le Haut-Saint-Laurent | 22,213 | 22,454 | −1.1% | 1,168.08 | 19.0 |
| Le Rocher-Percé | 17,219 | 17,282 | −0.4% | 3,074.80 | 5.6 |
| Le Val-Saint-François | 31,551 | 30,686 | +2.8% | 1,401.56 | 22.5 |
| Les Appalaches | 43,412 | 42,346 | +2.5% | 1,911.83 | 22.7 |
| Les Basques | 8,873 | 8,694 | +2.1% | 1,120.03 | 7.9 |
| Les Chenaux | 19,180 | 18,617 | +3.0% | 872.01 | 22.0 |
| Les Collines-de-l'Outaouais[lower-alpha 4] | 53,657 | 49,094 | +9.3% | 1,912.05 | 28.1 |
| Les Etchemins | 16,927 | 16,536 | +2.4% | 1,809.61 | 9.4 |
| Les Jardins-de-Napierville | 30,339 | 27,870 | +8.9% | 802.52 | 37.8 |
| Les Laurentides | 50,777 | 45,902 | +10.6% | 2,457.53 | 20.7 |
| Les Maskoutains | 89,432 | 87,099 | +2.7% | 1,302.15 | 68.7 |
| Les Moulins | 171,127 | 158,267 | +8.1% | 260.65 | 656.5 |
| Les Pays-d'en-Haut | 46,906 | 41,877 | +12.0% | 673.98 | 69.6 |
| Les Sources | 14,623 | 14,286 | +2.4% | 785.42 | 18.6 |
| Lotbinière | 34,586 | 31,741 | +9.0% | 1,662.26 | 20.8 |
| Manicouagan | 30,158 | 31,027 | −2.8% | 34,655.04 | 0.9 |
| Marguerite-D'Youville | 80,313 | 77,550 | +3.6% | 347.10 | 231.4 |
| Maria-Chapdelaine | 24,149 | 24,793 | −2.6% | 35,501.49 | 0.7 |
| Maskinongé | 37,292 | 36,316 | +2.7% | 2,367.08 | 15.8 |
| Matawinie | 55,500 | 50,435 | +10.0% | 9,423.15 | 5.9 |
| Mékinac | 12,762 | 12,358 | +3.3% | 5,186.22 | 2.5 |
| Memphrémagog | 54,797 | 50,415 | +8.7% | 1,317.42 | 41.6 |
| Minganie | 6,467 | 6,587 | −1.8% | 53,340.31 | 0.1 |
| Montcalm | 58,680 | 52,596 | +11.6% | 709.58 | 82.7 |
| Montmagny | 22,481 | 22,698 | −1.0% | 1,695.09 | 13.3 |
| Nicolet-Yamaska | 23,848 | 23,159 | +3.0% | 1,004.98 | 23.7 |
| Papineau[lower-alpha 5] | 25,149 | 22,832 | +10.1% | 3,016.78 | 8.3 |
| Pierre-De Saurel | 51,843 | 51,025 | +1.6% | 595.13 | 87.1 |
| Pontiac | 14,764 | 14,251 | +3.6% | 12,824.36 | 1.2 |
| Portneuf | 55,523 | 53,008 | +4.7% | 3,887.88 | 14.3 |
| Rimouski-Neigette | 57,191 | 56,650 | +1.0% | 2,703.99 | 21.2 |
| Rivière-du-Loup | 35,338 | 33,958 | +4.1% | 1,276.86 | 27.7 |
| Roussillon | 185,568 | 171,443 | +8.2% | 420.44 | 441.4 |
| Rouville | 37,889 | 36,536 | +3.7% | 482.80 | 78.5 |
| Sept-Rivières | 34,358 | 35,441 | −3.1% | 29,527.90 | 1.2 |
| Témiscamingue | 16,132 | 15,980 | +1.0% | 16,327.26 | 1.0 |
| Témiscouata | 19,492 | 19,574 | −0.4% | 3,900.42 | 5.0 |
| Thérèse-De Blainville | 163,632 | 157,103 | +4.2% | 206.52 | 792.3 |
| Vaudreuil-Soulanges | 162,600 | 149,349 | +8.9% | 854.19 | 190.4 |
| Total regional county municipalities | 3,909,607 | 3,738,625 | +4.6% | 553,765.38 | 7.1 |
| Province of Quebec | 8,501,833 | 8,164,361 | +4.1% | 1,298,599.75 | 6.5 |
Local municipalities
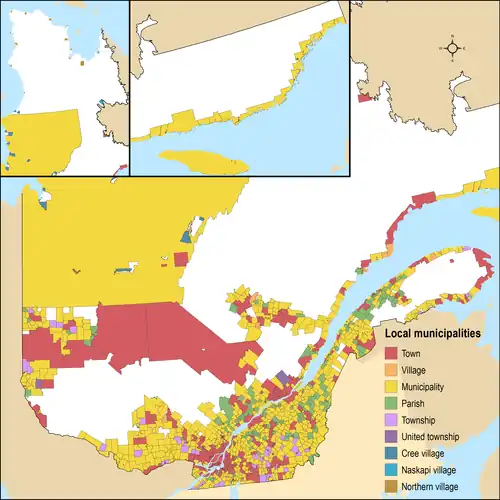
Quebec's Act Respecting Municipal Territorial Divisions states that a "municipality that is not a regional county municipality is a local municipality."[18] The province's 10 types of local municipalities include cities, towns, village municipalities, parish municipalities, township municipalities, united township municipalities, municipalities, Cree village municipalities, Naskapi village municipalities, and northern village municipalities.[5][6]
Cities
City (French: cité) status is no longer officially in use in Quebec.[5][2] The last municipalities to have city status in Quebec were Dorval and Côte-Saint-Luc.[19] Both held city status until they dissolved to become part of an amalgamated Montreal on January 1, 2002.[20] While both were re-incorporated as towns on January 1, 2006,[21] Dorval retained "City of Dorval" (French: Cité de Dorval) as its name for branding purposes.[11]
Prior to 1988 amendments to the Cities and Towns Act, cities could be formed from any municipality in effect under the Municipal Code of Quebec with a population of 2,000 or more if the municipality:[22]
- passed a resolution to formally request the Government of Quebec to change to city status;[23]
- published the proposed resolution twice in the provincial gazette;[23]
- obtained approval of its voters during an election or through a referendum;[23] and
- submitted a petition to the Minister of Municipal Affairs for the letters patent to be granted within two months of the voters' approval that details the population, name, and boundaries of the city as well as the location of its first meeting of city council.[24][25]
Upon submission of the petition with a certificate signed by the municipality's secretary-treasurer confirming the resolution's approval, the Government of Quebec could hold a public inquiry on the city status application, approve the application by granting the letters patent, and alter the proposed name of the city from the name proposed in the application.[25]
Also prior to the 1988 amendments to the Cities and Towns Act, the Government of Quebec could consider and approve an application for city status from a municipality with a population of less than 2,000 under circumstances it deemed extenuating.[22]
Towns
Quebec has 232 towns (French: villes) that had a cumulative population of 7,158,798 in the 2021 Census of Population.[5][12] Quebec's largest and smallest towns by population are Montreal and L'Île-Dorval with populations of 1,762,949 and 30.[12] Quebec's largest and smallest towns by land area are La Tuque and L'Île-Dorval with 24,809.40 km2 (9,578.96 sq mi) and 0.19 km2 (0.073 sq mi).[12]
Prior to 1988 amendments to the Cities and Towns Act, towns could be formed from any municipality in effect under the Municipal Code of Quebec with a population of 2,000 or more if the municipality:[22]
- passed a resolution to formally request the Government of Quebec to change to town status;[23]
- published the proposed resolution twice in the provincial gazette;[23]
- obtained approval of its voters during an election or through a referendum;[23] and
- submitted a petition to the Minister of Municipal Affairs for the letters patent to be granted within two months of the voters' approval that details the population, name, and boundaries of the town as well as the location of its first meeting of town council.[24][25]
Upon submission of the petition with a certificate signed by the municipality's secretary-treasurer confirming the resolution's approval, the Government of Quebec could hold a public inquiry on the town status application, approve the application by granting the letters patent, and alter the proposed name of the town from the name proposed in the application.[25]
Also prior to the 1988 amendments to the Cities and Towns Act, the Government of Quebec could consider and approve an application for town or city status from a municipality with a population of less than 2,000 under circumstances it deemed extenuating.[22]
Under current legislation, any towns that were incorporated by special legislation or letters patent prior to September 1, 1979 or incorporated by any charter or letters patent approved under the Cities and Towns Act between September 1, 1979 and May 7, 1996 inclusive are subject to the Cities and Towns Act.[7]
Village municipalities
In Quebec, a village (French: village) is an "[r]ural agglomeration characterized by a more or less concentrated habitat, possessing essential services and offering a form of community life", while a village parish municipality (French: municipalité de village) is the "[t]erritory of a village erected into a municipality."[26][lower-alpha 6] The Municipal Code of Quebec applies to all village municipalities in Quebec.[10]
Quebec has 42 village municipalities that had a cumulative population of 45,349 in the 2021 Census of Population.[5][12] Quebec's largest village municipality is Val-David with a population of 5,558, while Kingsbury is province's smallest village municipality with a population of 142.[12] Quebec's largest and smallest village municipalities by area are Baie-Trinité and Lac-Poulin with land areas of 417.48 km2 (161.19 sq mi) and 0.88 km2 (0.34 sq mi).[12]
Parish municipalities
A parish (French: paroisse) in Quebec is an "[e]cclesiastical district where the jurisdiction of a minister of religion (priest, pastor, etc.) is exercised", while a parish municipality (French: municipalité de paroisse) is the "[t]erritory of a parish erected into a municipality."[26][lower-alpha 6] The Municipal Code of Quebec applies to all parish municipalities in Quebec.[10]
Quebec has 133 parish municipalities that had a cumulative population of 137,250 in the 2021 Census of Population.[5][12] Quebec's largest and smallest parish municipalities Notre-Dame-du-Mont-Carmel and Saint-Louis-de-Gonzague-du-Cap-Tourmente with populations of 6,121 and 0.[12][lower-alpha 2] Quebec's largest and smallest parish municipalities by land area are Saint-Alexis-des-Monts and Notre-Dame-des-Anges with 1,035.74 km2 (399.90 sq mi) and 0.04 km2 (0.015 sq mi).[12]
Township municipalities
In Quebec, a township (French: canton) is an "[t]erritorial unit of a system of division of space, generally rectangular in shape, used for the freehold concession of public lands", while a township municipality (French: municipalité de canton) is the "[t]erritory or part of territory of a township established as a municipality."[26][lower-alpha 6] The Municipal Code of Quebec applies to all township municipalities in Quebec.[10]
Quebec has 42 township municipalities that had a cumulative population of 48,124 and in the 2021 Census of Population.[5][12] Quebec's largest and smallest township municipalities by population are Shefford and Ristigouche-Partie-Sud-Est with populations of 7,253 and 170.[12] Quebec's largest and smallest township municipalities by area are Nédélec and Bedford with land areas of 371.49 km2 (143.43 sq mi) and 31.96 km2 (12.34 sq mi).[12]
United township municipalities
A united township municipality (French: municipalité de cantons unis) in Quebec is the "[t]erritory of two or more neighbo[u]ring townships erected into a municipality."[26][lower-alpha 6] The Municipal Code of Quebec applies to all united township municipalities in Quebec.[10]
Quebec has two united township municipalities that had a cumulative population of 10,002 and in the 2021 Census of Population.[5][12] Stoneham-et-Tewkesbury, the larger united township municipality, had a population of 9,682 and a land area of 670.03 km2 (258.70 sq mi) in 2021, while Latulipe-et-Gaboury had a population of 320 and a land area of 270.11 km2 (104.29 sq mi).[12]
Municipalities
A municipality (French: municipalité) in Quebec is the "[t]erritory over which a local authority is exercised in accordance with municipal laws."[26][lower-alpha 6] The Municipal Code of Quebec applies to all municipalities in Quebec.[10]
Quebec has 656 municipalities that are simply designated "municipalities".[5] They had a cumulative population of 1,045,898 in the 2021 Census of Population.[12] Quebec's largest and smallest municipalities are Sainte-Sophie and Saint-Benoît-du-Lac with populations of 18,080 and 43.[12] Quebec's largest and smallest municipalities by land area are Eeyou Istchee Baie-James and Howick with 283,123.42 km2 (109,314.56 sq mi) and 0.96 km2 (0.37 sq mi).[12]
Cree village municipalities
In Quebec, a Cree village (French: village cri) is an "[a]gglomeration inhabited mainly by the Crees and located on category 1A lands as defined in the James Bay and Northern Quebec Agreement", while a Cree village municipality (French: municipalité de village cri) is the "[t]erritory over which a local Cree authority is exercised in accordance with the Act respecting the Cree villages and the Naskapi village."[26][lower-alpha 6] The Cree Villages and the Naskapi Village Act applies to all Cree village municipalities in Quebec.[8]
Quebec has 8 Cree village municipalities of which 7 were unpopulated as of the 2021 Census of Population.[6][12] With 10 residents, Mistissini was Quebec's only populated Cree village municipality as of 2021.[12][lower-alpha 2] The province's largest and smallest Cree village municipalities by area are Mistissini and Nemaska with land areas of 488.03 km2 (188.43 sq mi) and 47.89 km2 (18.49 sq mi).[12]
Naskapi village municipalities
In Quebec, a Naskapi village (French: village naskapi) is an "[a]gglomeration inhabited mainly by Naskapis and located on category 1A-N lands as defined in the Northeastern Quebec Agreement", while a Naskapi village municipality (French: municipalité de village naskapi) is the "[t]erritory over which a Naskapi local authority is exercised in accordance with the Act respecting the Cree villages and the Naskapi village."[26][lower-alpha 6] The Cree Villages and the Naskapi Village Act applies to the province's lone Naskapi village municipality in Quebec.[8]
Kawawachikamach is Quebec's only Naskapi village municipality.[6] It had no residents and a land area of 234.80 km2 (90.66 sq mi) as of the 2021 Census of Population.[12][lower-alpha 2]
Northern village municipalities
In Quebec, a northern village municipality (French: municipalité de village nordique) is the "[t]erritory over which local authority is exercised in accordance with the Act respecting northern villages and the Kativik Regional Government."[26][lower-alpha 6] Act Respecting Northern Villages and the Kativik Regional Government applies to all northern village municipalities in Quebec.[9]
The province has 14 northern village municipalities that had a cumulative population of 14,045 in the 2021 Census of Population.[6][12] Quebec's largest northern village municipality is Kuujjuaq with a population of 2,638, while Aupaluk is province's smallest northern village municipality with a population of 233.[12] Quebec's largest and smallest northern village municipalities by area are Kuujjuaq and Kuujjuarapik with land areas of 289.97 km2 (111.96 sq mi) and 7.45 km2 (2.88 sq mi).[12]
List of local municipalities
| Name | Status[5] | Census division[12] | 2021 Census of Population[12] | ||||
|---|---|---|---|---|---|---|---|
| Population (2021) |
Population (2016) |
Change |
Land area (km2) |
Population density (/km2) | |||
| Abercorn | Village | Brome-Missisquoi | 341 | 334 | +2.1% | 26.72 | 12.8 |
| Acton Vale | Town | Acton | 7,605 | 7,656 | −0.7% | 91.01 | 83.6 |
| Adstock | Municipality | Les Appalaches | 2,903 | 2,806 | +3.5% | 290.03 | 10.0 |
| Aguanish | Municipality | Minganie | 224 | 245 | −8.6% | 532.04 | 0.4 |
| Akulivik | Northern village | Nord-du-Québec | 642 | 633 | +1.4% | 75.02 | 8.6 |
| Albanel | Municipality | Maria-Chapdelaine | 2,181 | 2,262 | −3.6% | 197.45 | 11.0 |
| Albertville | Municipality | La Matapédia | 239 | 226 | +5.8% | 103.13 | 2.3 |
| Alleyn-et-Cawood | Municipality | Pontiac | 229 | 172 | +33.1% | 308.91 | 0.7 |
| Alma | Town | Lac-Saint-Jean-Est | 30,331 | 30,771 | −1.4% | 194.92 | 155.6 |
| Amherst | Township | Les Laurentides | 1,728 | 1,484 | +16.4% | 227.86 | 7.6 |
| Amos | Town | Abitibi | 12,675 | 12,823 | −1.2% | 429.04 | 29.5 |
| Amqui | Town | La Matapédia | 5,999 | 6,178 | −2.9% | 121.02 | 49.6 |
| Ange-Gardien | Municipality | Rouville | 2,889 | 2,699 | +7.0% | 90.21 | 32.0 |
| Armagh | Municipality | Bellechasse | 1,439 | 1,488 | −3.3% | 167.99 | 8.6 |
| Arundel | Township | Les Laurentides | 578 | 563 | +2.7% | 63.45 | 9.1 |
| Ascot Corner | Municipality | Le Haut-Saint-François | 3,368 | 3,158 | +6.6% | 81.64 | 41.3 |
| Aston-Jonction | Municipality | Nicolet-Yamaska | 441 | 424 | +4.0% | 26.20 | 16.8 |
| Auclair | Municipality | Témiscouata | 447 | 448 | −0.2% | 105.78 | 4.2 |
| Audet | Municipality | Le Granit | 708 | 734 | −3.5% | 134.95 | 5.2 |
| Aumond | Township | La Vallée-de-la-Gatineau | 754 | 754 | 0.0% | 212.82 | 3.5 |
| Aupaluk | Northern village | Nord-du-Québec | 233 | 209 | +11.5% | 28.68 | 8.1 |
| Austin | Municipality | Memphrémagog | 1,748 | 1,485 | +17.7% | 73.58 | 23.8 |
| Authier | Municipality | Abitibi-Ouest | 290 | 268 | +8.2% | 142.22 | 2.0 |
| Authier-Nord | Municipality | Abitibi-Ouest | 288 | 300 | −4.0% | 278.05 | 1.0 |
| Ayer's Cliff | Village | Memphrémagog | 1,180 | 1,073 | +10.0% | 5.53 | 213.4 |
| Baie-Comeau | Town | Manicouagan | 20,687 | 21,536 | −3.9% | 334.83 | 61.8 |
| Baie-D'Urfé | Town | Montréal | 3,764 | 3,823 | −1.5% | 6.03 | 624.2 |
| Baie-des-Sables | Municipality | La Matanie | 613 | 628 | −2.4% | 65.07 | 9.4 |
| Baie-du-Febvre | Municipality | Nicolet-Yamaska | 961 | 988 | −2.7% | 96.78 | 9.9 |
| Baie-Johan-Beetz | Municipality | Minganie | 84 | 86 | −2.3% | 327.46 | 0.3 |
| Baie-Saint-Paul | Town | Charlevoix | 7,371 | 7,146 | +3.1% | 545.85 | 13.5 |
| Baie-Sainte-Catherine | Municipality | Charlevoix-Est | 184 | 206 | −10.7% | 232.89 | 0.8 |
| Baie-Trinité | Village | Manicouagan | 438 | 407 | +7.6% | 417.48 | 1.0 |
| Barkmere | Town | Les Laurentides | 81 | 58 | +39.7% | 17.72 | 4.6 |
| Barnston-Ouest | Municipality | Coaticook | 546 | 559 | −2.3% | 99.36 | 5.5 |
| Barraute | Municipality | Abitibi | 1,986 | 1,968 | +0.9% | 493.04 | 4.0 |
| Batiscan | Municipality | Les Chenaux | 958 | 903 | +6.1% | 43.25 | 22.2 |
| Beaconsfield | Town | Montréal | 19,277 | 19,324 | −0.2% | 11.03 | 1,747.7 |
| Béarn | Municipality | Témiscamingue | 708 | 720 | −1.7% | 496.28 | 1.4 |
| Beauceville | Town | Beauce-Centre | 6,185 | 6,291 | −1.7% | 164.59 | 37.6 |
| Beauharnois | Town | Beauharnois-Salaberry | 13,638 | 12,884 | +5.9% | 68.22 | 199.9 |
| Beaulac-Garthby | Municipality | Les Appalaches | 931 | 905 | +2.9% | 75.96 | 12.3 |
| Beaumont | Municipality | Bellechasse | 2,968 | 2,942 | +0.9% | 44.57 | 66.6 |
| Beaupré | Town | La Côte-de-Beaupré | 4,117 | 3,752 | +9.7% | 22.97 | 179.2 |
| Bécancour | Town | Bécancour | 13,561 | 13,031 | +4.1% | 439.54 | 30.9 |
| Bedford | Township | Brome-Missisquoi | 658 | 687 | −4.2% | 31.96 | 20.6 |
| Bedford | Town | Brome-Missisquoi | 2,558 | 2,560 | −0.1% | 4.23 | 604.7 |
| Bégin | Municipality | Le Fjord-du-Saguenay | 851 | 818 | +4.0% | 189.67 | 4.5 |
| Belcourt | Municipality | La Vallée-de-l'Or | 219 | 225 | −2.7% | 409.74 | 0.5 |
| Belleterre | Town | Témiscamingue | 285 | 313 | −8.9% | 544.49 | 0.5 |
| Beloeil | Town | La Vallée-du-Richelieu | 24,104 | 22,458 | +7.3% | 24.38 | 988.7 |
| Berry | Municipality | Abitibi | 535 | 538 | −0.6% | 575.07 | 0.9 |
| Berthier-sur-Mer | Municipality | Montmagny | 1,744 | 1,555 | +12.2% | 26.85 | 65.0 |
| Berthierville | Town | D'Autray | 4,386 | 4,189 | +4.7% | 6.77 | 647.9 |
| Béthanie | Municipality | Acton | 350 | 322 | +8.7% | 47.01 | 7.4 |
| Biencourt | Municipality | Témiscouata | 433 | 464 | −6.7% | 187.12 | 2.3 |
| Blainville | Town | Thérèse-De Blainville | 59,819 | 56,863 | +5.2% | 54.97 | 1,088.2 |
| Blanc-Sablon | Municipality | Le Golfe-du-Saint-Laurent | 1,122 | 1,112 | +0.9% | 234.98 | 4.8 |
| Blue Sea | Municipality | La Vallée-de-la-Gatineau | 696 | 639 | +8.9% | 72.97 | 9.5 |
| Boileau | Municipality | Papineau | 405 | 335 | +20.9% | 134.08 | 3.0 |
| Boisbriand | Town | Thérèse-De Blainville | 28,308 | 26,884 | +5.3% | 27.67 | 1,023.1 |
| Bois-des-Filion | Town | Thérèse-De Blainville | 10,159 | 9,636 | +5.4% | 4.36 | 2,330.0 |
| Bois-Franc | Municipality | La Vallée-de-la-Gatineau | 411 | 421 | −2.4% | 71.56 | 5.7 |
| Boischatel | Municipality | La Côte-de-Beaupré | 8,231 | 7,587 | +8.5% | 20.36 | 404.3 |
| Bolton-Est | Municipality | Memphrémagog | 1,108 | 940 | +17.9% | 79.39 | 14.0 |
| Bolton-Ouest | Municipality | Brome-Missisquoi | 732 | 630 | +16.2% | 100.94 | 7.3 |
| Bonaventure | Town | Bonaventure | 2,733 | 2,706 | +1.0% | 104.5 | 26.2 |
| Bonne-Espérance | Municipality | Le Golfe-du-Saint-Laurent | 692 | 681 | +1.6% | 622.99 | 1.1 |
| Bonsecours | Municipality | Le Val-Saint-François | 650 | 608 | +6.9% | 60.36 | 10.8 |
| Boucherville | Town | Longueuil | 41,743 | 41,671 | +0.2% | 71.02 | 587.8 |
| Bouchette | Municipality | La Vallée-de-la-Gatineau | 695 | 731 | −4.9% | 122.09 | 5.7 |
| Bowman | Municipality | Papineau | 667 | 658 | +1.4% | 126.4 | 5.3 |
| Brébeuf | Parish | Les Laurentides | 1,009 | 976 | +3.4% | 35.78 | 28.2 |
| Brigham | Municipality | Brome-Missisquoi | 2,282 | 2,306 | −1.0% | 86.92 | 26.3 |
| Bristol | Municipality | Pontiac | 1,199 | 1,036 | +15.7% | 206.19 | 5.8 |
| Brome | Village | Brome-Missisquoi | 341 | 296 | +15.2% | 11.56 | 29.5 |
| Bromont | Town | Brome-Missisquoi | 11,357 | 9,041 | +25.6% | 114.05 | 99.6 |
| Brossard | Town | Longueuil | 91,525 | 85,721 | +6.8% | 45.19 | 2,025.3 |
| Brownsburg-Chatham | Town | Argenteuil | 7,247 | 7,122 | +1.8% | 244.46 | 29.6 |
| Bryson | Municipality | Pontiac | 646 | 697 | −7.3% | 3.58 | 180.4 |
| Bury | Municipality | Le Haut-Saint-François | 1,252 | 1,174 | +6.6% | 234.13 | 5.3 |
| Cacouna | Municipality | Rivière-du-Loup | 1,848 | 1,803 | +2.5% | 62.75 | 29.5 |
| Calixa-Lavallée | Municipality | Marguerite-D'Youville | 509 | 523 | −2.7% | 32.20 | 15.8 |
| Campbell's Bay | Municipality | Pontiac | 705 | 744 | −5.2% | 3.42 | 206.1 |
| Candiac | Town | Roussillon | 22,997 | 21,047 | +9.3% | 17.27 | 1,331.6 |
| Cantley | Municipality | Les Collines-de-l'Outaouais | 11,449 | 10,699 | +7.0% | 126.12 | 90.8 |
| Cap-Chat | Town | La Haute-Gaspésie | 2,516 | 2,476 | +1.6% | 181.31 | 13.9 |
| Cap-Saint-Ignace | Municipality | Montmagny | 3,099 | 3,089 | +0.3% | 204.32 | 15.2 |
| Cap-Santé | Town | Portneuf | 3,594 | 3,410 | +5.4% | 54.49 | 66.0 |
| Caplan | Municipality | Bonaventure | 1,966 | 2,024 | −2.9% | 85.69 | 22.9 |
| Carignan | Town | La Vallée-du-Richelieu | 11,740 | 9,462 | +24.1% | 62.07 | 189.1 |
| Carleton-sur-Mer | Town | Avignon | 4,081 | 4,073 | +0.2% | 221.48 | 18.4 |
| Cascapédia--Saint-Jules | Municipality | Bonaventure | 764 | 730 | +4.7% | 164.29 | 4.7 |
| Causapscal | Town | La Matapédia | 2,147 | 2,304 | −6.8% | 161.61 | 13.3 |
| Cayamant | Municipality | La Vallée-de-la-Gatineau | 895 | 821 | +9.0% | 382.49 | 2.3 |
| Chambly | Town | La Vallée-du-Richelieu | 31,444 | 29,120 | +8.0% | 25.08 | 1,253.7 |
| Chambord | Municipality | Le Domaine-du-Roy | 1,748 | 1,765 | −1.0% | 120.85 | 14.5 |
| Champlain | Municipality | Les Chenaux | 1,807 | 1,735 | +4.1% | 58.17 | 31.1 |
| Champneuf | Municipality | Abitibi | 94 | 123 | −23.6% | 241.32 | 0.4 |
| Chandler | Town | Le Rocher-Percé | 7,490 | 7,546 | −0.7% | 418.45 | 17.9 |
| Chapais | Town | Jamésie | 1,468 | 1,499 | −2.1% | 62.31 | 23.6 |
| Charette | Municipality | Maskinongé | 1,034 | 953 | +8.5% | 41.90 | 24.7 |
| Charlemagne | Town | L'Assomption | 6,302 | 5,913 | +6.6% | 2.17 | 2,904.1 |
| Chartierville | Municipality | Le Haut-Saint-François | 319 | 276 | +15.6% | 141.94 | 2.2 |
| Château-Richer | Town | La Côte-de-Beaupré | 4,425 | 4,126 | +7.2% | 228.84 | 19.3 |
| Châteauguay | Town | Roussillon | 50,815 | 47,906 | +6.1% | 34.31 | 1,481.1 |
| Chazel | Municipality | Abitibi-Ouest | 254 | 289 | −12.1% | 133.55 | 1.9 |
| Chelsea | Municipality | Les Collines-de-l'Outaouais | 8,000 | 6,909 | +15.8% | 112.65 | 71.0 |
| Chénéville | Municipality | Papineau | 848 | 764 | +11.0% | 65.83 | 12.9 |
| Chertsey | Municipality | Matawinie | 5,295 | 4,696 | +12.8% | 286.05 | 18.5 |
| Chesterville | Municipality | Arthabaska | 877 | 922 | −4.9% | 116.72 | 7.5 |
| Chibougamau | Town | Jamésie | 7,233 | 7,504 | −3.6% | 694.87 | 10.4 |
| Chichester | Township | Pontiac | 350 | 348 | +0.6% | 218.74 | 1.6 |
| Chisasibi | Cree village | Nord-du-Québec | 0 | 0 | NA | 480.29 | 0.0 |
| Chute-aux-Outardes | Village | Manicouagan | 1,391 | 1,563 | −11.0% | 7.51 | 185.2 |
| Chute-Saint-Philippe | Municipality | Antoine-Labelle | 1,039 | 942 | +10.3% | 298.64 | 3.5 |
| Clarenceville | Municipality | Le Haut-Richelieu | 1,154 | 1,103 | +4.6% | 63.06 | 18.3 |
| Clarendon | Municipality | Pontiac | 1,392 | 1,256 | +10.8% | 330.46 | 4.2 |
| Clermont | Township | Abitibi-Ouest | 484 | 492 | −1.6% | 156.66 | 3.1 |
| Clermont | Town | Charlevoix-Est | 3,065 | 3,085 | −0.6% | 51.53 | 59.5 |
| Clerval | Municipality | Abitibi-Ouest | 373 | 371 | +0.5% | 99.17 | 3.8 |
| Cleveland | Township | Le Val-Saint-François | 1,581 | 1,541 | +2.6% | 123.59 | 12.8 |
| Cloridorme | Township | La Côte-de-Gaspé | 607 | 671 | −9.5% | 158.74 | 3.8 |
| Coaticook | Town | Coaticook | 8,867 | 8,955 | −1.0% | 219.45 | 40.4 |
| Colombier | Municipality | La Haute-Côte-Nord | 635 | 685 | −7.3% | 361.23 | 1.8 |
| Compton | Municipality | Coaticook | 3,270 | 3,131 | +4.4% | 206.58 | 15.8 |
| Contrecoeur | Town | Marguerite-D'Youville | 9,480 | 7,887 | +20.2% | 62.2 | 152.4 |
| Cookshire-Eaton | Town | Le Haut-Saint-François | 5,344 | 5,393 | −0.9% | 296.25 | 18.0 |
| Côte-Nord-du-Golfe-du-Saint-Laurent | Municipality | Le Golfe-du-Saint-Laurent | 787 | 856 | −8.1% | 2,597.05 | 0.3 |
| Côte-Saint-Luc | Town | Montréal | 34,504 | 32,448 | +6.3% | 7.04 | 4,901.1 |
| Coteau-du-Lac | Town | Vaudreuil-Soulanges | 7,473 | 7,044 | +6.1% | 46.87 | 159.4 |
| Courcelles | Municipality | Le Granit | 814 | 823 | −1.1% | 90.34 | 9.0 |
| Cowansville | Town | Brome-Missisquoi | 15,234 | 13,656 | +11.6% | 46.87 | 325.0 |
| Crabtree | Municipality | Joliette | 4,155 | 3,958 | +5.0% | 25.06 | 165.8 |
| Danville | Town | Les Sources | 3,888 | 3,826 | +1.6% | 151.73 | 25.6 |
| Daveluyville | Town | Arthabaska | 2,360 | 2,255 | +4.7% | 61.71 | 38.2 |
| Dégelis | Town | Témiscouata | 2,884 | 2,863 | +0.7% | 556.78 | 5.2 |
| Déléage | Municipality | La Vallée-de-la-Gatineau | 1,916 | 1,852 | +3.5% | 248.26 | 7.7 |
| Delson | Town | Roussillon | 8,328 | 7,457 | +11.7% | 7.64 | 1,090.1 |
| Denholm | Municipality | La Vallée-de-la-Gatineau | 546 | 505 | +8.1% | 177.33 | 3.1 |
| Desbiens | Town | Lac-Saint-Jean-Est | 995 | 1,028 | −3.2% | 10.39 | 95.8 |
| Deschaillons-sur-Saint-Laurent | Municipality | Bécancour | 906 | 909 | −0.3% | 36.51 | 24.8 |
| Deschambault-Grondines | Municipality | Portneuf | 2,235 | 2,220 | +0.7% | 124.02 | 18.0 |
| Deux-Montagnes | Town | Deux-Montagnes | 17,915 | 17,496 | +2.4% | 6.08 | 2,946.5 |
| Disraeli | Parish | Les Appalaches | 1,163 | 1,123 | +3.6% | 92.53 | 12.6 |
| Disraeli | Town | Les Appalaches | 2,360 | 2,336 | +1.0% | 6.80 | 347.1 |
| Dixville | Municipality | Coaticook | 732 | 696 | +5.2% | 76.56 | 9.6 |
| Dolbeau-Mistassini | Town | Maria-Chapdelaine | 13,718 | 14,212 | −3.5% | 293.43 | 46.8 |
| Dollard-des-Ormeaux | Town | Montréal | 48,403 | 48,899 | −1.0% | 14.98 | 3,231.2 |
| Donnacona | Town | Portneuf | 7,436 | 7,200 | +3.3% | 20.20 | 368.1 |
| Dorval | Town | Montréal | 19,302 | 18,980 | +1.7% | 20.91 | 923.1 |
| Dosquet | Municipality | Lotbinière | 935 | 944 | −1.0% | 65.07 | 14.4 |
| Drummondville | Town | Drummond | 79,258 | 75,423 | +5.1% | 247.11 | 320.7 |
| Dudswell | Municipality | Le Haut-Saint-François | 1,755 | 1,727 | +1.6% | 218.01 | 8.1 |
| Duhamel | Municipality | Papineau | 569 | 430 | +32.3% | 427.32 | 1.3 |
| Duhamel-Ouest | Municipality | Témiscamingue | 945 | 878 | +7.6% | 91.49 | 10.3 |
| Dundee | Township | Le Haut-Saint-Laurent | 386 | 387 | −0.3% | 68.41 | 5.6 |
| Dunham | Town | Brome-Missisquoi | 3,599 | 3,432 | +4.9% | 193.86 | 18.6 |
| Duparquet | Town | Abitibi-Ouest | 716 | 666 | +7.5% | 121.17 | 5.9 |
| Dupuy | Municipality | Abitibi-Ouest | 940 | 931 | +1.0% | 122.43 | 7.7 |
| Durham-Sud | Municipality | Drummond | 1,051 | 1,043 | +0.8% | 92.64 | 11.3 |
| East Angus | Town | Le Haut-Saint-François | 3,840 | 3,659 | +4.9% | 7.84 | 489.8 |
| East Broughton | Municipality | Les Appalaches | 2,248 | 2,199 | +2.2% | 8.86 | 253.7 |
| East Farnham | Municipality | Brome-Missisquoi | 612 | 554 | +10.5% | 5.02 | 121.9 |
| East Hereford | Municipality | Coaticook | 282 | 269 | +4.8% | 72.1 | 3.9 |
| Eastman | Municipality | Memphrémagog | 2,279 | 1,843 | +23.7% | 73.57 | 31.0 |
| Eastmain | Cree village | Nord-du-Québec | 0 | 0 | NA | 317.72 | 0.0 |
| Eeyou Istchee Baie-James | Municipality | Jamésie | 2,638 | 1,579 | +67.1% | 283,123.42 | 0.0 |
| Egan-Sud | Municipality | La Vallée-de-la-Gatineau | 508 | 504 | +0.8% | 49.82 | 10.2 |
| Elgin | Municipality | Le Haut-Saint-Laurent | 389 | 394 | −1.3% | 69.35 | 5.6 |
| Entrelacs | Municipality | Matawinie | 1,054 | 928 | +13.6% | 48.71 | 21.6 |
| Escuminac | Municipality | Avignon | 575 | 544 | +5.7% | 108.7 | 5.3 |
| Esprit-Saint | Municipality | Rimouski-Neigette | 340 | 341 | −0.3% | 168.96 | 2.0 |
| Estérel | Town | Les Pays-d'en-Haut | 262 | 196 | +33.7% | 12.62 | 20.8 |
| Farnham | Town | Brome-Missisquoi | 10,149 | 8,909 | +13.9% | 92.12 | 110.2 |
| Fassett | Municipality | Papineau | 453 | 431 | +5.1% | 12.52 | 36.2 |
| Ferland-et-Boilleau | Municipality | Le Fjord-du-Saguenay | 632 | 540 | +17.0% | 383.09 | 1.6 |
| Ferme-Neuve | Municipality | Antoine-Labelle | 2,716 | 2,706 | +0.4% | 786.19 | 3.5 |
| Fermont | Town | Caniapiscau | 2,256 | 2,474 | −8.8% | 451.12 | 5.0 |
| Forestville | Town | La Haute-Côte-Nord | 2,892 | 3,081 | −6.1% | 192.61 | 15.0 |
| Fort-Coulonge | Village | Pontiac | 1,312 | 1,433 | −8.4% | 2.96 | 443.2 |
| Fortierville | Municipality | Bécancour | 660 | 669 | −1.3% | 44.55 | 14.8 |
| Fossambault-sur-le-Lac | Town | La Jacques-Cartier | 2,327 | 1,960 | +18.7% | 11.49 | 202.5 |
| Frampton | Municipality | La Nouvelle-Beauce | 1,309 | 1,297 | +0.9% | 151.27 | 8.7 |
| Franklin | Municipality | Le Haut-Saint-Laurent | 1,635 | 1,636 | −0.1% | 112.33 | 14.6 |
| Franquelin | Municipality | Manicouagan | 285 | 313 | −8.9% | 436.55 | 0.7 |
| Frelighsburg | Municipality | Brome-Missisquoi | 1,123 | 1,111 | +1.1% | 123.31 | 9.1 |
| Frontenac | Municipality | Le Granit | 1,811 | 1,734 | +4.4% | 223.6 | 8.1 |
| Fugèreville | Municipality | Témiscamingue | 326 | 326 | 0.0% | 157.12 | 2.1 |
| Gallichan | Municipality | Abitibi-Ouest | 488 | 468 | +4.3% | 73.61 | 6.6 |
| Gaspé | Town | La Côte-de-Gaspé | 15,063 | 14,568 | +3.4% | 1,118.77 | 13.5 |
| Gatineau | Town | Gatineau | 291,041 | 276,245 | +5.4% | 341.84 | 851.4 |
| Girardville | Municipality | Maria-Chapdelaine | 1,018 | 988 | +3.0% | 124.11 | 8.2 |
| Godbout | Village | Manicouagan | 272 | 265 | +2.6% | 159.18 | 1.7 |
| Godmanchester | Township | Le Haut-Saint-Laurent | 1,403 | 1,394 | +0.6% | 138.66 | 10.1 |
| Gore | Township | Argenteuil | 2,283 | 1,904 | +19.9% | 90.04 | 25.4 |
| Gracefield | Town | La Vallée-de-la-Gatineau | 2,376 | 2,462 | −3.5% | 380.94 | 6.2 |
| Granby | Town | La Haute-Yamaska | 69,025 | 66,222 | +4.2% | 152.69 | 452.1 |
| Grand-Métis | Municipality | La Mitis | 218 | 213 | +2.3% | 25.12 | 8.7 |
| Grand-Remous | Municipality | La Vallée-de-la-Gatineau | 1,159 | 1,161 | −0.2% | 351.63 | 3.3 |
| Grand-Saint-Esprit | Municipality | Nicolet-Yamaska | 488 | 476 | +2.5% | 27.22 | 17.9 |
| Grande-Rivière | Town | Le Rocher-Percé | 3,384 | 3,408 | −0.7% | 87.92 | 38.5 |
| Grande-Vallée | Municipality | La Côte-de-Gaspé | 1,077 | 1,057 | +1.9% | 144.16 | 7.5 |
| Grandes-Piles | Village | Mékinac | 493 | 415 | +18.8% | 116.97 | 4.2 |
| Grenville | Village | Argenteuil | 1,816 | 1,711 | +6.1% | 2.82 | 644.0 |
| Grenville-sur-la-Rouge | Municipality | Argenteuil | 2,883 | 2,824 | +2.1% | 313.61 | 9.2 |
| Gros-Mécatina | Municipality | Le Golfe-du-Saint-Laurent | 356 | 451 | −21.1% | 742.15 | 0.5 |
| Grosse-Île | Municipality | Les Îles-de-la-Madeleine | 464 | 465 | −0.2% | 32.28 | 14.4 |
| Grosses-Roches | Municipality | La Matanie | 375 | 394 | −4.8% | 63.59 | 5.9 |
| Guérin | Township | Témiscamingue | 333 | 320 | +4.1% | 188.52 | 1.8 |
| Ham-Nord | Township | Arthabaska | 857 | 869 | −1.4% | 103.98 | 8.2 |
| Ham-Sud | Municipality | Les Sources | 214 | 235 | −8.9% | 151.21 | 1.4 |
| Hampden | Township | Le Haut-Saint-François | 193 | 176 | +9.7% | 111.68 | 1.7 |
| Hampstead | Town | Montréal | 7,037 | 6,973 | +0.9% | 1.79 | 3,931.3 |
| Harrington | Township | Argenteuil | 967 | 846 | +14.3% | 233.65 | 4.1 |
| Hatley | Municipality | Memphrémagog | 771 | 685 | +12.6% | 60.43 | 12.8 |
| Hatley | Township | Memphrémagog | 2,230 | 2,106 | +5.9% | 71.6 | 31.1 |
| Havelock | Township | Le Haut-Saint-Laurent | 756 | 740 | +2.2% | 88.7 | 8.5 |
| Havre-Saint-Pierre | Municipality | Minganie | 3,337 | 3,460 | −3.6% | 2,570.09 | 1.3 |
| Hébertville | Municipality | Lac-Saint-Jean-Est | 2,500 | 2,542 | −1.7% | 260.74 | 9.6 |
| Hébertville-Station | Village | Lac-Saint-Jean-Est | 1,229 | 1,311 | −6.3% | 31.50 | 39.0 |
| Hemmingford | Township | Les Jardins-de-Napierville | 1,995 | 1,900 | +5.0% | 157.22 | 12.7 |
| Hemmingford | Village | Les Jardins-de-Napierville | 829 | 755 | +9.8% | 1.07 | 774.8 |
| Henryville | Municipality | Le Haut-Richelieu | 1,497 | 1,406 | +6.5% | 64.82 | 23.1 |
| Hérouxville | Parish | Mékinac | 1,367 | 1,278 | +7.0% | 54.72 | 25.0 |
| Hinchinbrooke | Municipality | Le Haut-Saint-Laurent | 2,187 | 2,103 | +4.0% | 148.36 | 14.7 |
| Honfleur | Municipality | Bellechasse | 881 | 849 | +3.8% | 50.67 | 17.4 |
| Hope | Township | Bonaventure | 584 | 568 | +2.8% | 70.55 | 8.3 |
| Hope Town | Municipality | Bonaventure | 334 | 339 | −1.5% | 51.26 | 6.5 |
| Howick | Municipality | Le Haut-Saint-Laurent | 850 | 778 | +9.3% | 0.96 | 885.4 |
| Huberdeau | Municipality | Les Laurentides | 863 | 868 | −0.6% | 56.72 | 15.2 |
| Hudson | Town | Vaudreuil-Soulanges | 5,411 | 5,157 | +4.9% | 21.79 | 248.3 |
| Huntingdon | Town | Le Haut-Saint-Laurent | 2,556 | 2,444 | +4.6% | 2.77 | 922.7 |
| Inukjuak | Northern village | Nord-du-Québec | 1,821 | 1,757 | +3.6% | 54.92 | 33.2 |
| Ivujivik | Northern village | Nord-du-Québec | 412 | 414 | −0.5% | 35.15 | 11.7 |
| Inverness | Municipality | L'Érable | 910 | 899 | +1.2% | 176.11 | 5.2 |
| Irlande | Municipality | Les Appalaches | 897 | 884 | +1.5% | 109.85 | 8.2 |
| Ivry-sur-le-Lac | Municipality | Les Laurentides | 391 | 387 | +1.0% | 29.30 | 13.3 |
| Joliette | Town | Joliette | 21,384 | 20,484 | +4.4% | 22.96 | 931.4 |
| Kamouraska | Municipality | Kamouraska | 607 | 616 | −1.5% | 44.07 | 13.8 |
| Kangiqsualujjuaq | Northern village | Nord-du-Québec | 956 | 942 | +1.5% | 34.33 | 27.8 |
| Kangiqsujuaq | Northern village | Nord-du-Québec | 837 | 750 | +11.6% | 12.41 | 67.4 |
| Kangirsuk | Northern village | Nord-du-Québec | 561 | 567 | −1.1% | 57.15 | 9.8 |
| Kawawachikamach | Naskapi village | Nord-du-Québec | 0 | 0 | NA | 234.8 | 0.0 |
| Kazabazua | Municipality | La Vallée-de-la-Gatineau | 1,037 | 945 | +9.7% | 172.91 | 6.0 |
| Kiamika | Municipality | Antoine-Labelle | 790 | 757 | +4.4% | 337.53 | 2.3 |
| Kingsbury | Village | Le Val-Saint-François | 142 | 138 | +2.9% | 6.11 | 23.2 |
| Kingsey Falls | Town | Arthabaska | 1,986 | 1,947 | +2.0% | 69.36 | 28.6 |
| Kinnear's Mills | Municipality | Les Appalaches | 397 | 350 | +13.4% | 93.66 | 4.2 |
| Kipawa | Municipality | Témiscamingue | 446 | 499 | −10.6% | 35.58 | 12.5 |
| Kirkland | Town | Montréal | 19,413 | 20,151 | −3.7% | 9.65 | 2,011.7 |
| Kuujjuaq | Northern village | Nord-du-Québec | 2,668 | 2,754 | −3.1% | 289.97 | 9.2 |
| Kuujjuarapik | Northern village | Nord-du-Québec | 792 | 792 | 0.0% | 7.45 | 106.3 |
| L'Ancienne-Lorette | Town | Québec | 16,970 | 16,543 | +2.6% | 7.72 | 2,198.2 |
| L'Ange-Gardien | Municipality | Les Collines-de-l'Outaouais | 6,102 | 5,464 | +11.7% | 216.05 | 28.2 |
| L'Ange-Gardien | Municipality | La Côte-de-Beaupré | 3,842 | 3,695 | +4.0% | 53.61 | 71.7 |
| L'Anse-Saint-Jean | Municipality | Le Fjord-du-Saguenay | 1,301 | 1,201 | +8.3% | 501.79 | 2.6 |
| L'Ascension | Municipality | Antoine-Labelle | 899 | 791 | +13.7% | 334.82 | 2.7 |
| L'Ascension-de-Notre-Seigneur | Parish | Lac-Saint-Jean-Est | 2,079 | 1,987 | +4.6% | 130.84 | 15.9 |
| L'Ascension-de-Patapédia | Municipality | Avignon | 148 | 164 | −9.8% | 95.98 | 1.5 |
| L'Assomption | Town | L'Assomption | 23,442 | 22,429 | +4.5% | 98.74 | 237.4 |
| L'Avenir | Municipality | Drummond | 1,350 | 1,307 | +3.3% | 97.59 | 13.8 |
| L'Épiphanie | Town | L'Assomption | 8,883 | 8,693 | +2.2% | 56.57 | 157.0 |
| L'Île-Cadieux | Town | Vaudreuil-Soulanges | 120 | 126 | −4.8% | 0.59 | 203.4 |
| L'Île-d'Anticosti | Municipality | Minganie | 177 | 218 | −18.8% | 7,715.99 | 0.0 |
| L'Île-Dorval | Town | Montréal | 30 | 5 | +500.0% | 0.19 | 157.9 |
| L'Île-du-Grand-Calumet | Municipality | Pontiac | 648 | 626 | +3.5% | 130.55 | 5.0 |
| L'Île-Perrot | Town | Vaudreuil-Soulanges | 11,638 | 10,756 | +8.2% | 5.46 | 2,131.5 |
| L'Isle-aux-Allumettes | Municipality | Pontiac | 1,382 | 1,334 | +3.6% | 185.94 | 7.4 |
| L'Isle-aux-Coudres | Municipality | Charlevoix | 1,116 | 1,143 | −2.4% | 29.46 | 37.9 |
| L'Isle-Verte | Municipality | Rivière-du-Loup | 1,356 | 1,294 | +4.8% | 119.15 | 11.4 |
| L'Islet | Municipality | L'Islet | 3,803 | 3,827 | −0.6% | 119.95 | 31.7 |
| La Bostonnais | Municipality | La Tuque | 556 | 635 | −12.4% | 284.32 | 2.0 |
| La Conception | Municipality | Les Laurentides | 1,527 | 1,337 | +14.2% | 127.37 | 12.0 |
| La Corne | Municipality | Abitibi | 778 | 719 | +8.2% | 308.13 | 2.5 |
| La Doré | Parish | Le Domaine-du-Roy | 1,359 | 1,365 | −0.4% | 288.55 | 4.7 |
| La Durantaye | Parish | Bellechasse | 782 | 755 | +3.6% | 34.99 | 22.3 |
| La Guadeloupe | Village | Beauce-Sartigan | 1,805 | 1,707 | +5.7% | 32.84 | 55.0 |
| La Macaza | Municipality | Antoine-Labelle | 1,094 | 1,150 | −4.9% | 161.42 | 6.8 |
| La Malbaie | Town | Charlevoix-Est | 8,235 | 8,271 | −0.4% | 458.19 | 18.0 |
| La Martre | Municipality | La Haute-Gaspésie | 194 | 243 | −20.2% | 175.23 | 1.1 |
| La Minerve | Municipality | Les Laurentides | 1,421 | 1,205 | +17.9% | 274.92 | 5.2 |
| La Morandière-Rochebaucourt | Municipality | Abitibi | 351 | 338 | +3.8% | 590.98 | 0.6 |
| La Motte | Municipality | Abitibi | 478 | 453 | +5.5% | 175.48 | 2.7 |
| La Patrie | Municipality | Le Haut-Saint-François | 805 | 768 | +4.8% | 204.61 | 3.9 |
| La Pêche | Municipality | Les Collines-de-l'Outaouais | 8,636 | 7,863 | +9.8% | 577.18 | 15.0 |
| La Pocatière | Town | Kamouraska | 4,078 | 4,120 | −1.0% | 21.18 | 192.5 |
| La Prairie | Town | Roussillon | 26,406 | 24,110 | +9.5% | 43.47 | 607.5 |
| La Présentation | Municipality | Les Maskoutains | 2,638 | 2,540 | +3.9% | 94.39 | 27.9 |
| La Rédemption | Parish | La Mitis | 384 | 432 | −11.1% | 116.63 | 3.3 |
| La Reine | Municipality | Abitibi-Ouest | 307 | 339 | −9.4% | 97.63 | 3.1 |
| La Sarre | Town | Abitibi-Ouest | 7,358 | 7,282 | +1.0% | 148.36 | 49.6 |
| La Trinité-des-Monts | Parish | Rimouski-Neigette | 233 | 223 | +4.5% | 233.07 | 1.0 |
| La Tuque | Town | La Tuque | 11,129 | 11,001 | +1.2% | 24,809.4 | 0.4 |
| La Visitation-de-l'Île-Dupas | Municipality | D'Autray | 684 | 626 | +9.3% | 28.15 | 24.3 |
| La Visitation-de-Yamaska | Municipality | Nicolet-Yamaska | 295 | 327 | −9.8% | 42.65 | 6.9 |
| Labelle | Municipality | Les Laurentides | 2,765 | 2,477 | +11.6% | 196.69 | 14.1 |
| Labrecque | Municipality | Lac-Saint-Jean-Est | 1,328 | 1,321 | +0.5% | 152.67 | 8.7 |
| Lac-au-Saumon | Municipality | La Matapédia | 1,488 | 1,450 | +2.6% | 81.05 | 18.4 |
| Lac-aux-Sables | Parish | Mékinac | 1,380 | 1,292 | +6.8% | 269.7 | 5.1 |
| Lac-Beauport | Municipality | La Jacques-Cartier | 8,164 | 7,801 | +4.7% | 61.73 | 132.3 |
| Lac-Bouchette | Municipality | Le Domaine-du-Roy | 1,183 | 1,196 | −1.1% | 904.26 | 1.3 |
| Lac-Brome | Town | Brome-Missisquoi | 5,923 | 5,495 | +7.8% | 206.9 | 28.6 |
| Lac-Delage | Town | La Jacques-Cartier | 771 | 638 | +20.8% | 1.58 | 488.0 |
| Lac-des-Aigles | Municipality | Témiscouata | 495 | 512 | −3.3% | 86.63 | 5.7 |
| Lac-des-Écorces | Municipality | Antoine-Labelle | 2,885 | 2,734 | +5.5% | 144.3 | 20.0 |
| Lac-des-Plages | Municipality | Papineau | 548 | 431 | +27.1% | 150.95 | 3.6 |
| Lac-des-Seize-Îles | Municipality | Les Pays-d'en-Haut | 175 | 192 | −8.9% | 8.88 | 19.7 |
| Lac-Drolet | Municipality | Le Granit | 1,067 | 1,021 | +4.5% | 124.3 | 8.6 |
| Lac-du-Cerf | Municipality | Antoine-Labelle | 445 | 435 | +2.3% | 71.73 | 6.2 |
| Lac-Édouard | Municipality | La Tuque | 220 | 191 | +15.2% | 898.32 | 0.2 |
| Lac-Etchemin | Municipality | Les Etchemins | 4,028 | 3,822 | +5.4% | 157.22 | 25.6 |
| Lac-Frontière | Municipality | Montmagny | 175 | 184 | −4.9% | 49.96 | 3.5 |
| Lac-Mégantic | Town | Le Granit | 5,747 | 5,654 | +1.6% | 21.98 | 261.5 |
| Lac-Poulin | Village | Beauce-Sartigan | 171 | 147 | +16.3% | 0.88 | 194.3 |
| Lac-Saguay | Village | Antoine-Labelle | 526 | 459 | +14.6% | 171.88 | 3.1 |
| Lac-Saint-Joseph | Town | La Jacques-Cartier | 304 | 260 | +16.9% | 33.65 | 9.0 |
| Lac-Saint-Paul | Municipality | Antoine-Labelle | 525 | 481 | +9.1% | 170.72 | 3.1 |
| Lac-Sainte-Marie | Municipality | La Vallée-de-la-Gatineau | 677 | 566 | +19.6% | 205.71 | 3.3 |
| Lac-Sergent | Town | Portneuf | 541 | 497 | +8.9% | 3.72 | 145.4 |
| Lac-Simon | Municipality | Papineau | 1,057 | 944 | +12.0% | 95.65 | 11.1 |
| Lac-Supérieur | Municipality | Les Laurentides | 1,972 | 1,888 | +4.4% | 365.98 | 5.4 |
| Lac-Tremblant-Nord | Municipality | Les Laurentides | 60 | 42 | +42.9% | 20.62 | 2.9 |
| Lachute | Town | Argenteuil | 14,100 | 12,862 | +9.6% | 108.66 | 129.8 |
| Lacolle | Municipality | Le Haut-Richelieu | 2,708 | 2,596 | +4.3% | 49.41 | 54.8 |
| Laforce | Municipality | Témiscamingue | 320 | 231 | +38.5% | 436.78 | 0.7 |
| Lamarche | Municipality | Lac-Saint-Jean-Est | 476 | 514 | −7.4% | 81.45 | 5.8 |
| Lambton | Municipality | Le Granit | 1,630 | 1,617 | +0.8% | 108.45 | 15.0 |
| Landrienne | Township | Abitibi | 897 | 967 | −7.2% | 275.93 | 3.3 |
| Lanoraie | Municipality | D'Autray | 5,134 | 4,787 | +7.2% | 102.74 | 50.0 |
| Lantier | Municipality | Les Laurentides | 891 | 834 | +6.8% | 48.19 | 18.5 |
| Larouche | Municipality | Le Fjord-du-Saguenay | 1,601 | 1,486 | +7.7% | 84.71 | 18.9 |
| Latulipe-et-Gaboury | United township | Témiscamingue | 320 | 295 | +8.5% | 270.11 | 1.2 |
| Launay | Township | Abitibi | 211 | 218 | −3.2% | 257.8 | 0.8 |
| Laurier-Station | Village | Lotbinière | 2,570 | 2,573 | −0.1% | 12.16 | 211.3 |
| Laurierville | Municipality | L'Érable | 1,313 | 1,346 | −2.5% | 107.91 | 12.2 |
| Laval | Town | Laval | 438,366 | 422,993 | +3.6% | 246.13 | 1,781.0 |
| Lavaltrie | Town | D'Autray | 14,425 | 13,657 | +5.6% | 68.22 | 211.4 |
| Laverlochère-Angliers | Municipality | Témiscamingue | 947 | 978 | −3.2% | 400.83 | 2.4 |
| Lawrenceville | Village | Le Val-Saint-François | 618 | 635 | −2.7% | 16.73 | 36.9 |
| Lebel-sur-Quévillon | Town | Jamésie | 2,091 | 2,187 | −4.4% | 44.41 | 47.1 |
| Leclercville | Municipality | Lotbinière | 491 | 473 | +3.8% | 136.61 | 3.6 |
| Lefebvre | Municipality | Drummond | 925 | 904 | +2.3% | 66.18 | 14.0 |
| Lejeune | Municipality | Témiscouata | 246 | 262 | −6.1% | 270.13 | 0.9 |
| Lemieux | Municipality | Bécancour | 292 | 301 | −3.0% | 74.6 | 3.9 |
| Léry | Town | Roussillon | 2,390 | 2,318 | +3.1% | 10.36 | 230.7 |
| Les Bergeronnes | Municipality | La Haute-Côte-Nord | 619 | 661 | −6.4% | 268.77 | 2.3 |
| Les Cèdres | Municipality | Vaudreuil-Soulanges | 7,184 | 6,777 | +6.0% | 77.63 | 92.5 |
| Les Coteaux | Municipality | Vaudreuil-Soulanges | 5,643 | 5,368 | +5.1% | 11.64 | 484.8 |
| Les Éboulements | Municipality | Charlevoix | 1,465 | 1,331 | +10.1% | 156.19 | 9.4 |
| Les Escoumins | Municipality | La Haute-Côte-Nord | 1,794 | 1,891 | −5.1% | 265.89 | 6.7 |
| Les Hauteurs | Municipality | La Mitis | 485 | 504 | −3.8% | 102.92 | 4.7 |
| Les Îles-de-la-Madeleine | Municipality | Les Îles-de-la-Madeleine | 12,190 | 12,010 | +1.5% | 155.06 | 78.6 |
| Les Méchins | Municipality | La Matanie | 995 | 987 | +0.8% | 441.39 | 2.3 |
| Lévis | Town | Lévis | 149,683 | 143,414 | +4.4% | 448.07 | 334.1 |
| Lingwick | Township | Le Haut-Saint-François | 456 | 428 | +6.5% | 243.01 | 1.9 |
| Litchfield | Municipality | Pontiac | 500 | 459 | +8.9% | 198.57 | 2.5 |
| Lochaber | Township | Papineau | 446 | 415 | +7.5% | 62.14 | 7.2 |
| Lochaber-Partie-Ouest | Township | Papineau | 926 | 856 | +8.2% | 57.39 | 16.1 |
| Longue-Pointe-de-Mingan | Municipality | Minganie | 408 | 434 | −6.0% | 370.03 | 1.1 |
| Longue-Rive | Municipality | La Haute-Côte-Nord | 918 | 1,026 | −10.5% | 308.06 | 3.0 |
| Longueuil | Town | Longueuil | 254,483 | 239,897 | +6.1% | 115.77 | 2,198.2 |
| Lorraine | Town | Thérèse-De Blainville | 9,502 | 9,352 | +1.6% | 5.90 | 1,610.5 |
| Lorrainville | Municipality | Témiscamingue | 1,286 | 1,272 | +1.1% | 87.91 | 14.6 |
| Lotbinière | Municipality | Lotbinière | 855 | 812 | +5.3% | 79.91 | 10.7 |
| Louiseville | Town | Maskinongé | 7,340 | 7,152 | +2.6% | 62.59 | 117.3 |
| Low | Township | La Vallée-de-la-Gatineau | 1,020 | 982 | +3.9% | 257.78 | 4.0 |
| Lyster | Municipality | L'Érable | 1,587 | 1,605 | −1.1% | 167.55 | 9.5 |
| Macamic | Town | Abitibi-Ouest | 2,744 | 2,751 | −0.3% | 202.05 | 13.6 |
| Maddington Falls | Municipality | Arthabaska | 428 | 413 | +3.6% | 23.82 | 18.0 |
| Magog | Town | Memphrémagog | 28,312 | 26,669 | +6.2% | 144.26 | 196.3 |
| Malartic | Town | La Vallée-de-l'Or | 3,355 | 3,377 | −0.7% | 147.45 | 22.8 |
| Mandeville | Municipality | D'Autray | 2,363 | 2,189 | +7.9% | 318.21 | 7.4 |
| Maniwaki | Town | La Vallée-de-la-Gatineau | 3,757 | 3,843 | −2.2% | 5.67 | 662.6 |
| Manseau | Municipality | Bécancour | 807 | 816 | −1.1% | 104.48 | 7.7 |
| Mansfield-et-Pontefract | Municipality | Pontiac | 2,250 | 2,285 | −1.5% | 466.61 | 4.8 |
| Maria | Municipality | Avignon | 2,760 | 2,615 | +5.5% | 94.88 | 29.1 |
| Maricourt | Municipality | Le Val-Saint-François | 456 | 416 | +9.6% | 61.1 | 7.5 |
| Marieville | Town | Rouville | 11,332 | 10,725 | +5.7% | 63.23 | 179.2 |
| Marsoui | Village | La Haute-Gaspésie | 289 | 275 | +5.1% | 181.4 | 1.6 |
| Marston | Township | Le Granit | 777 | 705 | +10.2% | 71.83 | 10.8 |
| Martinville | Municipality | Coaticook | 441 | 436 | +1.1% | 47.66 | 9.3 |
| Mascouche | Town | Les Moulins | 51,183 | 46,692 | +9.6% | 106.89 | 478.8 |
| Maskinongé | Municipality | Maskinongé | 2,323 | 2,319 | +0.2% | 73.31 | 31.7 |
| Massueville | Village | Pierre-De Saurel | 547 | 529 | +3.4% | 1.55 | 352.9 |
| Matagami | Town | Jamésie | 1,402 | 1,453 | −3.5% | 75.12 | 18.7 |
| Matane | Town | La Matanie | 13,987 | 14,311 | −2.3% | 195.49 | 71.5 |
| Matapédia | Municipality | Avignon | 566 | 645 | −12.2% | 71.59 | 7.9 |
| Mayo | Municipality | Papineau | 704 | 601 | +17.1% | 72.51 | 9.7 |
| McMasterville | Town | La Vallée-du-Richelieu | 5,936 | 5,698 | +4.2% | 3.12 | 1,902.6 |
| Melbourne | Township | Le Val-Saint-François | 1,096 | 1,063 | +3.1% | 173.93 | 6.3 |
| Mercier | Town | Roussillon | 14,626 | 13,115 | +11.5% | 45.96 | 318.2 |
| Messines | Municipality | La Vallée-de-la-Gatineau | 1,655 | 1,609 | +2.9% | 110.11 | 15.0 |
| Métabetchouan--Lac-à-la-Croix | Town | Lac-Saint-Jean-Est | 4,121 | 3,985 | +3.4% | 187.49 | 22.0 |
| Métis-sur-Mer | Town | La Mitis | 594 | 572 | +3.8% | 48.22 | 12.3 |
| Milan | Municipality | Le Granit | 318 | 299 | +6.4% | 129.44 | 2.5 |
| Mille-Isles | Municipality | Argenteuil | 1,721 | 1,567 | +9.8% | 58.73 | 29.3 |
| Mirabel | Town | Mirabel | 61,108 | 50,513 | +21.0% | 484.09 | 126.2 |
| Mistissini | Cree village | Nord-du-Québec | 10 | 0 | NA | 488.03 | 0.0 |
| Moffet | Municipality | Témiscamingue | 206 | 187 | +10.2% | 340.31 | 0.6 |
| Mont-Blanc | Municipality | Les Laurentides | 3,780 | 3,499 | +8.0% | 120.21 | 31.4 |
| Mont-Carmel | Municipality | Kamouraska | 1,160 | 1,127 | +2.9% | 428.26 | 2.7 |
| Mont-Joli | Town | La Mitis | 6,384 | 6,281 | +1.6% | 24.24 | 263.4 |
| Mont-Laurier | Town | Antoine-Labelle | 14,180 | 14,116 | +0.5% | 587.42 | 24.1 |
| Mont-Royal | Town | Montréal | 20,953 | 20,276 | +3.3% | 7.55 | 2,775.2 |
| Mont-Saint-Grégoire | Municipality | Le Haut-Richelieu | 3,136 | 3,077 | +1.9% | 79.83 | 39.3 |
| Mont-Saint-Hilaire | Town | La Vallée-du-Richelieu | 18,859 | 18,585 | +1.5% | 44.08 | 427.8 |
| Mont-Saint-Michel | Municipality | Antoine-Labelle | 581 | 576 | +0.9% | 138.16 | 4.2 |
| Mont-Saint-Pierre | Village | La Haute-Gaspésie | 186 | 155 | +20.0% | 52.07 | 3.6 |
| Mont-Tremblant | Town | Les Laurentides | 10,992 | 9,646 | +14.0% | 233.75 | 47.0 |
| Montcalm | Municipality | Les Laurentides | 632 | 628 | +0.6% | 117.71 | 5.4 |
| Montcerf-Lytton | Municipality | La Vallée-de-la-Gatineau | 653 | 636 | +2.7% | 354.64 | 1.8 |
| Montebello | Municipality | Papineau | 934 | 983 | −5.0% | 8.60 | 108.6 |
| Montmagny | Town | Montmagny | 10,999 | 11,255 | −2.3% | 124.44 | 88.4 |
| Montpellier | Municipality | Papineau | 1,112 | 985 | +12.9% | 246.12 | 4.5 |
| Montréal | Town | Montréal | 1,762,949 | 1,704,694 | +3.4% | 364.74 | 4,833.4 |
| Montréal-Est | Town | Montréal | 4,394 | 3,850 | +14.1% | 12.15 | 361.6 |
| Montréal-Ouest | Town | Montréal | 5,115 | 5,050 | +1.3% | 1.37 | 3,733.6 |
| Morin-Heights | Municipality | Les Pays-d'en-Haut | 4,678 | 4,145 | +12.9% | 55.96 | 83.6 |
| Mulgrave-et-Derry | Municipality | Papineau | 461 | 369 | +24.9% | 289.52 | 1.6 |
| Murdochville | Town | La Côte-de-Gaspé | 643 | 651 | −1.2% | 60.84 | 10.6 |
| Namur | Municipality | Papineau | 633 | 572 | +10.7% | 56.17 | 11.3 |
| Nantes | Municipality | Le Granit | 1,388 | 1,377 | +0.8% | 119.16 | 11.6 |
| Napierville | Municipality | Les Jardins-de-Napierville | 4,020 | 3,899 | +3.1% | 4.50 | 893.3 |
| Natashquan | Municipality | Minganie | 262 | 263 | −0.4% | 667.91 | 0.4 |
| Nédélec | Township | Témiscamingue | 340 | 356 | −4.5% | 371.49 | 0.9 |
| Nemaska | Cree village | Nord-du-Québec | 0 | 0 | NA | 47.89 | 0.0 |
| Neuville | Town | Portneuf | 4,475 | 4,392 | +1.9% | 71.92 | 62.2 |
| New Carlisle | Municipality | Bonaventure | 1,336 | 1,388 | −3.7% | 67.99 | 19.6 |
| New Richmond | Town | Bonaventure | 3,683 | 3,706 | −0.6% | 172.5 | 21.4 |
| Newport | Municipality | Le Haut-Saint-François | 698 | 733 | −4.8% | 270.63 | 2.6 |
| Nicolet | Town | Nicolet-Yamaska | 8,620 | 8,169 | +5.5% | 96.11 | 89.7 |
| Nominingue | Municipality | Antoine-Labelle | 2,255 | 2,137 | +5.5% | 303.89 | 7.4 |
| Normandin | Town | Maria-Chapdelaine | 2,991 | 3,033 | −1.4% | 211.79 | 14.1 |
| Normétal | Municipality | Abitibi-Ouest | 778 | 808 | −3.7% | 55.25 | 14.1 |
| North Hatley | Village | Memphrémagog | 675 | 632 | +6.8% | 3.35 | 201.5 |
| Notre-Dame-Auxiliatrice-de-Buckland | Parish | Bellechasse | 767 | 768 | −0.1% | 94.71 | 8.1 |
| Notre-Dame-de-Bonsecours | Municipality | Papineau | 285 | 301 | −5.3% | 258.36 | 1.1 |
| Notre-Dame-de-Ham | Municipality | Arthabaska | 414 | 411 | +0.7% | 31.05 | 13.3 |
| Notre-Dame-de-la-Merci | Municipality | Matawinie | 1,097 | 905 | +21.2% | 248.58 | 4.4 |
| Notre-Dame-de-la-Paix | Municipality | Papineau | 675 | 648 | +4.2% | 105.96 | 6.4 |
| Notre-Dame-de-la-Salette | Municipality | Papineau | 841 | 727 | +15.7% | 113.33 | 7.4 |
| Notre-Dame-de-l'Île-Perrot | Town | Vaudreuil-Soulanges | 11,427 | 10,654 | +7.3% | 28.06 | 407.2 |
| Notre-Dame-de-Lorette | Municipality | Maria-Chapdelaine | 159 | 189 | −15.9% | 325.77 | 0.5 |
| Notre-Dame-de-Lourdes | Municipality | Joliette | 3,141 | 2,783 | +12.9% | 35.59 | 88.3 |
| Notre-Dame-de-Lourdes | Parish | L'Érable | 787 | 688 | +14.4% | 81.39 | 9.7 |
| Notre-Dame-de-Montauban | Municipality | Mékinac | 815 | 745 | +9.4% | 162.4 | 5.0 |
| Notre-Dame-de-Pontmain | Municipality | Antoine-Labelle | 790 | 782 | +1.0% | 259.9 | 3.0 |
| Notre-Dame-de-Stanbridge | Municipality | Brome-Missisquoi | 691 | 668 | +3.4% | 43.89 | 15.7 |
| Notre-Dame-des-Anges | Parish | Québec | 241 | 318 | −24.2% | 0.04 | 6,025.0 |
| Notre-Dame-des-Bois | Municipality | Le Granit | 1,028 | 938 | +9.6% | 192.51 | 5.3 |
| Notre-Dame-des-Monts | Municipality | Charlevoix-Est | 789 | 791 | −0.3% | 57.93 | 13.6 |
| Notre-Dame-des-Neiges | Municipality | Les Basques | 1,194 | 1,085 | +10.0% | 94.44 | 12.6 |
| Notre-Dame-des-Pins | Parish | Beauce-Sartigan | 1,812 | 1,594 | +13.7% | 24.09 | 75.2 |
| Notre-Dame-des-Prairies | Town | Joliette | 9,471 | 9,273 | +2.1% | 18.10 | 523.3 |
| Notre-Dame-des-Sept-Douleurs | Parish | Rivière-du-Loup | 71 | 36 | +97.2% | 11.53 | 6.2 |
| Notre-Dame-du-Bon-Conseil | Parish | Drummond | 885 | 949 | −6.7% | 87.49 | 10.1 |
| Notre-Dame-du-Bon-Conseil | Village | Drummond | 1,708 | 1,557 | +9.7% | 4.20 | 406.7 |
| Notre-Dame-du-Laus | Municipality | Antoine-Labelle | 1,730 | 1,558 | +11.0% | 849.1 | 2.0 |
| Notre-Dame-du-Mont-Carmel | Parish | Les Chenaux | 6,121 | 5,751 | +6.4% | 128.29 | 47.7 |
| Notre-Dame-du-Nord | Municipality | Témiscamingue | 1,090 | 1,052 | +3.6% | 74.34 | 14.7 |
| Notre-Dame-du-Portage | Municipality | Rivière-du-Loup | 1,296 | 1,151 | +12.6% | 40.06 | 32.4 |
| Notre-Dame-du-Rosaire | Municipality | Montmagny | 371 | 392 | −5.4% | 164.63 | 2.3 |
| Notre-Dame-du-Sacré-Coeur-d'Issoudun | Parish | Lotbinière | 867 | 861 | +0.7% | 60.32 | 14.4 |
| Nouvelle | Municipality | Avignon | 1,782 | 1,681 | +6.0% | 234.66 | 7.6 |
| Noyan | Municipality | Le Haut-Richelieu | 1,418 | 1,392 | +1.9% | 44.28 | 32.0 |
| Ogden | Municipality | Memphrémagog | 761 | 741 | +2.7% | 74.68 | 10.2 |
| Oka | Municipality | Deux-Montagnes | 3,968 | 3,824 | +3.8% | 56.99 | 69.6 |
| Orford | Township | Memphrémagog | 5,007 | 4,337 | +15.4% | 136.14 | 36.8 |
| Ormstown | Municipality | Le Haut-Saint-Laurent | 3,917 | 3,595 | +9.0% | 142.24 | 27.5 |
| Otter Lake | Municipality | Pontiac | 1,041 | 932 | +11.7% | 454.7 | 2.3 |
| Otterburn Park | Town | La Vallée-du-Richelieu | 8,479 | 8,421 | +0.7% | 5.37 | 1,579.0 |
| Packington | Parish | Témiscouata | 578 | 603 | −4.1% | 118.75 | 4.9 |
| Padoue | Municipality | La Mitis | 250 | 245 | +2.0% | 66.66 | 3.8 |
| Palmarolle | Municipality | Abitibi-Ouest | 1,386 | 1,409 | −1.6% | 117.87 | 11.8 |
| Papineauville | Municipality | Papineau | 2,153 | 2,101 | +2.5% | 61.13 | 35.2 |
| Parisville | Parish | Bécancour | 396 | 530 | −25.3% | 35.58 | 11.1 |
| Paspébiac | Town | Bonaventure | 3,033 | 3,164 | −4.1% | 94.98 | 31.9 |
| Percé | Town | Le Rocher-Percé | 3,095 | 3,103 | −0.3% | 432.81 | 7.2 |
| Péribonka | Municipality | Maria-Chapdelaine | 489 | 515 | −5.0% | 110.3 | 4.4 |
| Petit-Saguenay | Municipality | Le Fjord-du-Saguenay | 600 | 634 | −5.4% | 329.63 | 1.8 |
| Petite-Rivière-Saint-François | Municipality | Charlevoix | 953 | 814 | +17.1% | 133.89 | 7.1 |
| Petite-Vallée | Municipality | La Côte-de-Gaspé | 157 | 170 | −7.6% | 39.90 | 3.9 |
| Piedmont | Municipality | Les Pays-d'en-Haut | 3,476 | 2,950 | +17.8% | 24.36 | 142.7 |
| Pierreville | Municipality | Nicolet-Yamaska | 2,104 | 2,143 | −1.8% | 77.71 | 27.1 |
| Pike River | Municipality | Brome-Missisquoi | 503 | 517 | −2.7% | 40.77 | 12.3 |
| Pincourt | Town | Vaudreuil-Soulanges | 14,751 | 14,558 | +1.3% | 7.10 | 2,077.6 |
| Piopolis | Municipality | Le Granit | 398 | 358 | +11.2% | 103.38 | 3.8 |
| Plaisance | Municipality | Papineau | 1,129 | 1,088 | +3.8% | 36.21 | 31.2 |
| Plessisville | Parish | L'Érable | 2,655 | 2,663 | −0.3% | 141.19 | 18.8 |
| Plessisville | Town | L'Érable | 6,414 | 6,551 | −2.1% | 4.92 | 1,303.7 |
| Pohénégamook | Town | Témiscouata | 2,481 | 2,582 | −3.9% | 339.99 | 7.3 |
| Pointe-à-la-Croix | Municipality | Avignon | 1,344 | 1,408 | −4.5% | 390.73 | 3.4 |
| Pointe-aux-Outardes | Village | Manicouagan | 1,434 | 1,332 | +7.7% | 75.19 | 19.1 |
| Pointe-Calumet | Municipality | Deux-Montagnes | 6,281 | 6,428 | −2.3% | 4.59 | 1,368.4 |
| Pointe-Claire | Town | Montréal | 33,488 | 31,380 | +6.7% | 18.91 | 1,770.9 |
| Pointe-des-Cascades | Village | Vaudreuil-Soulanges | 1,775 | 1,481 | +19.9% | 2.74 | 647.8 |
| Pointe-Fortune | Municipality | Vaudreuil-Soulanges | 582 | 580 | +0.3% | 8.09 | 71.9 |
| Pointe-Lebel | Village | Manicouagan | 1,817 | 1,918 | −5.3% | 85.54 | 21.2 |
| Pont-Rouge | Town | Portneuf | 10,121 | 9,240 | +9.5% | 121.12 | 83.6 |
| Pontiac | Municipality | Les Collines-de-l'Outaouais | 6,142 | 5,850 | +5.0% | 445.27 | 13.8 |
| Port-Cartier | Town | Sept-Rivières | 6,516 | 6,799 | −4.2% | 1,092.75 | 6.0 |
| Port-Daniel--Gascons | Municipality | Le Rocher-Percé | 2,271 | 2,210 | +2.8% | 300.29 | 7.6 |
| Portage-du-Fort | Village | Pontiac | 232 | 234 | −0.9% | 4.22 | 55.0 |
| Portneuf | Town | Portneuf | 3,329 | 3,187 | +4.5% | 109.1 | 30.5 |
| Portneuf-sur-Mer | Municipality | La Haute-Côte-Nord | 612 | 641 | −4.5% | 181.9 | 3.4 |
| Potton | Township | Memphrémagog | 2,012 | 1,852 | +8.6% | 260.77 | 7.7 |
| Poularies | Municipality | Abitibi-Ouest | 662 | 682 | −2.9% | 168.19 | 3.9 |
| Preissac | Municipality | Abitibi | 914 | 835 | +9.5% | 422.13 | 2.2 |
| Prévost | Town | La Rivière-du-Nord | 13,692 | 13,002 | +5.3% | 34.29 | 399.3 |
| Price | Village | La Mitis | 1,729 | 1,759 | −1.7% | 2.51 | 688.8 |
| Princeville | Town | L'Érable | 6,218 | 6,001 | +3.6% | 195.01 | 31.9 |
| Puvirnituq | Northern village | Nord-du-Québec | 2,129 | 1,779 | +19.7% | 81.61 | 26.1 |
| Quaqtaq | Northern village | Nord-du-Québec | 453 | 403 | +12.4% | 25.82 | 17.5 |
| Québec | Town | Québec | 549,459 | 531,902 | +3.3% | 452.3 | 1,214.8 |
| Racine | Municipality | Le Val-Saint-François | 1,340 | 1,323 | +1.3% | 105.63 | 12.7 |
| Ragueneau | Parish | Manicouagan | 1,314 | 1,343 | −2.2% | 179.83 | 7.3 |
| Rapide-Danseur | Municipality | Abitibi-Ouest | 380 | 328 | +15.9% | 173.73 | 2.2 |
| Rapides-des-Joachims | Municipality | Pontiac | 141 | 156 | −9.6% | 238.9 | 0.6 |
| Rawdon | Municipality | Matawinie | 11,719 | 11,057 | +6.0% | 185.38 | 63.2 |
| Rémigny | Municipality | Témiscamingue | 287 | 280 | +2.5% | 894.05 | 0.3 |
| Repentigny | Town | L'Assomption | 86,100 | 84,285 | +2.2% | 61.52 | 1,399.5 |
| Richelieu | Town | Rouville | 5,742 | 5,236 | +9.7% | 30.96 | 185.5 |
| Richmond | Town | Le Val-Saint-François | 3,259 | 3,232 | +0.8% | 6.98 | 466.9 |
| Rigaud | Town | Vaudreuil-Soulanges | 7,854 | 7,777 | +1.0% | 99.2 | 79.2 |
| Rimouski | Town | Rimouski-Neigette | 48,935 | 48,664 | +0.6% | 339.13 | 144.3 |
| Ripon | Municipality | Papineau | 1,735 | 1,542 | +12.5% | 129.93 | 13.4 |
| Ristigouche-Partie-Sud-Est | Township | Avignon | 170 | 171 | −0.6% | 51.76 | 3.3 |
| Rivière-à-Claude | Municipality | La Haute-Gaspésie | 141 | 128 | +10.2% | 155.95 | 0.9 |
| Rivière-à-Pierre | Municipality | Portneuf | 625 | 584 | +7.0% | 515.62 | 1.2 |
| Rivière-au-Tonnerre | Municipality | Minganie | 281 | 279 | +0.7% | 605.14 | 0.5 |
| Rivière-Beaudette | Municipality | Vaudreuil-Soulanges | 2,489 | 2,097 | +18.7% | 18.48 | 134.7 |
| Rivière-Bleue | Municipality | Témiscouata | 1,261 | 1,230 | +2.5% | 173.42 | 7.3 |
| Rivière-du-Loup | Town | Rivière-du-Loup | 20,118 | 19,507 | +3.1% | 83.74 | 240.2 |
| Rivière-Éternité | Municipality | Le Fjord-du-Saguenay | 414 | 413 | +0.2% | 473.17 | 0.9 |
| Rivière-Héva | Municipality | La Vallée-de-l'Or | 1,495 | 1,419 | +5.4% | 423.27 | 3.5 |
| Rivière-Ouelle | Municipality | Kamouraska | 995 | 970 | +2.6% | 57.50 | 17.3 |
| Rivière-Rouge | Town | Antoine-Labelle | 4,631 | 4,322 | +7.1% | 451.43 | 10.3 |
| Rivière-Saint-Jean | Municipality | Minganie | 227 | 215 | +5.6% | 513.36 | 0.4 |
| Roberval | Town | Le Domaine-du-Roy | 9,840 | 10,046 | −2.1% | 151.36 | 65.0 |
| Roquemaure | Municipality | Abitibi-Ouest | 409 | 395 | +3.5% | 120.02 | 3.4 |
| Rosemère | Town | Thérèse-De Blainville | 14,090 | 13,958 | +0.9% | 10.68 | 1,319.3 |
| Rougemont | Municipality | Rouville | 2,696 | 2,755 | −2.1% | 43.91 | 61.4 |
| Rouyn-Noranda | Town | Rouyn-Noranda | 42,313 | 42,334 | 0.0% | 5,963.57 | 7.1 |
| Roxton | Township | Acton | 1,115 | 1,086 | +2.7% | 148.93 | 7.5 |
| Roxton Falls | Village | Acton | 1,322 | 1,305 | +1.3% | 4.94 | 267.6 |
| Roxton Pond | Municipality | La Haute-Yamaska | 4,224 | 3,809 | +10.9% | 97.64 | 43.3 |
| Sacré-Coeur | Municipality | La Haute-Côte-Nord | 1,684 | 1,803 | −6.6% | 303.15 | 5.6 |
| Sacré-Coeur-de-Jésus | Parish | Les Appalaches | 536 | 521 | +2.9% | 104.73 | 5.1 |
| Saguenay | Town | Saguenay | 144,723 | 145,949 | −0.8% | 1,124.63 | 128.7 |
| Saint-Adalbert | Municipality | L'Islet | 460 | 510 | −9.8% | 216.16 | 2.1 |
| Saint-Adelme | Parish | La Matanie | 484 | 520 | −6.9% | 100.58 | 4.8 |
| Saint-Adelphe | Parish | Mékinac | 922 | 922 | 0.0% | 137.08 | 6.7 |
| Saint-Adolphe-d'Howard | Municipality | Les Pays-d'en-Haut | 3,824 | 3,509 | +9.0% | 135.8 | 28.2 |
| Saint-Adrien | Municipality | Les Sources | 522 | 522 | 0.0% | 98.52 | 5.3 |
| Saint-Adrien-d'Irlande | Municipality | Les Appalaches | 395 | 399 | −1.0% | 53.18 | 7.4 |
| Saint-Agapit | Municipality | Lotbinière | 4,526 | 4,280 | +5.7% | 65.4 | 69.2 |
| Saint-Aimé | Municipality | Pierre-De Saurel | 405 | 461 | −12.1% | 60.53 | 6.7 |
| Saint-Aimé-des-Lacs | Municipality | Charlevoix-Est | 1,158 | 1,095 | +5.8% | 91.61 | 12.6 |
| Saint-Aimé-du-Lac-des-Îles | Municipality | Antoine-Labelle | 815 | 790 | +3.2% | 161.61 | 5.0 |
| Saint-Alban | Municipality | Portneuf | 1,196 | 1,198 | −0.2% | 148.47 | 8.1 |
| Saint-Albert | Municipality | Arthabaska | 1,640 | 1,601 | +2.4% | 69.43 | 23.6 |
| Saint-Alexandre | Municipality | Le Haut-Richelieu | 2,678 | 2,469 | +8.5% | 76.27 | 35.1 |
| Saint-Alexandre-de-Kamouraska | Municipality | Kamouraska | 2,255 | 2,109 | +6.9% | 111.4 | 20.2 |
| Saint-Alexandre-des-Lacs | Parish | La Matapédia | 298 | 268 | +11.2% | 89.82 | 3.3 |
| Saint-Alexis | Municipality | Montcalm | 1,370 | 1,308 | +4.7% | 43.01 | 31.9 |
| Saint-Alexis-de-Matapédia | Municipality | Avignon | 519 | 500 | +3.8% | 84.91 | 6.1 |
| Saint-Alexis-des-Monts | Parish | Maskinongé | 2,999 | 2,981 | +0.6% | 1,035.74 | 2.9 |
| Saint-Alfred | Municipality | Beauce-Centre | 519 | 482 | +7.7% | 43.49 | 11.9 |
| Saint-Alphonse | Municipality | Bonaventure | 711 | 699 | +1.7% | 112.09 | 6.3 |
| Saint-Alphonse-de-Granby | Municipality | La Haute-Yamaska | 3,341 | 3,094 | +8.0% | 50.12 | 66.7 |
| Saint-Alphonse-Rodriguez | Municipality | Matawinie | 3,339 | 3,162 | +5.6% | 97.54 | 34.2 |
| Saint-Amable | Town | Marguerite-D'Youville | 13,322 | 12,167 | +9.5% | 36.77 | 362.3 |
| Saint-Ambroise | Municipality | Le Fjord-du-Saguenay | 3,883 | 3,781 | +2.7% | 149.37 | 26.0 |
| Saint-Ambroise-de-Kildare | Municipality | Joliette | 4,090 | 3,856 | +6.1% | 67.73 | 60.4 |
| Saint-Anaclet-de-Lessard | Parish | Rimouski-Neigette | 3,019 | 3,071 | −1.7% | 126.37 | 23.9 |
| Saint-André-Avellin | Municipality | Papineau | 3,562 | 3,749 | −5.0% | 137.34 | 25.9 |
| Saint-André-d'Argenteuil | Municipality | Argenteuil | 3,053 | 3,020 | +1.1% | 97.69 | 31.3 |
| Saint-André-de-Kamouraska | Municipality | Kamouraska | 658 | 658 | 0.0% | 71.06 | 9.3 |
| Saint-André-de-Restigouche | Municipality | Avignon | 154 | 161 | −4.3% | 143.37 | 1.1 |
| Saint-André-du-Lac-Saint-Jean | Village | Le Domaine-du-Roy | 453 | 467 | −3.0% | 145.43 | 3.1 |
| Saint-Anicet | Municipality | Le Haut-Saint-Laurent | 2,754 | 2,626 | +4.9% | 135.03 | 20.4 |
| Saint-Anselme | Municipality | Bellechasse | 4,047 | 3,938 | +2.8% | 74.22 | 54.5 |
| Saint-Antoine-de-l'Isle-aux-Grues | Parish | Montmagny | 122 | 144 | −15.3% | 23.97 | 5.1 |
| Saint-Antoine-de-Tilly | Municipality | Lotbinière | 1,682 | 1,598 | +5.3% | 59.95 | 28.1 |
| Saint-Antoine-sur-Richelieu | Municipality | La Vallée-du-Richelieu | 1,738 | 1,694 | +2.6% | 65.67 | 26.5 |
| Saint-Antonin | Town | Rivière-du-Loup | 4,338 | 4,049 | +7.1% | 175.93 | 24.7 |
| Saint-Apollinaire | Municipality | Lotbinière | 7,968 | 6,110 | +30.4% | 96.83 | 82.3 |
| Saint-Armand | Municipality | Brome-Missisquoi | 1,228 | 1,205 | +1.9% | 83.16 | 14.8 |
| Saint-Arsène | Parish | Rivière-du-Loup | 1,245 | 1,230 | +1.2% | 70.81 | 17.6 |
| Saint-Athanase | Municipality | Témiscouata | 303 | 317 | −4.4% | 292.63 | 1.0 |
| Saint-Aubert | Municipality | L'Islet | 1,441 | 1,474 | −2.2% | 98.45 | 14.6 |
| Saint-Augustin | Municipality | Le Golfe-du-Saint-Laurent | 425 | 445 | −4.5% | 1,137.68 | 0.4 |
| Saint-Augustin | Parish | Maria-Chapdelaine | 334 | 351 | −4.8% | 104.25 | 3.2 |
| Saint-Augustin-de-Desmaures | Town | Québec | 19,907 | 18,820 | +5.8% | 85.8 | 232.0 |
| Saint-Augustin-de-Woburn | Parish | Le Granit | 667 | 692 | −3.6% | 281.07 | 2.4 |
| Saint-Barnabé | Parish | Maskinongé | 1,186 | 1,196 | −0.8% | 58.94 | 20.1 |
| Saint-Barnabé-Sud | Municipality | Les Maskoutains | 962 | 861 | +11.7% | 57.20 | 16.8 |
| Saint-Barthélemy | Parish | D'Autray | 2,087 | 1,934 | +7.9% | 105.36 | 19.8 |
| Saint-Basile | Town | Portneuf | 2,709 | 2,621 | +3.4% | 98.84 | 27.4 |
| Saint-Basile-le-Grand | Town | La Vallée-du-Richelieu | 17,053 | 17,059 | 0.0% | 35.84 | 475.8 |
| Saint-Benjamin | Municipality | Les Etchemins | 1,090 | 987 | +10.4% | 111.53 | 9.8 |
| Saint-Benoît-du-Lac | Municipality | Memphrémagog | 43 | 32 | +34.4% | 2.18 | 19.7 |
| Saint-Benoît-Labre | Municipality | Beauce-Sartigan | 1,617 | 1,630 | −0.8% | 85.65 | 18.9 |
| Saint-Bernard | Municipality | La Nouvelle-Beauce | 2,535 | 2,321 | +9.2% | 90.1 | 28.1 |
| Saint-Bernard-de-Lacolle | Municipality | Les Jardins-de-Napierville | 1,542 | 1,549 | −0.5% | 113.36 | 13.6 |
| Saint-Bernard-de-Michaudville | Municipality | Les Maskoutains | 616 | 586 | +5.1% | 66.05 | 9.3 |
| Saint-Blaise-sur-Richelieu | Municipality | Le Haut-Richelieu | 2,092 | 2,066 | +1.3% | 69.54 | 30.1 |
| Saint-Bonaventure | Municipality | Drummond | 1,066 | 1,031 | +3.4% | 78.72 | 13.5 |
| Saint-Boniface | Municipality | Maskinongé | 5,156 | 4,832 | +6.7% | 107.42 | 48.0 |
| Saint-Bruno | Municipality | Lac-Saint-Jean-Est | 2,902 | 2,801 | +3.6% | 77.86 | 37.3 |
| Saint-Bruno-de-Guigues | Municipality | Témiscamingue | 1,185 | 1,154 | +2.7% | 125.77 | 9.4 |
| Saint-Bruno-de-Kamouraska | Municipality | Kamouraska | 515 | 541 | −4.8% | 188.44 | 2.7 |
| Saint-Bruno-de-Montarville | Town | Longueuil | 26,273 | 26,197 | +0.3% | 42.85 | 613.1 |
| Saint-Calixte | Municipality | Montcalm | 6,792 | 6,046 | +12.3% | 142.63 | 47.6 |
| Saint-Camille | Township | Les Sources | 551 | 529 | +4.2% | 83.1 | 6.6 |
| Saint-Camille-de-Lellis | Parish | Les Etchemins | 737 | 752 | −2.0% | 251.93 | 2.9 |
| Saint-Casimir | Municipality | Portneuf | 1,449 | 1,430 | +1.3% | 66.5 | 21.8 |
| Saint-Célestin | Municipality | Nicolet-Yamaska | 594 | 575 | +3.3% | 76.99 | 7.7 |
| Saint-Célestin | Village | Nicolet-Yamaska | 892 | 831 | +7.3% | 1.41 | 632.6 |
| Saint-Césaire | Town | Rouville | 5,972 | 5,877 | +1.6% | 83.06 | 71.9 |
| Saint-Charles-Borromée | Town | Joliette | 15,285 | 13,791 | +10.8% | 18.48 | 827.1 |
| Saint-Charles-de-Bellechasse | Municipality | Bellechasse | 2,583 | 2,396 | +7.8% | 93.3 | 27.7 |
| Saint-Charles-de-Bourget | Municipality | Le Fjord-du-Saguenay | 784 | 736 | +6.5% | 62.13 | 12.6 |
| Saint-Charles-Garnier | Parish | La Mitis | 222 | 240 | −7.5% | 84.79 | 2.6 |
| Saint-Charles-sur-Richelieu | Municipality | La Vallée-du-Richelieu | 1,735 | 1,717 | +1.0% | 64.91 | 26.7 |
| Saint-Christophe-d'Arthabaska | Parish | Arthabaska | 3,111 | 3,021 | +3.0% | 68.96 | 45.1 |
| Saint-Chrysostome | Municipality | Le Haut-Saint-Laurent | 2,582 | 2,645 | −2.4% | 100.2 | 25.8 |
| Saint-Claude | Municipality | Le Val-Saint-François | 1,141 | 1,185 | −3.7% | 118.85 | 9.6 |
| Saint-Clément | Municipality | Les Basques | 479 | 460 | +4.1% | 86.72 | 5.5 |
| Saint-Cléophas | Parish | La Matapédia | 321 | 333 | −3.6% | 97.22 | 3.3 |
| Saint-Cléophas-de-Brandon | Municipality | D'Autray | 254 | 227 | +11.9% | 15.34 | 16.6 |
| Saint-Clet | Municipality | Vaudreuil-Soulanges | 1,700 | 1,779 | −4.4% | 39.32 | 43.2 |
| Saint-Colomban | Town | La Rivière-du-Nord | 17,740 | 16,019 | +10.7% | 92.71 | 191.3 |
| Saint-Côme | Municipality | Matawinie | 2,583 | 2,193 | +17.8% | 164.89 | 15.7 |
| Saint-Côme--Linière | Municipality | Beauce-Sartigan | 3,278 | 3,239 | +1.2% | 150.45 | 21.8 |
| Saint-Constant | Town | Roussillon | 29,954 | 27,359 | +9.5% | 57.06 | 525.0 |
| Saint-Cuthbert | Municipality | D'Autray | 1,821 | 1,862 | −2.2% | 131.72 | 13.8 |
| Saint-Cyprien | Municipality | Rivière-du-Loup | 1,078 | 1,066 | +1.1% | 138.43 | 7.8 |
| Saint-Cyprien | Parish | Les Etchemins | 474 | 490 | −3.3% | 93.48 | 5.1 |
| Saint-Cyprien-de-Napierville | Municipality | Les Jardins-de-Napierville | 1,735 | 1,927 | −10.0% | 97.75 | 17.7 |
| Saint-Cyrille-de-Lessard | Parish | L'Islet | 742 | 718 | +3.3% | 230.52 | 3.2 |
| Saint-Cyrille-de-Wendover | Municipality | Drummond | 4,920 | 4,723 | +4.2% | 110.2 | 44.6 |
| Saint-Damase | Municipality | Les Maskoutains | 2,447 | 2,473 | −1.1% | 79.65 | 30.7 |
| Saint-Damase | Parish | La Matapédia | 382 | 356 | +7.3% | 116.42 | 3.3 |
| Saint-Damase-de-L'Islet | Municipality | L'Islet | 563 | 552 | +2.0% | 247.64 | 2.3 |
| Saint-Damien | Parish | Matawinie | 2,393 | 2,094 | +14.3% | 252.28 | 9.5 |
| Saint-Damien-de-Buckland | Parish | Bellechasse | 1,893 | 1,956 | −3.2% | 82.04 | 23.1 |
| Saint-David | Municipality | Pierre-De Saurel | 872 | 817 | +6.7% | 92.97 | 9.4 |
| Saint-David-de-Falardeau | Municipality | Le Fjord-du-Saguenay | 2,996 | 2,768 | +8.2% | 398.25 | 7.5 |
| Saint-Denis-De La Bouteillerie | Municipality | Kamouraska | 518 | 517 | +0.2% | 33.84 | 15.3 |
| Saint-Denis-de-Brompton | Municipality | Le Val-Saint-François | 4,594 | 4,054 | +13.3% | 70.29 | 65.4 |
| Saint-Denis-sur-Richelieu | Municipality | La Vallée-du-Richelieu | 2,339 | 2,308 | +1.3% | 84.64 | 27.6 |
| Saint-Didace | Parish | D'Autray | 688 | 652 | +5.5% | 99.6 | 6.9 |
| Saint-Dominique | Municipality | Les Maskoutains | 2,741 | 2,553 | +7.4% | 70.53 | 38.9 |
| Saint-Dominique-du-Rosaire | Municipality | Abitibi | 434 | 450 | −3.6% | 479.89 | 0.9 |
| Saint-Donat | Municipality | Matawinie | 4,561 | 3,888 | +17.3% | 350.17 | 13.0 |
| Saint-Donat | Parish | La Mitis | 835 | 876 | −4.7% | 95.8 | 8.7 |
| Saint-Edmond-de-Grantham | Municipality | Drummond | 804 | 762 | +5.5% | 48.29 | 16.6 |
| Saint-Edmond-les-Plaines | Municipality | Maria-Chapdelaine | 355 | 381 | −6.8% | 84.39 | 4.2 |
| Saint-Édouard | Municipality | Les Jardins-de-Napierville | 1,365 | 1,321 | +3.3% | 52.68 | 25.9 |
| Saint-Édouard-de-Fabre | Parish | Témiscamingue | 671 | 628 | +6.8% | 190.29 | 3.5 |
| Saint-Édouard-de-Lotbinière | Parish | Lotbinière | 1,240 | 1,194 | +3.9% | 98.43 | 12.6 |
| Saint-Édouard-de-Maskinongé | Municipality | Maskinongé | 798 | 712 | +12.1% | 52.82 | 15.1 |
| Saint-Élie-de-Caxton | Municipality | Maskinongé | 1,934 | 1,836 | +5.3% | 116.84 | 16.6 |
| Saint-Éloi | Parish | Les Basques | 310 | 286 | +8.4% | 65.77 | 4.7 |
| Saint-Elphège | Parish | Nicolet-Yamaska | 251 | 270 | −7.0% | 40.53 | 6.2 |
| Saint-Elzéar | Municipality | Bonaventure | 464 | 458 | +1.3% | 204.16 | 2.3 |
| Saint-Elzéar | Municipality | La Nouvelle-Beauce | 2,623 | 2,400 | +9.3% | 87.07 | 30.1 |
| Saint-Elzéar-de-Témiscouata | Municipality | Témiscouata | 311 | 321 | −3.1% | 151.14 | 2.1 |
| Saint-Émile-de-Suffolk | Municipality | Papineau | 512 | 477 | +7.3% | 55.68 | 9.2 |
| Saint-Éphrem-de-Beauce | Municipality | Beauce-Sartigan | 2,323 | 2,400 | −3.2% | 118.9 | 19.5 |
| Saint-Épiphane | Municipality | Rivière-du-Loup | 836 | 827 | +1.1% | 82.85 | 10.1 |
| Saint-Esprit | Municipality | Montcalm | 2,011 | 1,967 | +2.2% | 54.19 | 37.1 |
| Saint-Étienne-de-Beauharnois | Municipality | Beauharnois-Salaberry | 1,099 | 831 | +32.3% | 40.63 | 27.0 |
| Saint-Étienne-de-Bolton | Municipality | Memphrémagog | 816 | 674 | +21.1% | 47.27 | 17.3 |
| Saint-Étienne-des-Grès | Parish | Maskinongé | 4,539 | 4,541 | 0.0% | 104.54 | 43.4 |
| Saint-Eugène | Municipality | Drummond | 1,139 | 1,126 | +1.2% | 75.84 | 15.0 |
| Saint-Eugène-d'Argentenay | Municipality | Maria-Chapdelaine | 487 | 488 | −0.2% | 87.05 | 5.6 |
| Saint-Eugène-de-Guigues | Municipality | Témiscamingue | 458 | 465 | −1.5% | 109.52 | 4.2 |
| Saint-Eugène-de-Ladrière | Parish | Rimouski-Neigette | 413 | 378 | +9.3% | 331.36 | 1.2 |
| Saint-Eusèbe | Parish | Témiscouata | 587 | 593 | −1.0% | 129.56 | 4.5 |
| Saint-Eustache | Town | Deux-Montagnes | 45,276 | 44,008 | +2.9% | 70.51 | 642.1 |
| Saint-Évariste-de-Forsyth | Municipality | Beauce-Sartigan | 511 | 545 | −6.2% | 110.85 | 4.6 |
| Saint-Fabien | Parish | Rimouski-Neigette | 1,834 | 1,837 | −0.2% | 119.92 | 15.3 |
| Saint-Fabien-de-Panet | Parish | Montmagny | 945 | 954 | −0.9% | 187.01 | 5.1 |
| Saint-Félicien | Town | Le Domaine-du-Roy | 10,089 | 10,238 | −1.5% | 361.27 | 27.9 |
| Saint-Félix-de-Dalquier | Municipality | Abitibi | 1,026 | 940 | +9.1% | 113.15 | 9.1 |
| Saint-Félix-de-Kingsey | Municipality | Drummond | 1,493 | 1,430 | +4.4% | 126.28 | 11.8 |
| Saint-Félix-de-Valois | Municipality | Matawinie | 6,975 | 6,305 | +10.6% | 88.4 | 78.9 |
| Saint-Félix-d'Otis | Municipality | Le Fjord-du-Saguenay | 1,109 | 956 | +16.0% | 233.16 | 4.8 |
| Saint-Ferdinand | Municipality | L'Érable | 2,007 | 2,076 | −3.3% | 137.16 | 14.6 |
| Saint-Ferréol-les-Neiges | Municipality | La Côte-de-Beaupré | 3,806 | 3,240 | +17.5% | 83.18 | 45.8 |
| Saint-Flavien | Municipality | Lotbinière | 1,619 | 1,618 | +0.1% | 66.16 | 24.5 |
| Saint-Fortunat | Municipality | Les Appalaches | 255 | 263 | −3.0% | 76.09 | 3.4 |
| Saint-François-d'Assise | Municipality | Avignon | 679 | 644 | +5.4% | 179.34 | 3.8 |
| Saint-François-de-la-Rivière-du-Sud | Municipality | Montmagny | 1,580 | 1,623 | −2.6% | 96.35 | 16.4 |
| Saint-François-de-l'Île-d'Orléans | Municipality | L'Île-d'Orléans | 536 | 527 | +1.7% | 28.96 | 18.5 |
| Saint-François-de-Sales | Municipality | Le Domaine-du-Roy | 643 | 616 | +4.4% | 197.2 | 3.3 |
| Saint-François-du-Lac | Municipality | Nicolet-Yamaska | 1,898 | 1,965 | −3.4% | 63.8 | 29.7 |
| Saint-François-Xavier-de-Brompton | Municipality | Le Val-Saint-François | 2,469 | 2,273 | +8.6% | 97.71 | 25.3 |
| Saint-François-Xavier-de-Viger | Municipality | Rivière-du-Loup | 247 | 245 | +0.8% | 111.27 | 2.2 |
| Saint-Frédéric | Parish | Beauce-Centre | 1,065 | 997 | +6.8% | 72.35 | 14.7 |
| Saint-Fulgence | Municipality | Le Fjord-du-Saguenay | 2,061 | 2,071 | −0.5% | 351.91 | 5.9 |
| Saint-Gabriel | Town | D'Autray | 2,803 | 2,640 | +6.2% | 2.81 | 997.5 |
| Saint-Gabriel-de-Brandon | Municipality | D'Autray | 2,684 | 2,635 | +1.9% | 99.23 | 27.0 |
| Saint-Gabriel-de-Rimouski | Municipality | La Mitis | 1,177 | 1,167 | +0.9% | 126.98 | 9.3 |
| Saint-Gabriel-de-Valcartier | Municipality | La Jacques-Cartier | 3,223 | 3,382 | −4.7% | 432.62 | 7.4 |
| Saint-Gabriel-Lalemant | Municipality | Kamouraska | 660 | 716 | −7.8% | 77.92 | 8.5 |
| Saint-Gédéon | Municipality | Lac-Saint-Jean-Est | 2,177 | 2,085 | +4.4% | 63.38 | 34.3 |
| Saint-Gédéon-de-Beauce | Municipality | Beauce-Sartigan | 2,093 | 2,205 | −5.1% | 197.37 | 10.6 |
| Saint-Georges | Town | Beauce-Sartigan | 32,935 | 32,513 | +1.3% | 199.08 | 165.4 |
| Saint-Georges-de-Windsor | Municipality | Les Sources | 958 | 958 | 0.0% | 127.46 | 7.5 |
| Saint-Gérard-Majella | Parish | Pierre-De Saurel | 240 | 242 | −0.8% | 38.32 | 6.3 |
| Saint-Germain-de-Grantham | Municipality | Drummond | 4,922 | 4,917 | +0.1% | 87.47 | 56.3 |
| Saint-Germain-de-Kamouraska | Municipality | Kamouraska | 294 | 286 | +2.8% | 28.53 | 10.3 |
| Saint-Gervais | Municipality | Bellechasse | 2,138 | 2,153 | −0.7% | 89.33 | 23.9 |
| Saint-Gilbert | Parish | Portneuf | 283 | 296 | −4.4% | 37.44 | 7.6 |
| Saint-Gilles | Municipality | Lotbinière | 2,910 | 2,525 | +15.2% | 177.43 | 16.4 |
| Saint-Godefroi | Township | Bonaventure | 350 | 380 | −7.9% | 63.57 | 5.5 |
| Saint-Guillaume | Municipality | Drummond | 1,491 | 1,476 | +1.0% | 87.91 | 17.0 |
| Saint-Guy | Municipality | Les Basques | 76 | 54 | +40.7% | 139.54 | 0.5 |
| Saint-Henri | Municipality | Bellechasse | 5,813 | 5,611 | +3.6% | 122.61 | 47.4 |
| Saint-Henri-de-Taillon | Municipality | Lac-Saint-Jean-Est | 803 | 826 | −2.8% | 61.74 | 13.0 |
| Saint-Herménégilde | Municipality | Coaticook | 690 | 670 | +3.0% | 166.15 | 4.2 |
| Saint-Hilaire-de-Dorset | Parish | Beauce-Sartigan | 96 | 95 | +1.1% | 186.77 | 0.5 |
| Saint-Hilarion | Parish | Charlevoix | 1,146 | 1,127 | +1.7% | 100.3 | 11.4 |
| Saint-Hippolyte | Municipality | La Rivière-du-Nord | 10,669 | 9,113 | +17.1% | 119.5 | 89.3 |
| Saint-Honoré | Town | Le Fjord-du-Saguenay | 6,376 | 5,757 | +10.8% | 189.38 | 33.7 |
| Saint-Honoré-de-Shenley | Municipality | Beauce-Sartigan | 1,555 | 1,517 | +2.5% | 133.96 | 11.6 |
| Saint-Honoré-de-Témiscouata | Municipality | Témiscouata | 763 | 741 | +3.0% | 262.97 | 2.9 |
| Saint-Hubert-de-Rivière-du-Loup | Municipality | Rivière-du-Loup | 1,412 | 1,279 | +10.4% | 192.2 | 7.3 |
| Saint-Hugues | Municipality | Les Maskoutains | 1,340 | 1,327 | +1.0% | 84.64 | 15.8 |
| Saint-Hyacinthe | Town | Les Maskoutains | 57,239 | 55,648 | +2.9% | 188.85 | 303.1 |
| Saint-Ignace-de-Loyola | Municipality | D'Autray | 2,048 | 2,049 | 0.0% | 31.90 | 64.2 |
| Saint-Ignace-de-Stanbridge | Municipality | Brome-Missisquoi | 677 | 676 | +0.1% | 69.42 | 9.8 |
| Saint-Irénée | Municipality | Charlevoix-Est | 678 | 641 | +5.8% | 59.92 | 11.3 |
| Saint-Isidore | Municipality | La Nouvelle-Beauce | 3,286 | 2,880 | +14.1% | 102.61 | 32.0 |
| Saint-Isidore | Parish | Roussillon | 2,769 | 2,608 | +6.2% | 52.29 | 53.0 |
| Saint-Isidore-de-Clifton | Municipality | Le Haut-Saint-François | 673 | 695 | −3.2% | 176.94 | 3.8 |
| Saint-Jacques | Municipality | Montcalm | 4,302 | 3,971 | +8.3% | 67.17 | 64.0 |
| Saint-Jacques-de-Leeds | Municipality | Les Appalaches | 711 | 685 | +3.8% | 80.56 | 8.8 |
| Saint-Jacques-le-Majeur-de-Wolfestown | Parish | Les Appalaches | 186 | 188 | −1.1% | 58.71 | 3.2 |
| Saint-Jacques-le-Mineur | Municipality | Les Jardins-de-Napierville | 1,766 | 1,690 | +4.5% | 67.18 | 26.3 |
| Saint-Janvier-de-Joly | Municipality | Lotbinière | 1,079 | 984 | +9.7% | 109.88 | 9.8 |
| Saint-Jean-Baptiste | Municipality | La Vallée-du-Richelieu | 3,179 | 3,107 | +2.3% | 72.36 | 43.9 |
| Saint-Jean-de-Brébeuf | Municipality | Les Appalaches | 351 | 372 | −5.6% | 79.15 | 4.4 |
| Saint-Jean-de-Cherbourg | Parish | La Matanie | 163 | 165 | −1.2% | 113.96 | 1.4 |
| Saint-Jean-de-Dieu | Municipality | Les Basques | 1,651 | 1,596 | +3.4% | 152.04 | 10.9 |
| Saint-Jean-de-la-Lande | Municipality | Témiscouata | 232 | 248 | −6.5% | 107.03 | 2.2 |
| Saint-Jean-de-l'Île-d'Orléans | Municipality | L'Île-d'Orléans | 1,026 | 1,059 | −3.1% | 43.48 | 23.6 |
| Saint-Jean-de-Matha | Municipality | Matawinie | 4,838 | 4,450 | +8.7% | 109.49 | 44.2 |
| Saint-Jean-Port-Joli | Municipality | L'Islet | 3,329 | 3,407 | −2.3% | 69.31 | 48.0 |
| Saint-Jean-sur-Richelieu | Town | Le Haut-Richelieu | 97,873 | 95,114 | +2.9% | 226.93 | 431.3 |
| Saint-Jérôme | Town | La Rivière-du-Nord | 80,213 | 74,346 | +7.9% | 90.18 | 889.5 |
| Saint-Joachim | Parish | La Côte-de-Beaupré | 1,427 | 1,441 | −1.0% | 42.33 | 33.7 |
| Saint-Joachim-de-Shefford | Municipality | La Haute-Yamaska | 1,476 | 1,301 | +13.5% | 126.91 | 11.6 |
| Saint-Joseph-de-Beauce | Town | Beauce-Centre | 5,014 | 4,858 | +3.2% | 114.7 | 43.7 |
| Saint-Joseph-de-Coleraine | Municipality | Les Appalaches | 1,820 | 1,762 | +3.3% | 126.76 | 14.4 |
| Saint-Joseph-de-Kamouraska | Parish | Kamouraska | 398 | 391 | +1.8% | 84.96 | 4.7 |
| Saint-Joseph-de-Lepage | Parish | La Mitis | 590 | 523 | +12.8% | 30.98 | 19.0 |
| Saint-Joseph-des-Érables | Municipality | Beauce-Centre | 377 | 410 | −8.0% | 51.43 | 7.3 |
| Saint-Joseph-de-Sorel | Town | Pierre-De Saurel | 1,581 | 1,642 | −3.7% | 1.36 | 1,162.5 |
| Saint-Joseph-du-Lac | Municipality | Deux-Montagnes | 7,031 | 6,687 | +5.1% | 41.22 | 170.6 |
| Saint-Jude | Municipality | Les Maskoutains | 1,326 | 1,214 | +9.2% | 77.33 | 17.1 |
| Saint-Jules | Parish | Beauce-Centre | 547 | 539 | +1.5% | 55.73 | 9.8 |
| Saint-Julien | Municipality | Les Appalaches | 378 | 376 | +0.5% | 81.7 | 4.6 |
| Saint-Just-de-Bretenières | Municipality | Montmagny | 639 | 668 | −4.3% | 132.6 | 4.8 |
| Saint-Juste-du-Lac | Municipality | Témiscouata | 543 | 561 | −3.2% | 166.94 | 3.3 |
| Saint-Justin | Municipality | Maskinongé | 961 | 973 | −1.2% | 78.96 | 12.2 |
| Saint-Lambert | Parish | Abitibi-Ouest | 191 | 194 | −1.5% | 99.81 | 1.9 |
| Saint-Lambert | Town | Longueuil | 22,761 | 21,861 | +4.1% | 7.56 | 3,010.7 |
| Saint-Lambert-de-Lauzon | Municipality | La Nouvelle-Beauce | 6,817 | 6,647 | +2.6% | 106.76 | 63.9 |
| Saint-Laurent-de-l'Île-d'Orléans | Municipality | L'Île-d'Orléans | 1,607 | 1,532 | +4.9% | 35.64 | 45.1 |
| Saint-Lazare | Town | Vaudreuil-Soulanges | 22,354 | 19,917 | +12.2% | 66.86 | 334.3 |
| Saint-Lazare-de-Bellechasse | Municipality | Bellechasse | 1,332 | 1,288 | +3.4% | 85.93 | 15.5 |
| Saint-Léandre | Parish | La Matanie | 375 | 400 | −6.2% | 104.72 | 3.6 |
| Saint-Léonard-d'Aston | Municipality | Nicolet-Yamaska | 2,530 | 2,331 | +8.5% | 82.55 | 30.6 |
| Saint-Léonard-de-Portneuf | Municipality | Portneuf | 1,140 | 1,113 | +2.4% | 141.8 | 8.0 |
| Saint-Léon-de-Standon | Parish | Bellechasse | 1,042 | 1,127 | −7.5% | 136.88 | 7.6 |
| Saint-Léon-le-Grand | Parish | La Matapédia | 968 | 953 | +1.6% | 128.26 | 7.5 |
| Saint-Léon-le-Grand | Parish | Maskinongé | 863 | 928 | −7.0% | 75.97 | 11.4 |
| Saint-Liboire | Municipality | Les Maskoutains | 3,036 | 3,062 | −0.8% | 73.82 | 41.1 |
| Saint-Liguori | Municipality | Montcalm | 2,066 | 1,943 | +6.3% | 50.88 | 40.6 |
| Saint-Lin--Laurentides | Town | Montcalm | 24,030 | 20,786 | +15.6% | 118.29 | 203.1 |
| Saint-Louis | Municipality | Les Maskoutains | 740 | 712 | +3.9% | 47.21 | 15.7 |
| Saint-Louis-de-Blandford | Municipality | Arthabaska | 1,076 | 1,011 | +6.4% | 104.36 | 10.3 |
| Saint-Louis-de-Gonzague | Municipality | Les Etchemins | 390 | 374 | +4.3% | 118.01 | 3.3 |
| Saint-Louis-de-Gonzague | Parish | Beauharnois-Salaberry | 1,950 | 1,481 | +31.7% | 77.04 | 25.3 |
| Saint-Louis-de-Gonzague-du-Cap-Tourmente | Parish | La Côte-de-Beaupré | 0 | 5 | −100.0% | 0.42 | 0.0 |
| Saint-Louis-du-Ha! Ha! | Parish | Témiscouata | 1,311 | 1,292 | +1.5% | 112.23 | 11.7 |
| Saint-Luc-de-Bellechasse | Municipality | Les Etchemins | 449 | 438 | +2.5% | 161.99 | 2.8 |
| Saint-Luc-de-Vincennes | Municipality | Les Chenaux | 519 | 545 | −4.8% | 53.78 | 9.7 |
| Saint-Lucien | Municipality | Drummond | 1,801 | 1,647 | +9.4% | 110.99 | 16.2 |
| Saint-Ludger | Municipality | Le Granit | 1,074 | 1,071 | +0.3% | 127.58 | 8.4 |
| Saint-Ludger-de-Milot | Municipality | Lac-Saint-Jean-Est | 637 | 651 | −2.2% | 107.46 | 5.9 |
| Saint-Magloire | Municipality | Les Etchemins | 712 | 676 | +5.3% | 208.61 | 3.4 |
| Saint-Majorique-de-Grantham | Parish | Drummond | 1,384 | 1,388 | −0.3% | 57.5 | 24.1 |
| Saint-Malachie | Parish | Bellechasse | 1,667 | 1,517 | +9.9% | 101.07 | 16.5 |
| Saint-Malo | Municipality | Coaticook | 514 | 475 | +8.2% | 131.83 | 3.9 |
| Saint-Marc-de-Figuery | Parish | Abitibi | 868 | 834 | +4.1% | 80.79 | 10.7 |
| Saint-Marc-des-Carrières | Town | Portneuf | 2,901 | 2,911 | −0.3% | 17.29 | 167.8 |
| Saint-Marc-du-Lac-Long | Parish | Témiscouata | 365 | 397 | −8.1% | 148.64 | 2.5 |
| Saint-Marcel | Municipality | L'Islet | 422 | 428 | −1.4% | 178.83 | 2.4 |
| Saint-Marcel-de-Richelieu | Municipality | Les Maskoutains | 507 | 497 | +2.0% | 51.27 | 9.9 |
| Saint-Marcellin | Parish | Rimouski-Neigette | 397 | 353 | +12.5% | 117.19 | 3.4 |
| Saint-Marc-sur-Richelieu | Municipality | La Vallée-du-Richelieu | 2,245 | 2,172 | +3.4% | 60.92 | 36.9 |
| Saint-Martin | Parish | Beauce-Sartigan | 2,588 | 2,477 | +4.5% | 118 | 21.9 |
| Saint-Mathias-sur-Richelieu | Municipality | Rouville | 4,544 | 4,531 | +0.3% | 47.02 | 96.6 |
| Saint-Mathieu | Municipality | Roussillon | 2,339 | 2,156 | +8.5% | 31.41 | 74.5 |
| Saint-Mathieu-de-Beloeil | Municipality | La Vallée-du-Richelieu | 2,952 | 2,619 | +12.7% | 39.39 | 74.9 |
| Saint-Mathieu-de-Rioux | Municipality | Les Basques | 691 | 639 | +8.1% | 107.27 | 6.4 |
| Saint-Mathieu-d'Harricana | Municipality | Abitibi | 770 | 739 | +4.2% | 105.86 | 7.3 |
| Saint-Mathieu-du-Parc | Municipality | Maskinongé | 1,482 | 1,338 | +10.8% | 218.85 | 6.8 |
| Saint-Maurice | Parish | Les Chenaux | 3,432 | 3,286 | +4.4% | 91.36 | 37.6 |
| Saint-Maxime-du-Mont-Louis | Municipality | La Haute-Gaspésie | 1,047 | 1,134 | −7.7% | 232.67 | 4.5 |
| Saint-Médard | Municipality | Les Basques | 216 | 209 | +3.3% | 75.28 | 2.9 |
| Saint-Michel | Municipality | Les Jardins-de-Napierville | 3,521 | 3,186 | +10.5% | 59.82 | 58.9 |
| Saint-Michel-de-Bellechasse | Municipality | Bellechasse | 1,871 | 1,813 | +3.2% | 43.08 | 43.4 |
| Saint-Michel-des-Saints | Municipality | Matawinie | 2,496 | 2,359 | +5.8% | 493.92 | 5.1 |
| Saint-Michel-du-Squatec | Municipality | Témiscouata | 1,076 | 1,113 | −3.3% | 361.23 | 3.0 |
| Saint-Modeste | Municipality | Rivière-du-Loup | 1,180 | 1,162 | +1.5% | 109.72 | 10.8 |
| Saint-Moïse | Parish | La Matapédia | 542 | 580 | −6.6% | 109.8 | 4.9 |
| Saint-Narcisse | Parish | Les Chenaux | 1,801 | 1,832 | −1.7% | 106.74 | 16.9 |
| Saint-Narcisse-de-Beaurivage | Parish | Lotbinière | 1,152 | 1,106 | +4.2% | 62.07 | 18.6 |
| Saint-Narcisse-de-Rimouski | Parish | Rimouski-Neigette | 1,084 | 961 | +12.8% | 162.4 | 6.7 |
| Saint-Nazaire | Municipality | Lac-Saint-Jean-Est | 2,029 | 2,073 | −2.1% | 144.76 | 14.0 |
| Saint-Nazaire-d'Acton | Parish | Acton | 880 | 884 | −0.5% | 58.04 | 15.2 |
| Saint-Nazaire-de-Dorchester | Parish | Bellechasse | 338 | 363 | −6.9% | 51.56 | 6.6 |
| Saint-Nérée-de-Bellechasse | Municipality | Bellechasse | 744 | 742 | +0.3% | 75.76 | 9.8 |
| Saint-Noël | Village | La Matapédia | 392 | 398 | −1.5% | 45.80 | 8.6 |
| Saint-Norbert | Parish | D'Autray | 1,060 | 1,003 | +5.7% | 74.6 | 14.2 |
| Saint-Norbert-d'Arthabaska | Municipality | Arthabaska | 1,247 | 1,157 | +7.8% | 102.98 | 12.1 |
| Saint-Octave-de-Métis | Parish | La Mitis | 493 | 511 | −3.5% | 75.16 | 6.6 |
| Saint-Odilon-de-Cranbourne | Municipality | Beauce-Centre | 1,407 | 1,374 | +2.4% | 130.61 | 10.8 |
| Saint-Omer | Municipality | L'Islet | 294 | 277 | +6.1% | 122.44 | 2.4 |
| Saint-Onésime-d'Ixworth | Municipality | Kamouraska | 522 | 560 | −6.8% | 102.76 | 5.1 |
| Saint-Ours | Town | Pierre-De Saurel | 1,723 | 1,669 | +3.2% | 59.23 | 29.1 |
| Saint-Pacôme | Municipality | Kamouraska | 1,806 | 1,598 | +13.0% | 29.06 | 62.1 |
| Saint-Pamphile | Town | L'Islet | 2,274 | 2,400 | −5.2% | 137.78 | 16.5 |
| Saint-Pascal | Town | Kamouraska | 3,530 | 3,468 | +1.8% | 59.68 | 59.1 |
| Saint-Patrice-de-Beaurivage | Municipality | Lotbinière | 1,109 | 1,036 | +7.0% | 85.73 | 12.9 |
| Saint-Patrice-de-Sherrington | Municipality | Les Jardins-de-Napierville | 1,963 | 1,960 | +0.2% | 92.55 | 21.2 |
| Saint-Paul | Municipality | Joliette | 6,566 | 5,891 | +11.5% | 49.11 | 133.7 |
| Saint-Paul-d'Abbotsford | Municipality | Rouville | 2,886 | 2,890 | −0.1% | 79.6 | 36.3 |
| Saint-Paul-de-la-Croix | Municipality | Rivière-du-Loup | 313 | 309 | +1.3% | 78.42 | 4.0 |
| Saint-Paul-de-l'Île-aux-Noix | Municipality | Le Haut-Richelieu | 2,141 | 1,980 | +8.1% | 29.85 | 71.7 |
| Saint-Paul-de-Montminy | Municipality | Montmagny | 849 | 785 | +8.2% | 162.77 | 5.2 |
| Saint-Paulin | Municipality | Maskinongé | 1,541 | 1,497 | +2.9% | 95.41 | 16.2 |
| Saint-Philémon | Parish | Bellechasse | 680 | 714 | −4.8% | 146.51 | 4.6 |
| Saint-Philibert | Municipality | Beauce-Sartigan | 379 | 369 | +2.7% | 57.16 | 6.6 |
| Saint-Philippe | Town | Roussillon | 7,597 | 6,320 | +20.2% | 61.96 | 122.6 |
| Saint-Philippe-de-Néri | Parish | Kamouraska | 818 | 832 | −1.7% | 32.65 | 25.1 |
| Saint-Pie | Town | Les Maskoutains | 5,847 | 5,607 | +4.3% | 107.42 | 54.4 |
| Saint-Pie-de-Guire | Parish | Drummond | 446 | 450 | −0.9% | 51.27 | 8.7 |
| Saint-Pierre | Village | Joliette | 286 | 276 | +3.6% | 9.68 | 29.5 |
| Saint-Pierre-Baptiste | Parish | L'Érable | 560 | 527 | +6.3% | 81.77 | 6.8 |
| Saint-Pierre-de-Broughton | Municipality | Les Appalaches | 889 | 898 | −1.0% | 150.56 | 5.9 |
| Saint-Pierre-de-Lamy | Municipality | Témiscouata | 122 | 117 | +4.3% | 110.63 | 1.1 |
| Saint-Pierre-de-la-Rivière-du-Sud | Parish | Montmagny | 840 | 907 | −7.4% | 91.05 | 9.2 |
| Saint-Pierre-de-l'Île-d'Orléans | Municipality | L'Île-d'Orléans | 1,743 | 1,993 | −12.5% | 31.64 | 55.1 |
| Saint-Pierre-les-Becquets | Municipality | Bécancour | 1,183 | 1,137 | +4.0% | 48.14 | 24.6 |
| Saint-Placide | Municipality | Deux-Montagnes | 1,784 | 1,686 | +5.8% | 42.89 | 41.6 |
| Saint-Polycarpe | Municipality | Vaudreuil-Soulanges | 2,372 | 2,224 | +6.7% | 69.88 | 33.9 |
| Saint-Prime | Municipality | Le Domaine-du-Roy | 2,760 | 2,753 | +0.3% | 147.16 | 18.8 |
| Saint-Prosper | Municipality | Les Etchemins | 3,596 | 3,590 | +0.2% | 133.74 | 26.9 |
| Saint-Prosper-de-Champlain | Municipality | Les Chenaux | 482 | 530 | −9.1% | 94.11 | 5.1 |
| Saint-Raphaël | Municipality | Bellechasse | 2,458 | 2,390 | +2.8% | 121.69 | 20.2 |
| Saint-Raymond | Town | Portneuf | 11,108 | 10,358 | +7.2% | 666.2 | 16.7 |
| Saint-Rémi | Town | Les Jardins-de-Napierville | 8,957 | 8,061 | +11.1% | 78.18 | 114.6 |
| Saint-Rémi-de-Tingwick | Municipality | Arthabaska | 446 | 458 | −2.6% | 72.97 | 6.1 |
| Saint-René | Parish | Beauce-Sartigan | 946 | 745 | +27.0% | 61.54 | 15.4 |
| Saint-René-de-Matane | Municipality | La Matanie | 961 | 991 | −3.0% | 253.89 | 3.8 |
| Saint-Robert | Municipality | Pierre-De Saurel | 1,813 | 1,803 | +0.6% | 64.97 | 27.9 |
| Saint-Robert-Bellarmin | Municipality | Le Granit | 529 | 575 | −8.0% | 236.33 | 2.2 |
| Saint-Roch-de-l'Achigan | Municipality | Montcalm | 5,453 | 5,147 | +5.9% | 80.06 | 68.1 |
| Saint-Roch-de-Mékinac | Parish | Mékinac | 304 | 302 | +0.7% | 144.52 | 2.1 |
| Saint-Roch-de-Richelieu | Municipality | Pierre-De Saurel | 2,573 | 2,188 | +17.6% | 34.44 | 74.7 |
| Saint-Roch-des-Aulnaies | Municipality | L'Islet | 955 | 917 | +4.1% | 49.14 | 19.4 |
| Saint-Roch-Ouest | Municipality | Montcalm | 262 | 266 | −1.5% | 20.14 | 13.0 |
| Saint-Romain | Municipality | Le Granit | 711 | 691 | +2.9% | 112.12 | 6.3 |
| Saint-Rosaire | Parish | Arthabaska | 932 | 843 | +10.6% | 109.53 | 8.5 |
| Saint-Samuel | Municipality | Arthabaska | 765 | 744 | +2.8% | 43.21 | 17.7 |
| Saint-Sauveur | Town | Les Pays-d'en-Haut | 11,580 | 10,231 | +13.2% | 47.62 | 243.2 |
| Saint-Sébastien | Municipality | Le Granit | 674 | 657 | +2.6% | 91.95 | 7.3 |
| Saint-Sébastien | Municipality | Le Haut-Richelieu | 692 | 718 | −3.6% | 63.29 | 10.9 |
| Saint-Sévère | Parish | Maskinongé | 337 | 302 | +11.6% | 31.85 | 10.6 |
| Saint-Séverin | Parish | Mékinac | 812 | 846 | −4.0% | 61.65 | 13.2 |
| Saint-Séverin | Parish | Beauce-Centre | 300 | 278 | +7.9% | 58.92 | 5.1 |
| Saint-Siméon | Municipality | Charlevoix-Est | 1,139 | 1,227 | −7.2% | 281.14 | 4.1 |
| Saint-Siméon | Parish | Bonaventure | 1,207 | 1,171 | +3.1% | 56.71 | 21.3 |
| Saint-Simon | Municipality | Les Maskoutains | 1,386 | 1,413 | −1.9% | 69.05 | 20.1 |
| Saint-Simon-de-Rimouski | Municipality | Les Basques | 455 | 426 | +6.8% | 74.84 | 6.1 |
| Saint-Simon-les-Mines | Municipality | Beauce-Sartigan | 573 | 549 | +4.4% | 47.43 | 12.1 |
| Saint-Sixte | Municipality | Papineau | 490 | 469 | +4.5% | 84.34 | 5.8 |
| Saint-Stanislas | Municipality | Les Chenaux | 1,001 | 1,010 | −0.9% | 89.38 | 11.2 |
| Saint-Stanislas | Municipality | Maria-Chapdelaine | 376 | 373 | +0.8% | 153.58 | 2.4 |
| Saint-Stanislas-de-Kostka | Municipality | Beauharnois-Salaberry | 1,852 | 1,654 | +12.0% | 57.69 | 32.1 |
| Saint-Sulpice | Parish | L'Assomption | 3,360 | 3,439 | −2.3% | 36.17 | 92.9 |
| Saint-Sylvère | Municipality | Bécancour | 786 | 791 | −0.6% | 86.3 | 9.1 |
| Saint-Sylvestre | Municipality | Lotbinière | 1,019 | 1,019 | 0.0% | 147.15 | 6.9 |
| Saint-Télesphore | Municipality | Vaudreuil-Soulanges | 754 | 759 | −0.7% | 60.1 | 12.5 |
| Saint-Tharcisius | Parish | La Matapédia | 411 | 421 | −2.4% | 78.84 | 5.2 |
| Saint-Théodore-d'Acton | Municipality | Acton | 1,564 | 1,519 | +3.0% | 82.82 | 18.9 |
| Saint-Théophile | Municipality | Beauce-Sartigan | 702 | 713 | −1.5% | 427.78 | 1.6 |
| Saint-Thomas | Municipality | Joliette | 3,496 | 3,249 | +7.6% | 94.57 | 37.0 |
| Saint-Thomas-Didyme | Municipality | Maria-Chapdelaine | 703 | 676 | +4.0% | 333.25 | 2.1 |
| Saint-Thuribe | Parish | Portneuf | 298 | 286 | +4.2% | 51.00 | 5.8 |
| Saint-Tite | Town | Mékinac | 3,672 | 3,673 | 0.0% | 91.1 | 40.3 |
| Saint-Tite-des-Caps | Municipality | La Côte-de-Beaupré | 1,504 | 1,473 | +2.1% | 129.3 | 11.6 |
| Saint-Ubalde | Municipality | Portneuf | 1,456 | 1,412 | +3.1% | 140.72 | 10.3 |
| Saint-Ulric | Municipality | La Matanie | 1,567 | 1,585 | −1.1% | 120.45 | 13.0 |
| Saint-Urbain | Parish | Charlevoix | 1,320 | 1,373 | −3.9% | 330.57 | 4.0 |
| Saint-Urbain-Premier | Municipality | Beauharnois-Salaberry | 1,332 | 1,264 | +5.4% | 53.28 | 25.0 |
| Saint-Valentin | Municipality | Le Haut-Richelieu | 418 | 447 | −6.5% | 39.27 | 10.6 |
| Saint-Valère | Municipality | Arthabaska | 1,188 | 1,263 | −5.9% | 108.1 | 11.0 |
| Saint-Valérien | Parish | Rimouski-Neigette | 906 | 835 | +8.5% | 145.02 | 6.2 |
| Saint-Valérien-de-Milton | Municipality | Les Maskoutains | 1,767 | 1,793 | −1.5% | 106.92 | 16.5 |
| Saint-Vallier | Municipality | Bellechasse | 1,031 | 1,061 | −2.8% | 44.88 | 23.0 |
| Saint-Venant-de-Paquette | Municipality | Coaticook | 69 | 97 | −28.9% | 58.75 | 1.2 |
| Saint-Vianney | Municipality | La Matapédia | 446 | 441 | +1.1% | 145.6 | 3.1 |
| Saint-Victor | Municipality | Beauce-Centre | 2,313 | 2,448 | −5.5% | 120.45 | 19.2 |
| Saint-Wenceslas | Municipality | Nicolet-Yamaska | 1,167 | 1,157 | +0.9% | 79.57 | 14.7 |
| Saint-Zacharie | Municipality | Les Etchemins | 1,684 | 1,653 | +1.9% | 186.56 | 9.0 |
| Saint-Zénon | Municipality | Matawinie | 1,317 | 1,120 | +17.6% | 460.41 | 2.9 |
| Saint-Zénon-du-Lac-Humqui | Parish | La Matapédia | 370 | 359 | +3.1% | 113.09 | 3.3 |
| Saint-Zéphirin-de-Courval | Parish | Nicolet-Yamaska | 707 | 700 | +1.0% | 71.94 | 9.8 |
| Saint-Zotique | Town | Vaudreuil-Soulanges | 9,618 | 7,934 | +21.2% | 25.04 | 384.1 |
| Sainte-Adèle | Town | Les Pays-d'en-Haut | 14,010 | 12,919 | +8.4% | 119.67 | 117.1 |
| Sainte-Agathe-de-Lotbinière | Municipality | Lotbinière | 1,049 | 1,168 | −10.2% | 166.99 | 6.3 |
| Sainte-Agathe-des-Monts | Town | Les Laurentides | 11,211 | 10,223 | +9.7% | 129.1 | 86.8 |
| Sainte-Angèle-de-Mérici | Municipality | La Mitis | 989 | 953 | +3.8% | 107.78 | 9.2 |
| Sainte-Angèle-de-Monnoir | Municipality | Rouville | 1,828 | 1,823 | +0.3% | 44.80 | 40.8 |
| Sainte-Angèle-de-Prémont | Municipality | Maskinongé | 631 | 596 | +5.9% | 37.73 | 16.7 |
| Sainte-Anne-de-Beaupré | Town | La Côte-de-Beaupré | 2,888 | 2,880 | +0.3% | 62.38 | 46.3 |
| Sainte-Anne-de-Bellevue | Town | Montréal | 5,027 | 4,958 | +1.4% | 10.46 | 480.6 |
| Sainte-Anne-de-la-Pérade | Municipality | Les Chenaux | 2,031 | 2,019 | +0.6% | 109.28 | 18.6 |
| Sainte-Anne-de-la-Pocatière | Parish | Kamouraska | 1,597 | 1,636 | −2.4% | 54.78 | 29.2 |
| Sainte-Anne-de-la-Rochelle | Municipality | Le Val-Saint-François | 625 | 598 | +4.5% | 61.86 | 10.1 |
| Sainte-Anne-de-Sabrevois | Parish | Le Haut-Richelieu | 2,143 | 2,039 | +5.1% | 44.65 | 48.0 |
| Sainte-Anne-des-Lacs | Parish | Les Pays-d'en-Haut | 3,862 | 3,611 | +7.0% | 24.65 | 156.7 |
| Sainte-Anne-des-Monts | Town | La Haute-Gaspésie | 6,121 | 6,437 | −4.9% | 263.51 | 23.2 |
| Sainte-Anne-de-Sorel | Municipality | Pierre-De Saurel | 2,731 | 2,771 | −1.4% | 36.41 | 75.0 |
| Sainte-Anne-des-Plaines | Town | Thérèse-De Blainville | 15,221 | 14,421 | +5.5% | 93.44 | 162.9 |
| Sainte-Anne-du-Lac | Municipality | Antoine-Labelle | 556 | 575 | −3.3% | 320.73 | 1.7 |
| Sainte-Apolline-de-Patton | Parish | Montmagny | 505 | 542 | −6.8% | 256.51 | 2.0 |
| Sainte-Aurélie | Municipality | Les Etchemins | 856 | 847 | +1.1% | 78.25 | 10.9 |
| Sainte-Barbe | Municipality | Le Haut-Saint-Laurent | 1,609 | 1,324 | +21.5% | 40.14 | 40.1 |
| Sainte-Béatrix | Municipality | Matawinie | 2,170 | 1,955 | +11.0% | 82.96 | 26.2 |
| Sainte-Brigide-d'Iberville | Municipality | Le Haut-Richelieu | 1,428 | 1,402 | +1.9% | 70.52 | 20.2 |
| Sainte-Brigitte-de-Laval | Town | La Jacques-Cartier | 8,468 | 7,348 | +15.2% | 108.42 | 78.1 |
| Sainte-Brigitte-des-Saults | Parish | Drummond | 737 | 723 | +1.9% | 70.79 | 10.4 |
| Sainte-Catherine | Town | Roussillon | 17,347 | 17,047 | +1.8% | 9.37 | 1,851.3 |
| Sainte-Catherine-de-Hatley | Municipality | Memphrémagog | 2,741 | 2,479 | +10.6% | 86.34 | 31.7 |
| Sainte-Catherine-de-la-Jacques-Cartier | Town | La Jacques-Cartier | 8,442 | 7,706 | +9.6% | 120.7 | 69.9 |
| Sainte-Cécile-de-Lévrard | Parish | Bécancour | 349 | 372 | −6.2% | 32.32 | 10.8 |
| Sainte-Cécile-de-Milton | Municipality | La Haute-Yamaska | 2,195 | 2,160 | +1.6% | 72.96 | 30.1 |
| Sainte-Cécile-de-Whitton | Municipality | Le Granit | 853 | 863 | −1.2% | 146.46 | 5.8 |
| Sainte-Christine | Parish | Acton | 772 | 730 | +5.8% | 92.12 | 8.4 |
| Sainte-Christine-d'Auvergne | Municipality | Portneuf | 617 | 551 | +12.0% | 143.6 | 4.3 |
| Sainte-Claire | Municipality | Bellechasse | 3,526 | 3,362 | +4.9% | 88.14 | 40.0 |
| Sainte-Clotilde | Municipality | Les Jardins-de-Napierville | 2,646 | 1,622 | +63.1% | 78.21 | 33.8 |
| Sainte-Clotilde-de-Beauce | Municipality | Les Appalaches | 569 | 549 | +3.6% | 60.55 | 9.4 |
| Sainte-Clotilde-de-Horton | Municipality | Arthabaska | 1,563 | 1,569 | −0.4% | 114.66 | 13.6 |
| Sainte-Croix | Municipality | Lotbinière | 2,529 | 2,516 | +0.5% | 69.63 | 36.3 |
| Sainte-Edwidge-de-Clifton | Township | Coaticook | 546 | 504 | +8.3% | 101.84 | 5.4 |
| Sainte-Élisabeth | Municipality | D'Autray | 1,390 | 1,459 | −4.7% | 83 | 16.7 |
| Sainte-Élizabeth-de-Warwick | Municipality | Arthabaska | 383 | 372 | +3.0% | 51.87 | 7.4 |
| Sainte-Émélie-de-l'Énergie | Municipality | Matawinie | 1,741 | 1,567 | +11.1% | 150.08 | 11.6 |
| Sainte-Eulalie | Municipality | Nicolet-Yamaska | 984 | 894 | +10.1% | 86.3 | 11.4 |
| Sainte-Euphémie-sur-Rivière-du-Sud | Municipality | Montmagny | 338 | 320 | +5.6% | 92.44 | 3.7 |
| Sainte-Famille-de-l'Île-d'Orléans | Municipality | L'Île-d'Orléans | 850 | 938 | −9.4% | 50.54 | 16.8 |
| Sainte-Félicité | Municipality | La Matanie | 1,100 | 1,087 | +1.2% | 90.73 | 12.1 |
| Sainte-Félicité | Municipality | L'Islet | 350 | 389 | −10.0% | 94.89 | 3.7 |
| Sainte-Flavie | Parish | La Mitis | 904 | 884 | +2.3% | 38.23 | 23.6 |
| Sainte-Florence | Municipality | La Matapédia | 367 | 384 | −4.4% | 103.48 | 3.5 |
| Sainte-Françoise | Municipality | Bécancour | 467 | 449 | +4.0% | 87.02 | 5.4 |
| Sainte-Françoise | Parish | Les Basques | 383 | 386 | −0.8% | 88.83 | 4.3 |
| Sainte-Geneviève-de-Batiscan | Parish | Les Chenaux | 1,028 | 1,006 | +2.2% | 97.65 | 10.5 |
| Sainte-Geneviève-de-Berthier | Municipality | D'Autray | 2,253 | 2,280 | −1.2% | 67.03 | 33.6 |
| Sainte-Germaine-Boulé | Municipality | Abitibi-Ouest | 941 | 986 | −4.6% | 110.04 | 8.6 |
| Sainte-Gertrude-Manneville | Municipality | Abitibi | 793 | 787 | +0.8% | 316.46 | 2.5 |
| Sainte-Hedwidge | Municipality | Le Domaine-du-Roy | 870 | 846 | +2.8% | 461.67 | 1.9 |
| Sainte-Hélène-de-Bagot | Municipality | Les Maskoutains | 1,696 | 1,688 | +0.5% | 72.41 | 23.4 |
| Sainte-Hélène-de-Chester | Municipality | Arthabaska | 384 | 374 | +2.7% | 83.72 | 4.6 |
| Sainte-Hélène-de-Kamouraska | Municipality | Kamouraska | 891 | 918 | −2.9% | 60.46 | 14.7 |
| Sainte-Hélène-de-Mancebourg | Parish | Abitibi-Ouest | 410 | 373 | +9.9% | 68.15 | 6.0 |
| Sainte-Hénédine | Parish | La Nouvelle-Beauce | 1,440 | 1,271 | +13.3% | 51.53 | 27.9 |
| Sainte-Irène | Parish | La Matapédia | 369 | 327 | +12.8% | 135.09 | 2.7 |
| Sainte-Jeanne-d'Arc | Parish | La Mitis | 217 | 280 | −22.5% | 110.34 | 2.0 |
| Sainte-Jeanne-d'Arc | Village | Maria-Chapdelaine | 1,101 | 1,050 | +4.9% | 267.28 | 4.1 |
| Sainte-Julie | Town | Marguerite-D'Youville | 30,045 | 29,881 | +0.5% | 48.49 | 619.6 |
| Sainte-Julienne | Municipality | Montcalm | 11,173 | 9,953 | +12.3% | 99.42 | 112.4 |
| Sainte-Justine | Municipality | Les Etchemins | 1,828 | 1,820 | +0.4% | 126.28 | 14.5 |
| Sainte-Justine-de-Newton | Municipality | Vaudreuil-Soulanges | 947 | 922 | +2.7% | 84.59 | 11.2 |
| Sainte-Louise | Parish | L'Islet | 674 | 671 | +0.4% | 76.59 | 8.8 |
| Sainte-Luce | Municipality | La Mitis | 2,845 | 2,801 | +1.6% | 72.59 | 39.2 |
| Sainte-Lucie-de-Beauregard | Municipality | Montmagny | 275 | 280 | −1.8% | 82.17 | 3.3 |
| Sainte-Lucie-des-Laurentides | Municipality | Les Laurentides | 1,445 | 1,256 | +15.0% | 108.98 | 13.3 |
| Sainte-Madeleine | Village | Les Maskoutains | 2,268 | 2,233 | +1.6% | 5.36 | 423.1 |
| Sainte-Madeleine-de-la-Rivière-Madeleine | Municipality | La Haute-Gaspésie | 289 | 289 | 0.0% | 262.35 | 1.1 |
| Sainte-Marcelline-de-Kildare | Municipality | Matawinie | 1,795 | 1,594 | +12.6% | 34.52 | 52.0 |
| Sainte-Marguerite | Parish | La Nouvelle-Beauce | 1,175 | 1,078 | +9.0% | 83.05 | 14.1 |
| Sainte-Marguerite-du-Lac-Masson | Town | Les Pays-d'en-Haut | 3,367 | 2,763 | +21.9% | 91.56 | 36.8 |
| Sainte-Marguerite-Marie | Municipality | La Matapédia | 183 | 166 | +10.2% | 85.97 | 2.1 |
| Sainte-Marie | Town | La Nouvelle-Beauce | 13,134 | 13,565 | −3.2% | 107.55 | 122.1 |
| Sainte-Marie-de-Blandford | Municipality | Bécancour | 443 | 468 | −5.3% | 69.3 | 6.4 |
| Sainte-Marie-Madeleine | Parish | Les Maskoutains | 2,876 | 2,892 | −0.6% | 50.04 | 57.5 |
| Sainte-Marie-Salomé | Municipality | Montcalm | 1,221 | 1,209 | +1.0% | 33.79 | 36.1 |
| Sainte-Marthe | Municipality | Vaudreuil-Soulanges | 1,014 | 1,097 | −7.6% | 79.6 | 12.7 |
| Sainte-Marthe-sur-le-Lac | Town | Deux-Montagnes | 19,797 | 18,074 | +9.5% | 8.73 | 2,267.7 |
| Sainte-Martine | Municipality | Beauharnois-Salaberry | 5,664 | 5,461 | +3.7% | 63.06 | 89.8 |
| Sainte-Mélanie | Municipality | Joliette | 3,250 | 2,989 | +8.7% | 76.1 | 42.7 |
| Sainte-Monique | Municipality | Lac-Saint-Jean-Est | 858 | 846 | +1.4% | 152.53 | 5.6 |
| Sainte-Monique | Municipality | Nicolet-Yamaska | 519 | 501 | +3.6% | 58.10 | 8.9 |
| Sainte-Paule | Municipality | La Matanie | 247 | 233 | +6.0% | 83.36 | 3.0 |
| Sainte-Perpétue | Municipality | L'Islet | 1,715 | 1,639 | +4.6% | 291.04 | 5.9 |
| Sainte-Perpétue | Parish | Nicolet-Yamaska | 916 | 959 | −4.5% | 71.51 | 12.8 |
| Sainte-Pétronille | Village | L'Île-d'Orléans | 1,055 | 1,033 | +2.1% | 4.32 | 244.2 |
| Sainte-Praxède | Parish | Les Appalaches | 351 | 327 | +7.3% | 136.18 | 2.6 |
| Sainte-Rita | Municipality | Les Basques | 303 | 307 | −1.3% | 129.52 | 2.3 |
| Sainte-Rose-de-Watford | Municipality | Les Etchemins | 740 | 729 | +1.5% | 115.13 | 6.4 |
| Sainte-Rose-du-Nord | Parish | Le Fjord-du-Saguenay | 434 | 439 | −1.1% | 116.61 | 3.7 |
| Sainte-Sabine | Municipality | Brome-Missisquoi | 1,105 | 1,085 | +1.8% | 55.33 | 20.0 |
| Sainte-Sabine | Parish | Les Etchemins | 343 | 358 | −4.2% | 66.89 | 5.1 |
| Sainte-Séraphine | Parish | Arthabaska | 441 | 355 | +24.2% | 75.86 | 5.8 |
| Sainte-Sophie | Municipality | La Rivière-du-Nord | 18,080 | 15,690 | +15.2% | 111.2 | 162.6 |
| Sainte-Sophie-de-Lévrard | Parish | Bécancour | 704 | 729 | −3.4% | 84.05 | 8.4 |
| Sainte-Sophie-d'Halifax | Municipality | L'Érable | 595 | 612 | −2.8% | 92.13 | 6.5 |
| Sainte-Thècle | Municipality | Mékinac | 2,415 | 2,484 | −2.8% | 212.48 | 11.4 |
| Sainte-Thérèse | Town | Thérèse-De Blainville | 26,533 | 25,989 | +2.1% | 9.48 | 2,798.8 |
| Sainte-Thérèse-de-Gaspé | Municipality | Le Rocher-Percé | 979 | 1,015 | −3.5% | 34.45 | 28.4 |
| Sainte-Thérèse-de-la-Gatineau | Municipality | La Vallée-de-la-Gatineau | 588 | 520 | +13.1% | 60.68 | 9.7 |
| Sainte-Ursule | Municipality | Maskinongé | 1,355 | 1,330 | +1.9% | 67.83 | 20.0 |
| Sainte-Victoire-de-Sorel | Municipality | Pierre-De Saurel | 2,457 | 2,461 | −0.2% | 75.26 | 32.6 |
| Saints-Anges | Municipality | La Nouvelle-Beauce | 1,239 | 1,157 | +7.1% | 68.65 | 18.0 |
| Saints-Martyrs-Canadiens | Parish | Arthabaska | 277 | 254 | +9.1% | 111.4 | 2.5 |
| Salaberry-de-Valleyfield | Town | Beauharnois-Salaberry | 42,787 | 40,745 | +5.0% | 108.56 | 394.1 |
| Salluit | Northern village | Nord-du-Québec | 1,580 | 1,483 | +6.5% | 15.08 | 104.8 |
| Sayabec | Municipality | La Matapédia | 1,706 | 1,831 | −6.8% | 130.31 | 13.1 |
| Schefferville | Town | Caniapiscau | 244 | 130 | +87.7% | 24.76 | 9.9 |
| Scotstown | Town | Le Haut-Saint-François | 459 | 472 | −2.8% | 11.44 | 40.1 |
| Scott | Municipality | La Nouvelle-Beauce | 2,566 | 2,352 | +9.1% | 31.29 | 82.0 |
| Senneterre | Parish | La Vallée-de-l'Or | 1,202 | 1,192 | +0.8% | 567.05 | 2.1 |
| Senneterre | Town | La Vallée-de-l'Or | 2,782 | 2,868 | −3.0% | 14,718.51 | 0.2 |
| Senneville | Village | Montréal | 951 | 921 | +3.3% | 7.45 | 127.7 |
| Sept-Îles | Town | Sept-Rivières | 24,569 | 25,400 | −3.3% | 1,742.88 | 14.1 |
| Shannon | Town | La Jacques-Cartier | 6,432 | 6,031 | +6.6% | 63.54 | 101.2 |
| Shawinigan | Town | Shawinigan | 49,620 | 49,349 | +0.5% | 729.98 | 68.0 |
| Shawville | Municipality | Pontiac | 1,668 | 1,587 | +5.1% | 5.38 | 310.0 |
| Sheenboro | Municipality | Pontiac | 149 | 130 | +14.6% | 565.43 | 0.3 |
| Shefford | Township | La Haute-Yamaska | 7,253 | 6,947 | +4.4% | 117.99 | 61.5 |
| Sherbrooke | Town | Sherbrooke | 172,950 | 161,323 | +7.2% | 353.4 | 489.4 |
| Shigawake | Municipality | Bonaventure | 333 | 292 | +14.0% | 76.82 | 4.3 |
| Sorel-Tracy | Town | Pierre-De Saurel | 35,165 | 34,755 | +1.2% | 57.28 | 613.9 |
| Stanbridge East | Municipality | Brome-Missisquoi | 834 | 866 | −3.7% | 49.41 | 16.9 |
| Stanbridge Station | Municipality | Brome-Missisquoi | 291 | 274 | +6.2% | 18.07 | 16.1 |
| Stanstead | Township | Memphrémagog | 1,148 | 1,036 | +10.8% | 113.2 | 10.1 |
| Stanstead | Town | Memphrémagog | 2,824 | 2,788 | +1.3% | 21.95 | 128.7 |
| Stanstead-Est | Municipality | Coaticook | 642 | 584 | +9.9% | 114.54 | 5.6 |
| Stoke | Municipality | Le Val-Saint-François | 3,014 | 2,955 | +2.0% | 255.12 | 11.8 |
| Stoneham-et-Tewkesbury | United township | La Jacques-Cartier | 9,682 | 8,359 | +15.8% | 670.03 | 14.5 |
| Stornoway | Municipality | Le Granit | 535 | 530 | +0.9% | 180.15 | 3.0 |
| Stratford | Township | Le Granit | 1,036 | 945 | +9.6% | 119.86 | 8.6 |
| Stukely-Sud | Village | Memphrémagog | 1,142 | 1,058 | +7.9% | 63.19 | 18.1 |
| Sutton | Town | Brome-Missisquoi | 4,548 | 4,012 | +13.4% | 245.69 | 18.5 |
| Tadoussac | Village | La Haute-Côte-Nord | 814 | 799 | +1.9% | 52.73 | 15.4 |
| Taschereau | Municipality | Abitibi-Ouest | 898 | 963 | −6.7% | 246.97 | 3.6 |
| Tasiujaq | Northern village | Nord-du-Québec | 420 | 369 | +13.8% | 65.53 | 6.4 |
| Témiscaming | Town | Témiscamingue | 2,368 | 2,431 | −2.6% | 710.84 | 3.3 |
| Témiscouata-sur-le-Lac | Town | Témiscouata | 5,054 | 4,910 | +2.9% | 218.81 | 23.1 |
| Terrasse-Vaudreuil | Municipality | Vaudreuil-Soulanges | 1,887 | 1,986 | −5.0% | 1.06 | 1,780.2 |
| Terrebonne | Town | Les Moulins | 119,944 | 111,575 | +7.5% | 153.76 | 780.1 |
| Thetford Mines | Town | Les Appalaches | 26,072 | 25,403 | +2.6% | 225.97 | 115.4 |
| Thorne | Municipality | Pontiac | 528 | 448 | +17.9% | 173.09 | 3.1 |
| Thurso | Town | Papineau | 3,084 | 2,818 | +9.4% | 6.65 | 463.8 |
| Tingwick | Municipality | Arthabaska | 1,484 | 1,410 | +5.2% | 169.48 | 8.8 |
| Tourville | Municipality | L'Islet | 576 | 589 | −2.2% | 164.36 | 3.5 |
| Trécesson | Township | Abitibi | 1,232 | 1,223 | +0.7% | 196.89 | 6.3 |
| Très-Saint-Rédempteur | Municipality | Vaudreuil-Soulanges | 978 | 898 | +8.9% | 26.06 | 37.5 |
| Très-Saint-Sacrement | Parish | Le Haut-Saint-Laurent | 1,189 | 1,186 | +0.3% | 97.16 | 12.2 |
| Tring-Jonction | Village | Beauce-Centre | 1,526 | 1,448 | +5.4% | 27.32 | 55.9 |
| Trois-Pistoles | Town | Les Basques | 3,115 | 3,246 | −4.0% | 7.63 | 408.3 |
| Trois-Rives | Municipality | Mékinac | 512 | 396 | +29.3% | 597.76 | 0.9 |
| Trois-Rivières | Town | Trois-Rivières | 139,163 | 134,413 | +3.5% | 288.65 | 482.1 |
| Ulverton | Municipality | Le Val-Saint-François | 433 | 418 | +3.6% | 51.27 | 8.4 |
| Umiujaq | Northern village | Nord-du-Québec | 541 | 442 | +22.4% | 28.38 | 19.1 |
| Upton | Municipality | Acton | 2,046 | 2,092 | −2.2% | 54.77 | 37.4 |
| Val-Alain | Municipality | Lotbinière | 986 | 924 | +6.7% | 102.54 | 9.6 |
| Val-Brillant | Municipality | La Matapédia | 899 | 927 | −3.0% | 77.9 | 11.5 |
| Val-d'Or | Town | La Vallée-de-l'Or | 32,752 | 32,491 | +0.8% | 3,536.84 | 9.3 |
| Val-David | Village | Les Laurentides | 5,558 | 4,917 | +13.0% | 42.66 | 130.3 |
| Val-des-Bois | Municipality | Papineau | 920 | 865 | +6.4% | 222.67 | 4.1 |
| Val-des-Lacs | Municipality | Les Laurentides | 750 | 744 | +0.8% | 126.7 | 5.9 |
| Val-des-Monts | Municipality | Les Collines-de-l'Outaouais | 13,328 | 11,582 | +15.1% | 434.77 | 30.7 |
| Val-des-Sources | Town | Les Sources | 7,088 | 6,786 | +4.5% | 30.25 | 234.3 |
| Val-Joli | Municipality | Le Val-Saint-François | 1,671 | 1,619 | +3.2% | 91.69 | 18.2 |
| Val-Morin | Municipality | Les Laurentides | 3,123 | 2,870 | +8.8% | 39.20 | 79.7 |
| Val-Racine | Municipality | Le Granit | 183 | 178 | +2.8% | 116.06 | 1.6 |
| Val-Saint-Gilles | Municipality | Abitibi-Ouest | 169 | 157 | +7.6% | 109.39 | 1.5 |
| Valcourt | Township | Le Val-Saint-François | 1,029 | 1,044 | −1.4% | 80.39 | 12.8 |
| Valcourt | Town | Le Val-Saint-François | 2,139 | 2,165 | −1.2% | 5.41 | 395.4 |
| Vallée-Jonction | Municipality | La Nouvelle-Beauce | 1,864 | 1,875 | −0.6% | 25.45 | 73.2 |
| Varennes | Town | Marguerite-D'Youville | 21,198 | 21,257 | −0.3% | 94.8 | 223.6 |
| Vaudreuil-Dorion | Town | Vaudreuil-Soulanges | 43,268 | 38,117 | +13.5% | 72.65 | 595.6 |
| Vaudreuil-sur-le-Lac | Village | Vaudreuil-Soulanges | 1,361 | 1,341 | +1.5% | 1.38 | 986.2 |
| Venise-en-Québec | Municipality | Le Haut-Richelieu | 1,899 | 1,634 | +16.2% | 13.13 | 144.6 |
| Verchères | Municipality | Marguerite-D'Youville | 5,759 | 5,835 | −1.3% | 72.63 | 79.3 |
| Victoriaville | Town | Arthabaska | 47,760 | 46,130 | +3.5% | 84.33 | 566.3 |
| Ville-Marie | Town | Témiscamingue | 2,464 | 2,584 | −4.6% | 5.83 | 422.6 |
| Villeroy | Municipality | L'Érable | 488 | 457 | +6.8% | 101.9 | 4.8 |
| Waltham | Municipality | Pontiac | 387 | 378 | +2.4% | 360.19 | 1.1 |
| Warden | Village | La Haute-Yamaska | 362 | 363 | −0.3% | 5.46 | 66.3 |
| Warwick | Town | Arthabaska | 4,729 | 4,635 | +2.0% | 109.6 | 43.1 |
| Waskaganish | Cree village | Nord-du-Québec | 0 | 0 | NA | 274.22 | 0.0 |
| Waswanipi | Cree village | Nord-du-Québec | 0 | 0 | NA | 213.35 | 0.0 |
| Waterloo | Town | La Haute-Yamaska | 4,920 | 4,410 | +11.6% | 12.23 | 402.3 |
| Waterville | Town | Coaticook | 2,307 | 2,121 | +8.8% | 44.03 | 52.4 |
| Weedon | Municipality | Le Haut-Saint-François | 2,667 | 2,670 | −0.1% | 215.95 | 12.4 |
| Wemindji | Cree village | Nord-du-Québec | 0 | 0 | NA | 169.12 | 0.0 |
| Wentworth | Township | Argenteuil | 682 | 533 | +28.0% | 85.03 | 8.0 |
| Wentworth-Nord | Municipality | Les Pays-d'en-Haut | 1,672 | 1,361 | +22.9% | 152.87 | 10.9 |
| Westbury | Township | Le Haut-Saint-François | 1,097 | 1,006 | +9.0% | 55.61 | 19.7 |
| Westmount | Town | Montréal | 19,658 | 20,312 | −3.2% | 4.04 | 4,865.8 |
| Whapmagoostui | Cree village | Nord-du-Québec | 0 | 0 | NA | 120.86 | 0.0 |
| Wickham | Municipality | Drummond | 2,587 | 2,541 | +1.8% | 98.63 | 26.2 |
| Windsor | Town | Le Val-Saint-François | 5,294 | 5,419 | −2.3% | 14.53 | 364.3 |
| Wotton | Municipality | Les Sources | 1,402 | 1,430 | −2.0% | 143.15 | 9.8 |
| Yamachiche | Municipality | Maskinongé | 2,813 | 2,830 | −0.6% | 106.39 | 26.4 |
| Yamaska | Municipality | Pierre-De Saurel | 1,736 | 1,687 | +2.9% | 72.82 | 23.8 |
| Sub-total towns | — | — | 7,158,798 | 6,877,177 | +4.1% | 81,910.48 | 87.4 |
| Sub-total village municipalities | — | — | 45,349 | 43,534 | +4.2% | 2,121.08 | 21.4 |
| Sub-total parish municipalities | — | — | 137,250 | 133,968 | +2.4% | 14,680.21 | 9.3 |
| Sub-total township municipalities | — | — | 48,124 | 43,940 | +9.5% | 5,903.21 | 8.2 |
| Sub-total united township municipalities | — | — | 10,002 | 8,654 | +15.6% | 940.14 | 10.6 |
| Sub-total municipalities | — | — | 1,045,898 | 997,098 | +4.9% | 389,672.17 | 2.7 |
| Sub-total Cree village municipalities | — | — | 10 | 0 | NA | 2,111.48 | 0.0 |
| Sub-total Naskapi village municipalities | — | — | 0 | 0 | NA | 234.80 | 0.0 |
| Sub-total northern village municipalities | — | — | 14,045 | 12,502 | +12.3% | 811.50 | 17.3 |
| Total local municipalities | — | — | 8,459,476 | 8,118,266 | +4.2% | 498,385.07 | 17.0 |
| Province of Quebec | — | — | 8,501,833 | 8,164,361 | +4.1% | 1,298,599.75 | 6.5 |
See also
Notes
- The remaining 0.5% of Quebec's population resides on the remaining 61.6% of its land mass within Indian reserves, Indian settlements, Inuit land, lands reserved for the Crees, lands reserved for the Naskapi, and unorganized territories.[12][2]
- Actual population may not be 0 as Statistics Canada, to protect privacy, rounds population to a random interval of 5 between 0 and 15 inclusive in the event a geographic area's actual population is less than 15.[13]
- The province also recognizes 17 unincorporated geographic equivalents to RCMs.[15]
- In 2022, The RCM lost the municipality of Notre-Dame-de-la-Salette to the Papineau RCM.[16]
- In 2022, The RCM gain the municipality of Notre-Dame-de-la-Salette from the Les Collines-de-l'Outaouais RCM.[17]
- Quote(s) are English translations of French-language content in the associated reference.[26]
References
- "Population and dwelling counts, for Canada, provinces and territories, 2021 and 2016 censuses – 100% data". Statistics Canada. March 14, 2022. Retrieved August 17, 2022.
- "Dictionary, Census of Population, 2021 – Table 1.5: Census subdivision types by province and territory, 2021 Census". Statistics Canada. November 21, 2021. Retrieved August 19, 2022.
- "Dictionary, Census of Population, 2021: Census subdivision (CSD)". Statistics Canada. February 28, 2022. Retrieved August 27, 2022.
- "Québec Municipal Organization". Gouvernement du Québec: Affaires Municipales et Régions. December 2006. Retrieved August 27, 2022.
- "Répertoire des municipalités – Nombre de municipalités : 1108". Ministry of Municipal Affairs and Housing. Retrieved August 17, 2022.
- "Répertoire des municipalités – Autres territoires : 179". Ministry of Municipal Affairs and Housing. Retrieved August 17, 2022.
- "Cities and Towns Act". Gouvernement du Québec. April 1, 2022. Retrieved August 20, 2022.
- "The Cree Villages and the Naskapi Village Act". Gouvernement du Québec. April 1, 2022. Retrieved August 22, 2022.
- "Act Respecting Northern Villages and the Kativik Regional Government". Gouvernement du Québec. April 1, 2022. Retrieved August 22, 2022.
- "Municipal Code of Quebec". Gouvernement du Québec. April 1, 2022. Retrieved August 20, 2022.
- "Dorval". Gouvernement du Québec: Commission de toponymie. Retrieved August 19, 2022.
Le 1er janvier 2006, celle-ci a été reconstituée en tant que ville. Le décret permet toutefois à la Ville de Dorval d'utiliser l'appellation Cité de Dorval pour se désigner.
- "Population and dwelling counts: Canada, provinces and territories, census divisions and census subdivisions (municipalities), Quebec". Statistics Canada. February 9, 2022. Retrieved March 20, 2022.
- "Population and Dwelling Count Highlight Tables, 2011 Census – Notes (Adjustment of population counts)". Statistics Canada. January 30, 2013. Retrieved October 31, 2013.
- "Territorial organization, General municipal scheme: The supralocal level". Gouvernement du Québec: Affaires municipales de Québec. Retrieved August 28, 2022.
- "Population and dwelling counts: Regional county municipalities (RCM), Quebec". Statistics Canada. August 27, 2022. Retrieved August 27, 2022.
- "Infolettre MRC de Papineau - janvier 2022 - MRC-Papineau". 27 January 2022.
- "Infolettre MRC de Papineau - janvier 2022 - MRC-Papineau". 27 January 2022.
- "Act Respecting Municipal Territorial Organization". Gouvernement du Québec: Publications Québec. April 1, 2022. Retrieved August 27, 2022.
- "2001 Community Profiles: View data for Quebec or..." Statistics Canada. February 7, 2019. Retrieved August 19, 2022.
- "Interim List of Changes to Municipal Boundaries, Status, and Names From January 2, 2001 to January 1, 2006 – Table 1: Changes to census subdivisions in alphabetical order, by province/territory (Quebec)" (CSV). Statistics Canada. March 11, 2014. Retrieved August 19, 2022.
- "Gazette officielle du Quebec, Partie 2, No. 44, Lois et règlements" (PDF). Èditeur officiel du Québec. November 2, 2005. pp. 6292–6294. Retrieved August 19, 2022.
- "C-19 - Cities and Towns Act, Section 15 (In force date 1984-09-01)". Government of Quebec. September 1, 1984. Retrieved August 18, 2022.
- "C-19 - Cities and Towns Act, Section 16 (In force date 1988-01-01)". Government of Quebec. January 1, 1988. Retrieved August 18, 2022.
- "C-19 - Cities and Towns Act, Section 17 (In force date 1988-01-01)". Government of Quebec. January 1, 1988. Retrieved August 18, 2022.
- "C-19 - Cities and Towns Act, Section 18 (In force date 1988-01-01)". Government of Quebec. January 1, 1988. Retrieved August 18, 2022.
- "Liste complète des types d'entités et leurs définitions". Gouvernement du Québec: Commission de toponymie. June 22, 2022. Retrieved August 21, 2022.